Other possible combinations
As well as using the IR window channel, the background image can be combined with any other coloured single-band image, or with RGB images. One example of another SEVIRI sandwich combination is the HRV and Severe Storms RGB.
Blending HRV and Severe Storms RGB images
This combination is also useful for convection monitoring. Severe Storms RGB provides information on cloud top microphysics, which contains severity-related information. So, it completes the information of the HRV/IR blended image.
The Severe Storms RGB is a high cloud-oriented RGB. Its main application is monitoring the cloud top microphysics of convective clouds. Thick high clouds appear in colour shades from red to yellow in this RGB. The yellow colour shades indicate small ice crystals on the cloud top and/or very cold cloud top temperature. The shade of yellow (from dark to light) depends on the average cloud top particle size and on the cloud top temperature as well. Ice clouds usually have large ice crystals at the top. For the mid-latitude continental storms, the presence of small ice crystals on (or above) the cloud top indicates possible storm severity. This RGB was tuned to highlight such high clouds. Further information on Severe Storms RGB can be found in the EUMeTrain webpage, see the 'Useful links' chapter.
Fig. 6.1 shows a sandwich image blended from HRV and Severe Storms RGB images. The input images and for comparison the HRV/IR10.8 blended images are also shown.
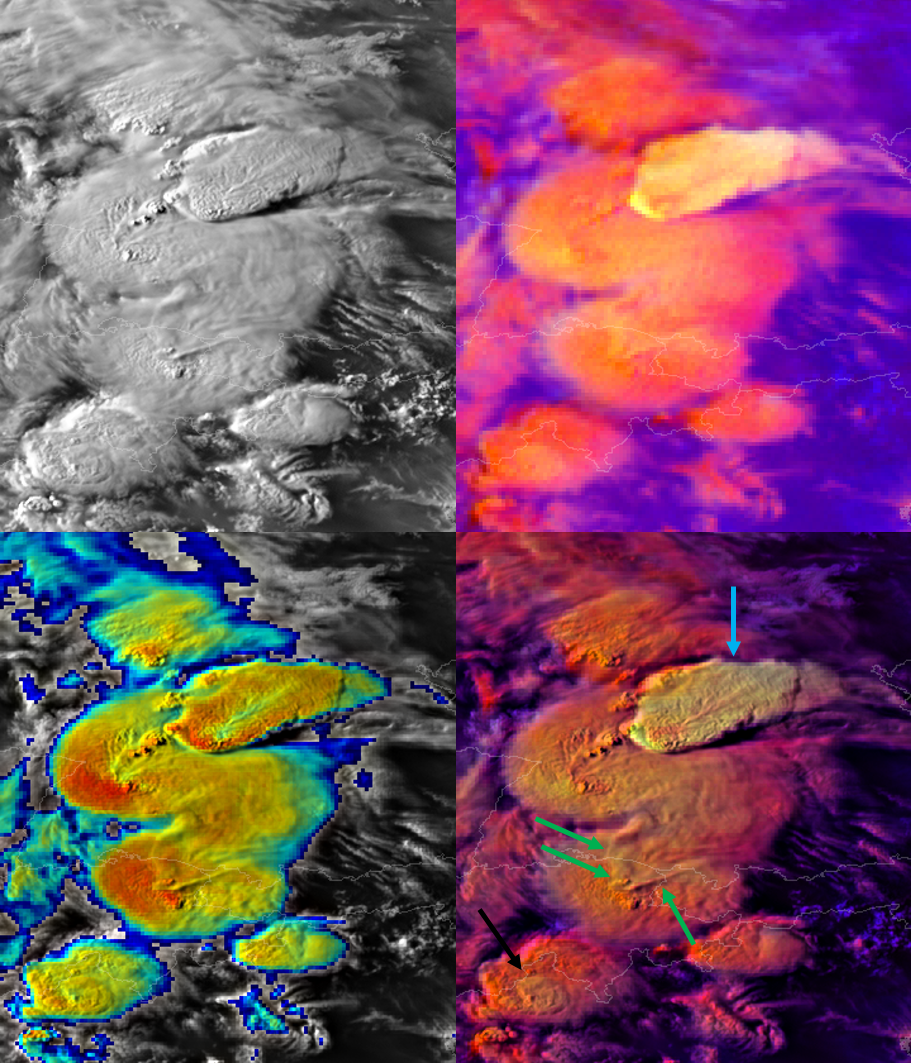
Figure 6.1: Meteosat SEVIRI HRV (upper left), Severe Storms RGB (upper right), HRV/IR10.8 blended image (bottom left) and HRV/Severe Storms RGB blended image (bottom right) of storms over Germany, taken on 12 July 2011 at 17:40 UTC. (Courtesy of Martin Setvák, CHMI)
In Fig. 6.1 the cell indicated by the blue arrow is likely the most intense one, as it is the most yellow in the image, although its temperature does not differ much from the temperature of the other big cells. So, its top has to be composed of very small ice crystals. The ice plume indicated by green arrows seems to consist of very small ice crystals (as it is more yellow than the anvil below, although it is warmer). All these features indicate that the updrafts are likely to be strong in these cells.
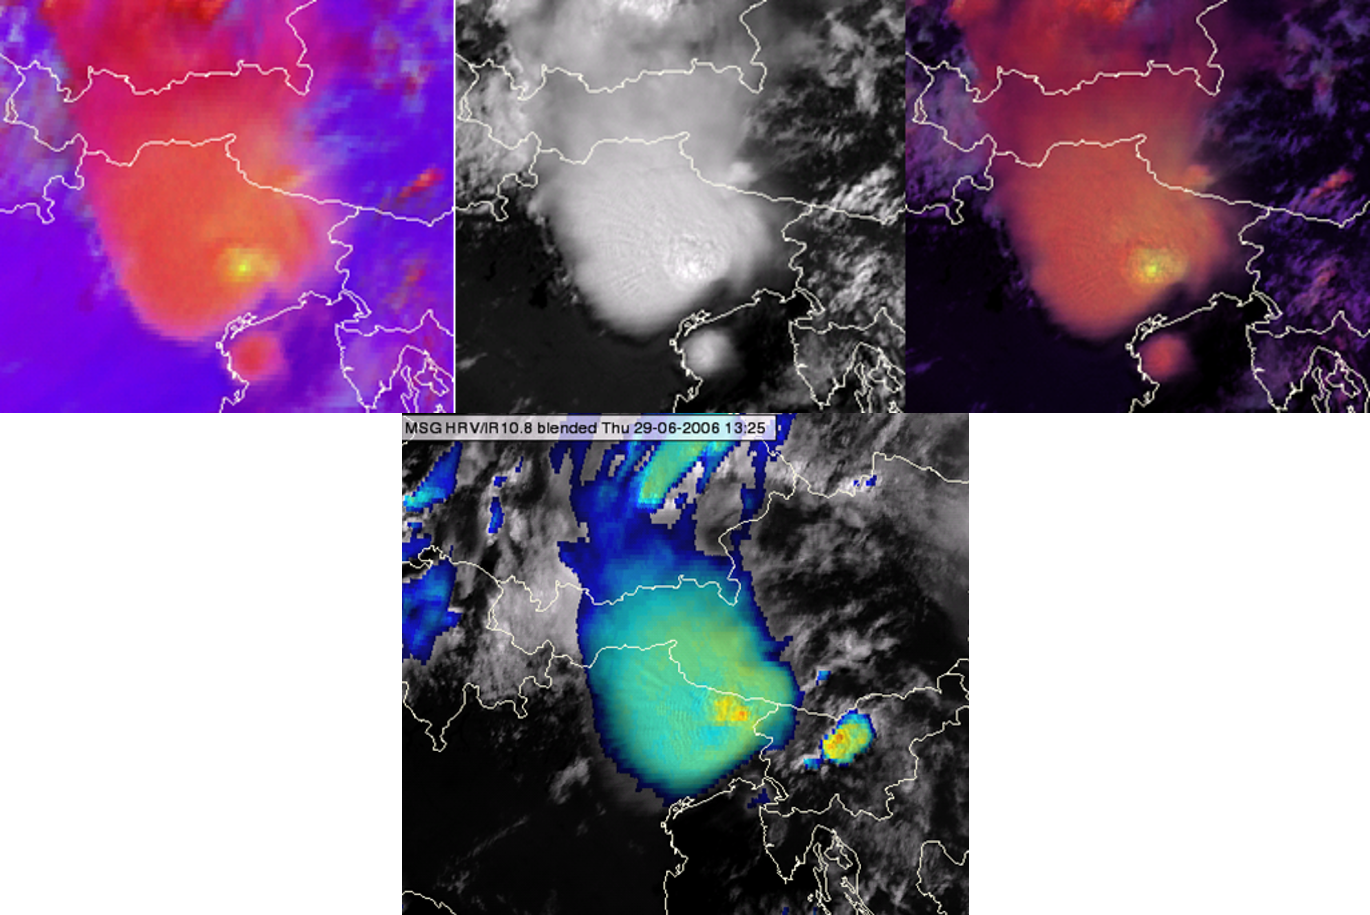
Figure 6.2a: Severe Storms RGB (upper left), HRV (upper middle), HRV/Severe Storms RGB blended image (upper right) and HRV/IR10.8 blended image (bottom), taken on 29 June 2006 at 12:25 UTC. (Processed at OMSZ with the ImageMagick script.)
In Fig. 6.2a the yellow colour of the overshooting top indicates strong updrafts (upper left and right panels). Strong updrafts often bring small ice particles up to the cloud top in mid-latitude continental convective storms. In the case of strong updrafts, the small water particles formed near the cloud base do not have enough time to grow larger by coagulation before freezing. Such small particles brought up by the updraft, spread over the anvil top afterwards.
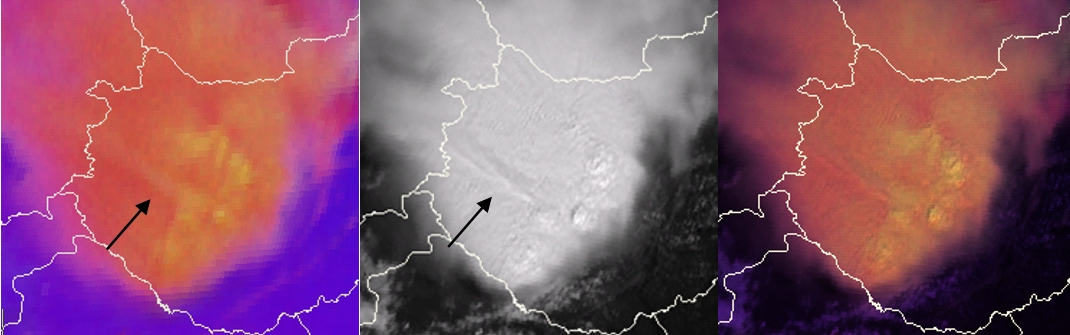
Figure 6.2b: Severe Storms RGB (left), HRV (middle), HRV/Severe Storms RGB blended image (right), taken on 29 June 2006 at 10:10 UTC over Hungary. (Processed at OMSZ with the ImageMagick script.)
In Fig. 6.2b not only the overshooting tops are yellow, some other parts of the anvil, as well as the ice plume is also slightly yellow. As the small ice crystals brought up by the updraft are spread along the anvil, a storm in its later stage can be covered by small ice crystals further from the updraft region as well. Note that small ice crystals may belong to an above anvil cirrus cloud, like Pileus or an ice plume. Above-anvil cirrus clouds, like plumes, typically consist of small particles. Long-lived ice plumes are also indicators of strong updrafts.
Summary
The sandwich image created from HRV and the Severe Storms RGB is also useful in convection monitoring. The Severe Storms RGB provides information on cloud top microphysics, and, for the mid-latitude continental storms, the presence of small ice crystals on (or above) the cloud top is indicator of possible storm severity.