Features in maps
LST maps allow identifying surface features such as mountains, cities and inland water bodies, as shown in Fig. 35. Some features are highlighted in this LST map from Europe on 15 August 2009 at 00 UTC; mountains are indicated with white circles, lakes/rivers in green and the city of Paris in red.
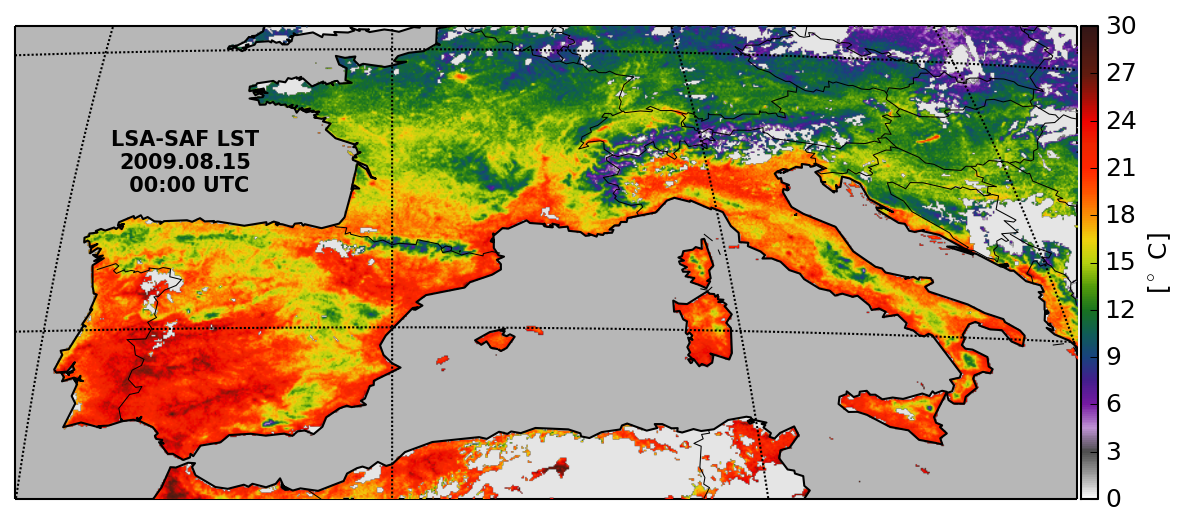
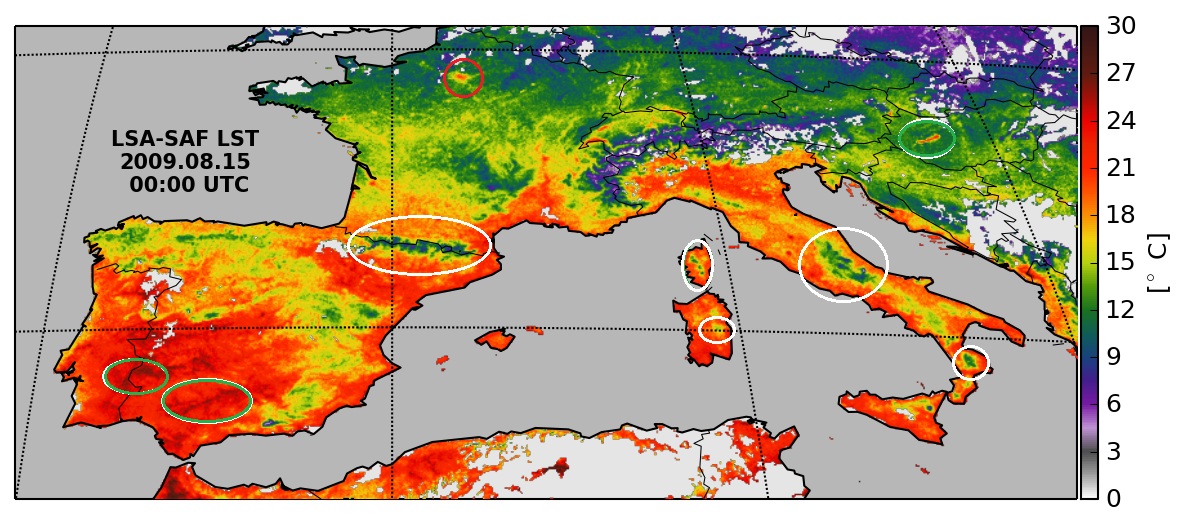
Fig. 35: LST map from Europe on 15 August 2009 at 00 UTC. Obtained from the LSA SAF.
The Nile Delta is clearly distinguishable in the maps of maximum LST (LSA SAF) 10 days composite for September 2014 (Figure 35). Also, there is a green area over the arid region of Negev desert (South of Berseba) (LST~47°C) in Israel, contrasting with the higher temperatures (~55°C) observed over the deserts of Egypt to the west. There is little rain in this area in July and August and so the desert should be dry everywhere. Yet, for the past several years, the Israeli government has invested much in transforming the northern Negev (the desert covers around 60% of the country's land area) into an agricultural land, partially irrigated. The maps of maximum LST in parts of Egypt and Israel from September 2014 are shown in Figure 35. During the first ten days the temperatures in southern Israel are moderate due to irrigation. After that rain starts to fall and the differences between Israel and Egypt diminish.
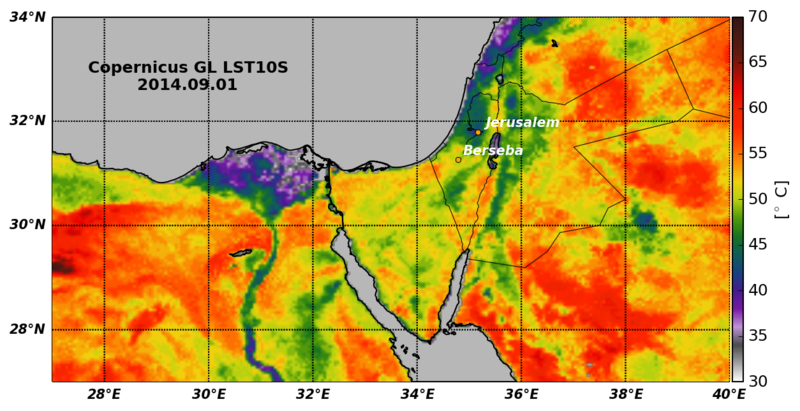
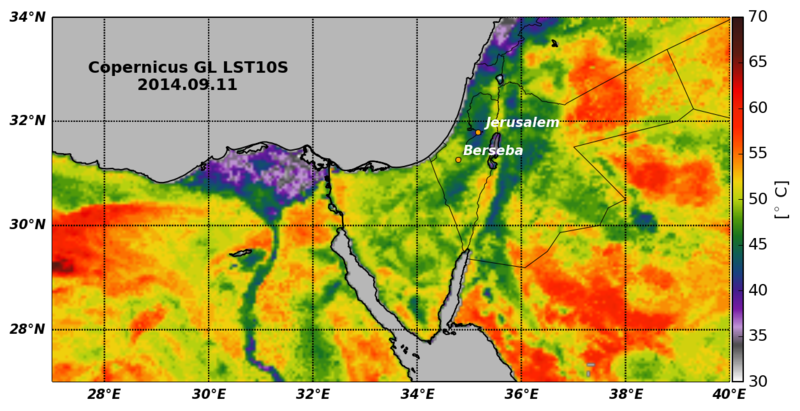
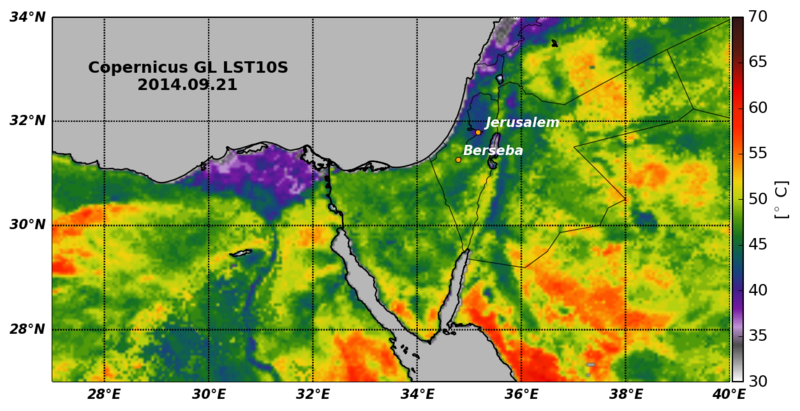
Fig. 36: Maximum LST 10 days composites for September 2014 (LST LSA SAF product) over Egypt and Israel.