Comma feature (Cold Air Development CAD)
Cloud systems in the initial weather situation
The typical synoptic situation can be summarized as:
- Comma/CAD crosses the Alpine region accompanied by a thickness ridge-trough system
- No frontal conditions
- CA dominates
- PVA accompanies Comma
- Wind directions change in front and behind the Comma (generally: W, NW , N)
- Main cloud features: Stau and Comma features
One typical example is the 07 February/00.00 to 12.00 UTC where a Comma forms over the North Sea, then increases dramatically as to a CAD and moves across the Alps (first case). For the complete sequence of satellite images during this phase see Overview - Phase 2 .
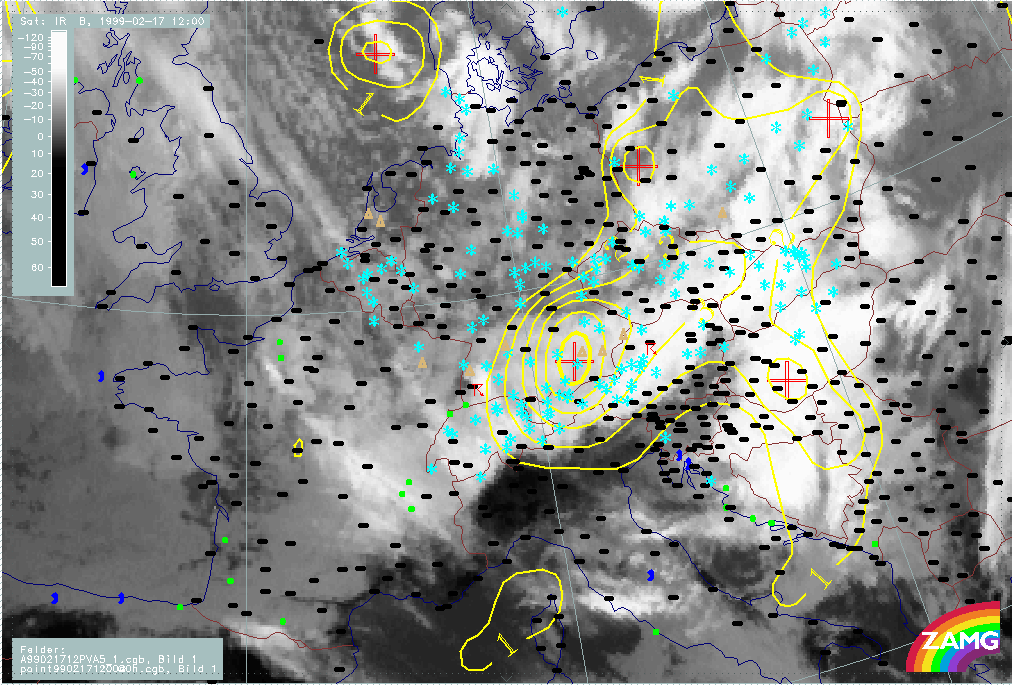
Another example is the 17 February/12.00 UTC, where a Comma covers the Alpine region with its tail (second case). For the complete sequence of satellite images during this phase see Overview - Phase 5 .
Comma (CAD) cloud band in the Alpine area
|
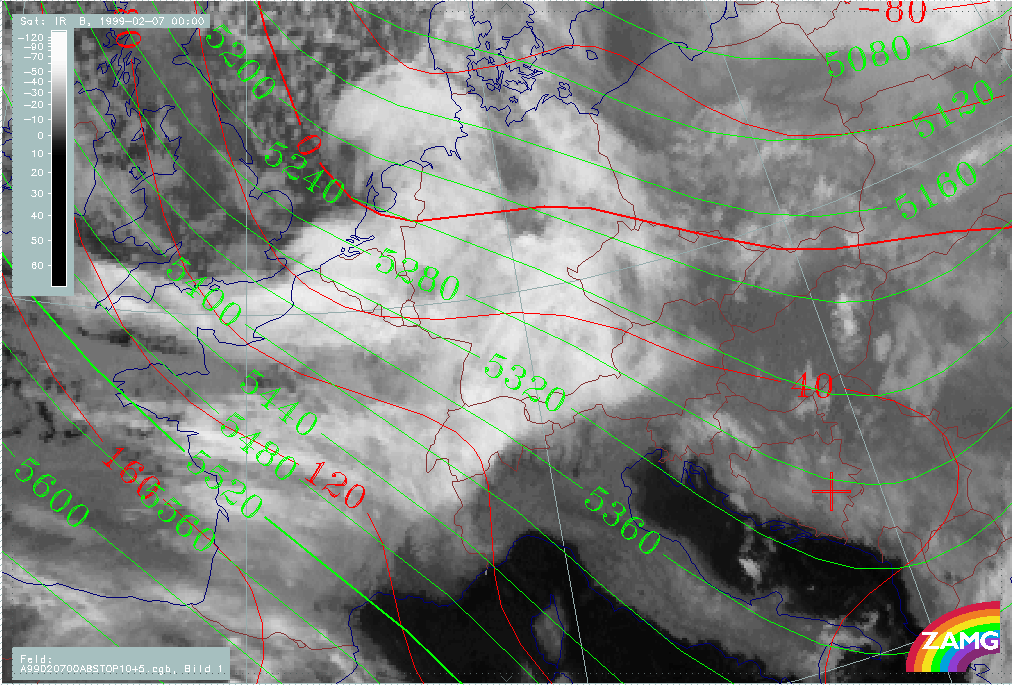
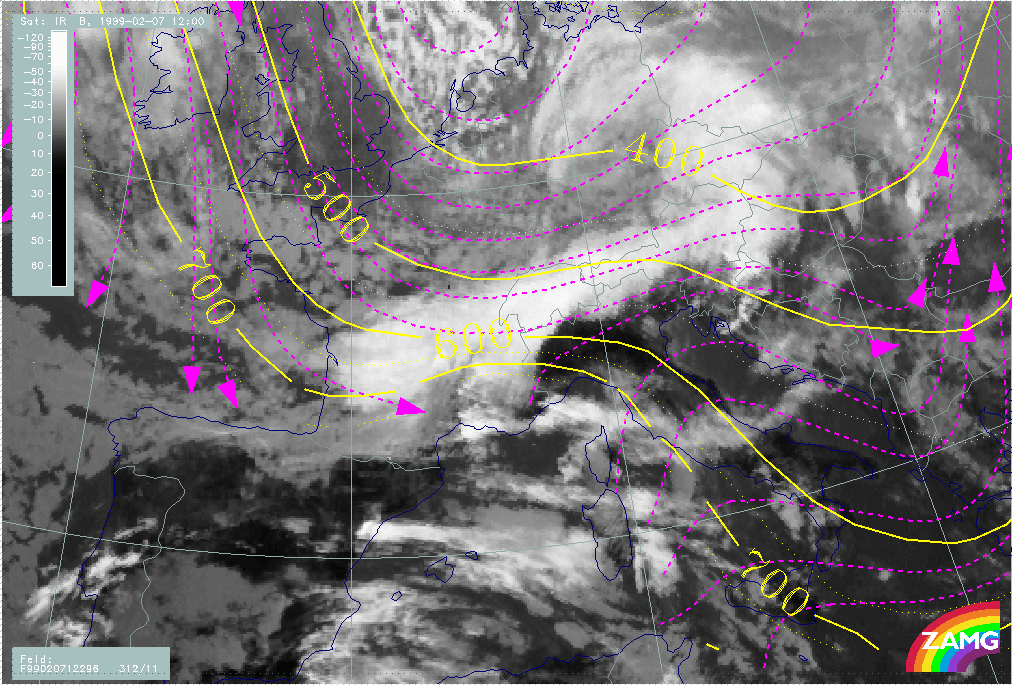
07 February 1999/00.00 UTC - Meteosat IR image; red: height contours 1000 hPa, green: height contours 500 hPa
|
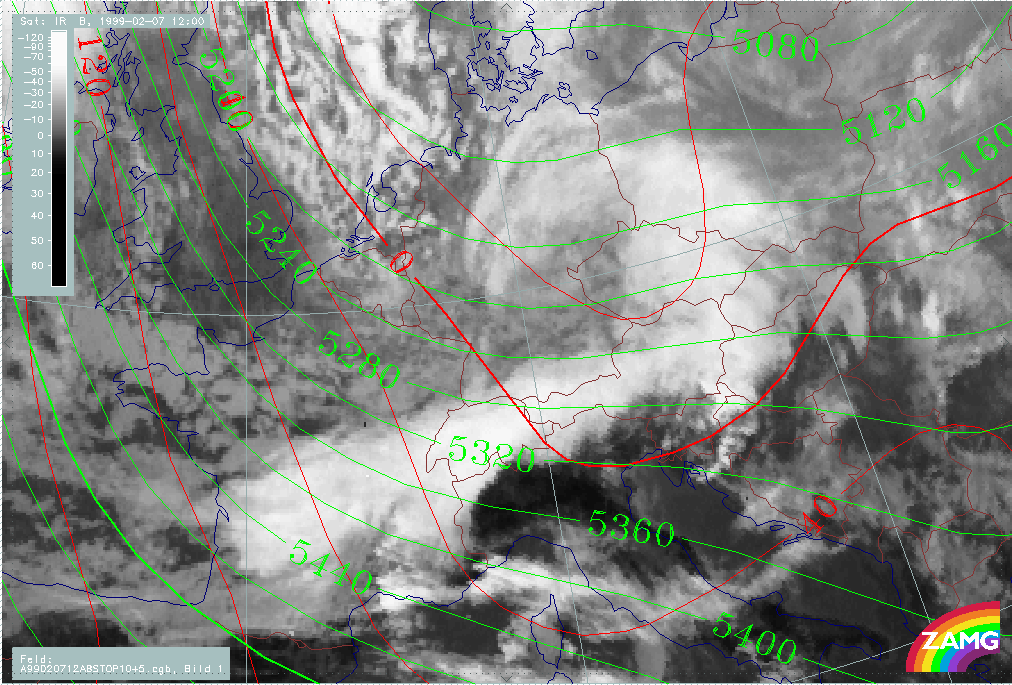
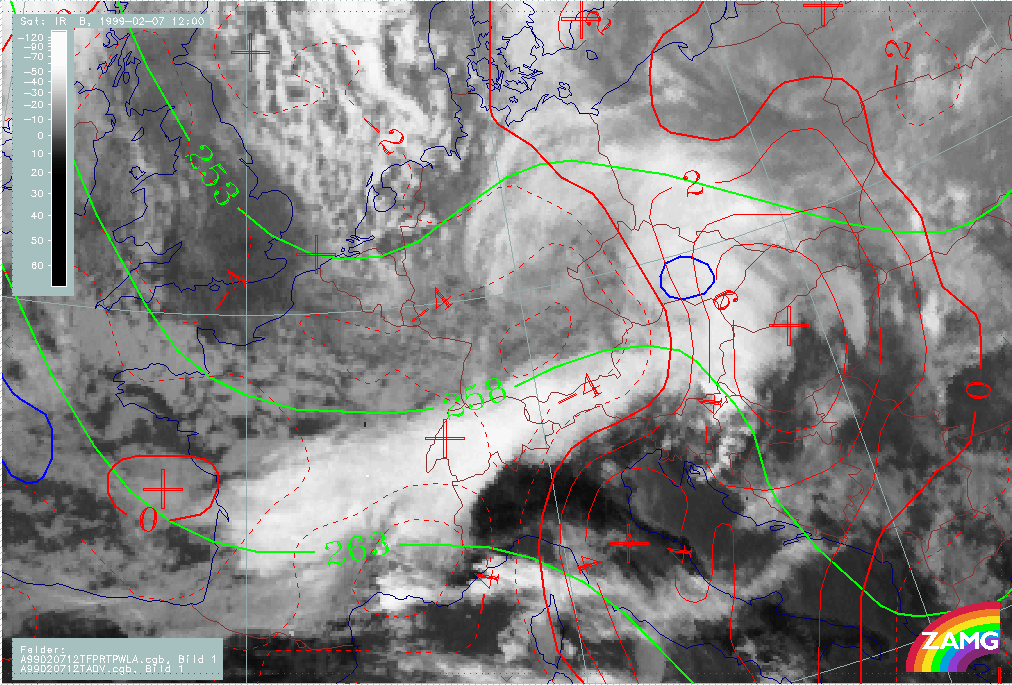
07 February 1999/12.00 UTC - Meteosat IR image; red: height contours 1000 hPa, green: height contours 500 hPa
|
|
|
|
|
|
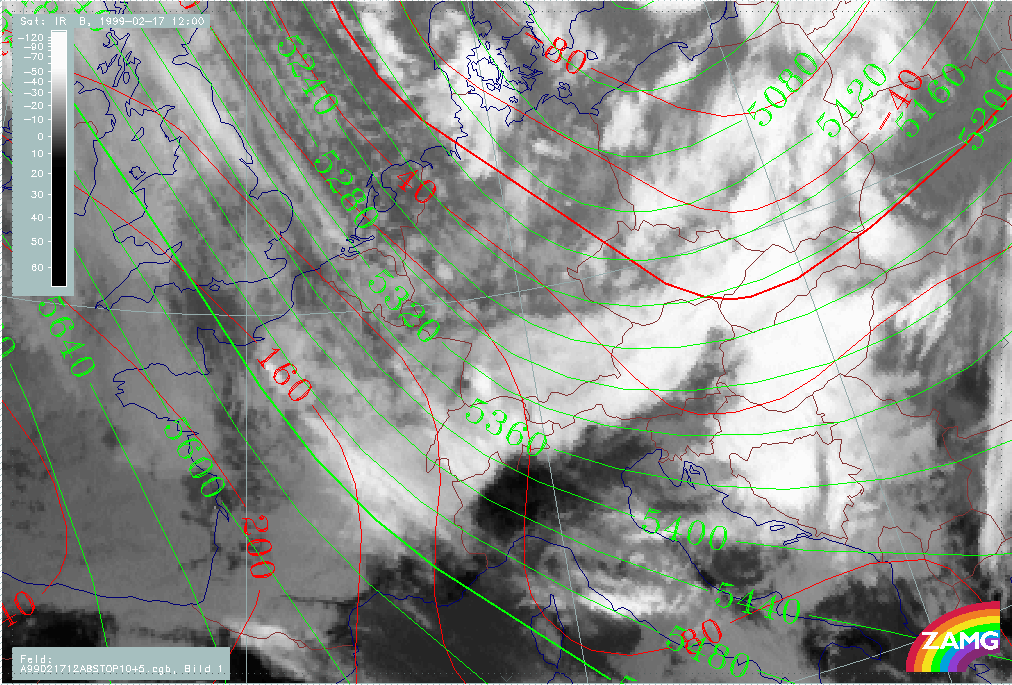
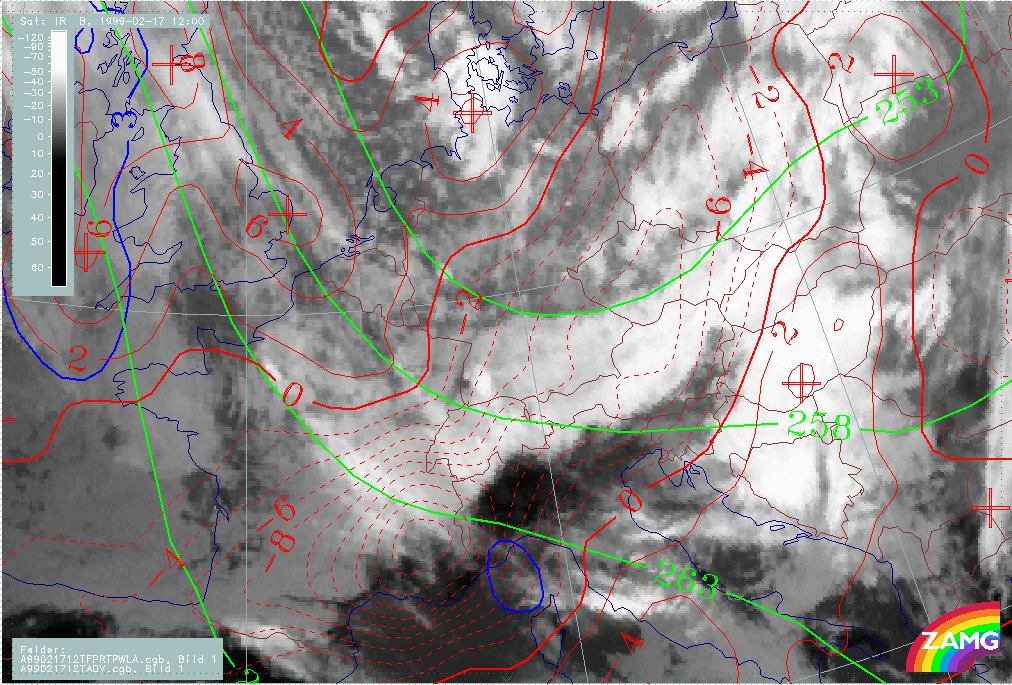
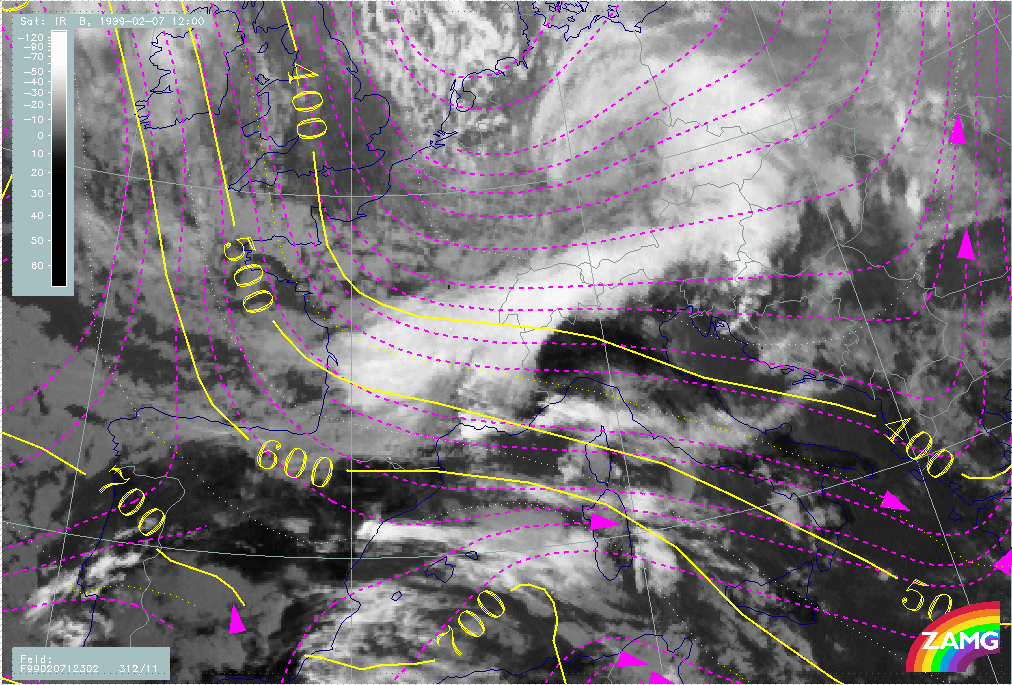
17 February 1999/12.00 UTC - Meteosat IR image; red: height contours 1000 hPa, green: height contours 500 hPa
|
|
The two examples of the first case show the cloud spiral of a Comma over the North Sea and the Netherlands, which develops quite remarkably during the next 12 hours when a marked Comma tail is situated over the Alpine region. In addition to the Comma cloud band, Stau Cloud can be observed, especially at the West Alps at 07/12.00 UTC. The main characteristic of the height fields is a surface trough associated with the Comma feature, especially the Comma head, and an upper level trough embedded in the NW stream to the rear of the Comma. Both features intensify significantly during the 12 hour period.
Very similar characteristics can also be derived for the second case. The Comma head area over Poland and the Czech Republic (which is not as distinct as usual) is accompanied by a distinct surface trough; an upper level trough exists behind the surface trough. The Comma tail over the Alpine mountains is superimposed upon Stau Cloud over Austria and forms a typical bow-like sharp cloud edge at the main mountain chain.
Consequently, in both cases the E. Alps and E. Austria is under the influence of a surface trough, while the Central and W. Alps are under the influence of an upper level trough changing to a NW upper level stream further west.
|
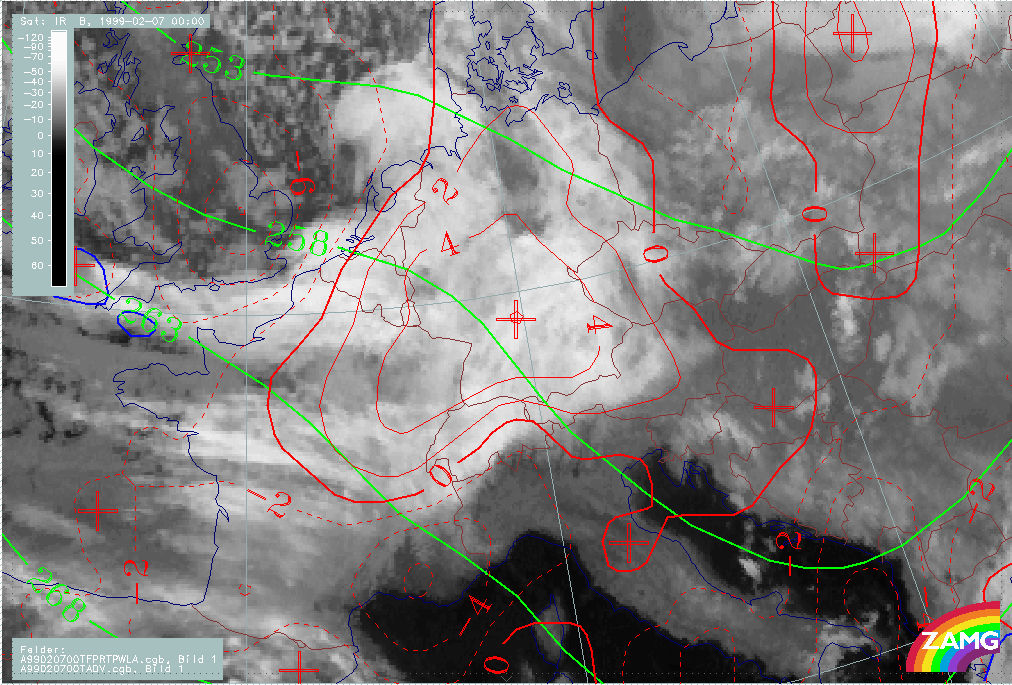
07 February 1999/00.00 UTC - Meteosat IR image; green: equivalent thickness 500/1000 hPa, red solid: temperature advection - WA 700 hPa, red dashed: temperature advection - CA 700 hPa,
blue: Thermal Front Parameter (TFP)
|
07 February 1999/12.00 UTC - Meteosat IR image; green: equivalent thickness 500/1000 hPa, red solid: temperature advection - WA 700 hPa, red dashed: temperature advection - CA 700 hPa,
blue: Thermal Front Parameter (TFP)
|
|
|
|
|
|
17 February 1999/12.00 UTC - Meteosat IR image; green: equivalent thickness 500/1000 hPa, red solid: temperature advection - WA 700 hPa, red dashed: temperature advection - CA 700 hPa,
blue: Thermal Front Parameter (TFP)
|
|
Thickness, temperature advection and TFP show similar characteristics in both examples. There are thickness ridge - trough systems in the areas of the Comma head - tail and, respectively, the transition from WA to CA close to the thickness ridge line. Therefore, the Comma head cloud area lies within a thickness ridge and is under the influence of WA, the comma tail cloud band lies at the leading edge of a thickness trough and is under the influence of CA. Consequently, this is a synoptic situation/development where most of the Alpine region is under CA. There are no frontal characteristics defined by a TFP.
|
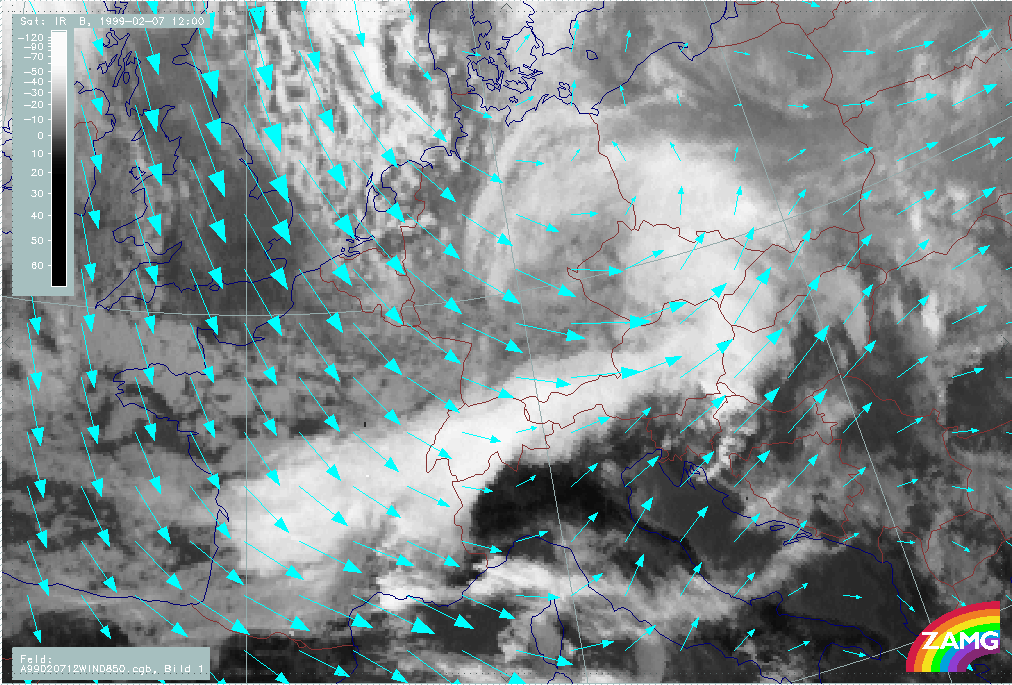
07 February 1999/12.00 UTC - Meteosat IR image; cyan: wind vectors 850 hPa
|
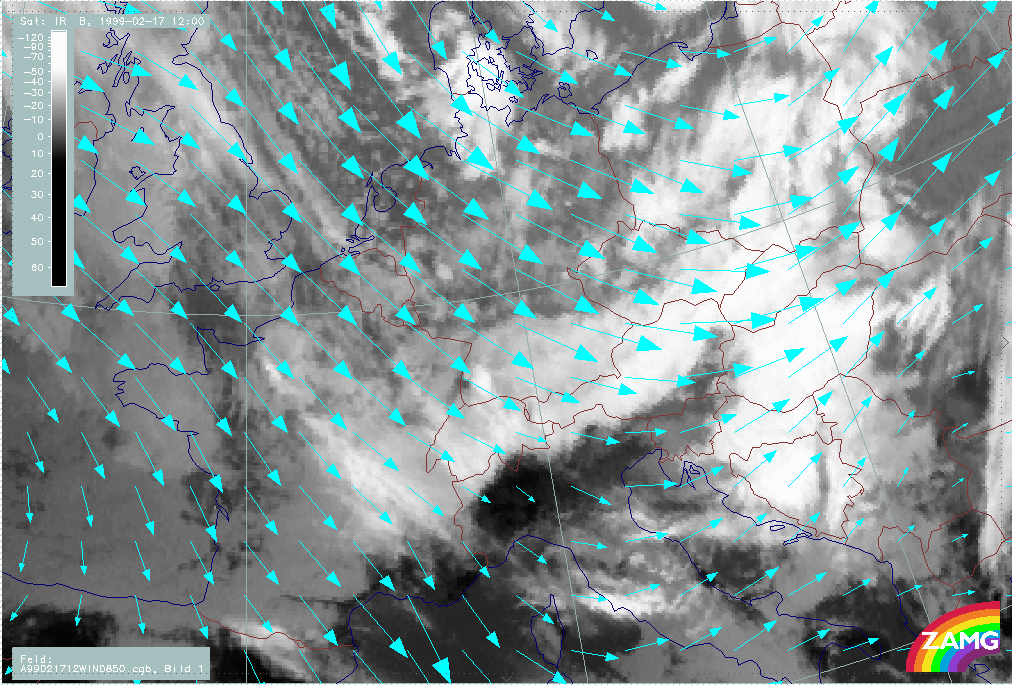
17 February 1999/12.00 UTC - Meteosat IR image; cyan: wind vectors 850 hPa
|
|
|
|
|
|
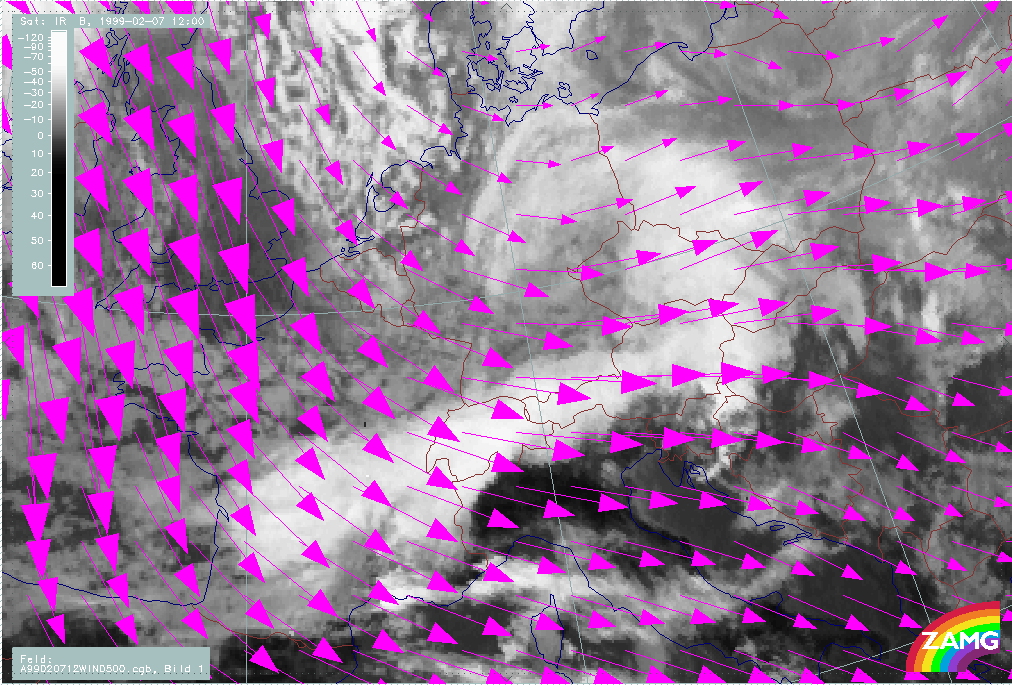
07 February 1999/12.00 UTC - Meteosat IR image; magenta: wind vectors 500 hPa
|
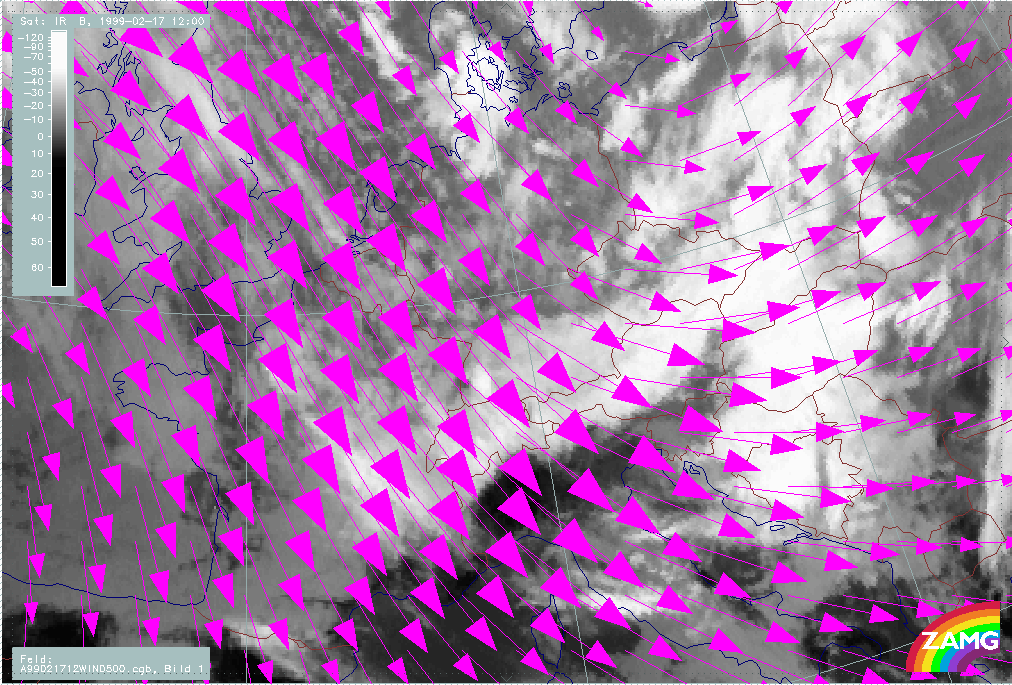
17 February 1999/12.00 UTC - Meteosat IR image; magenta: wind vectors 500 hPa
|
The wind vectors at 850 and 500 hPa show similarities as well as differences between the two cases. In the first case (07/12.00 UTC), western directions prevail in both levels over the Central and E. Alps, north-western directions can be observed over the W. Alps (Switzerland). Consequently, Stau Clouds form only over the W. Alps, whilst there are no remarkable Stau Clouds over Austria. In the second case (17/12.00 UTC), north-western directions already exist over the E. Alps in Austria at both levels, leading to the development of Stau Clouds also over E. Austria. The difference is only a consequence of the relationship between Comma configuration and the Alpine region.
|
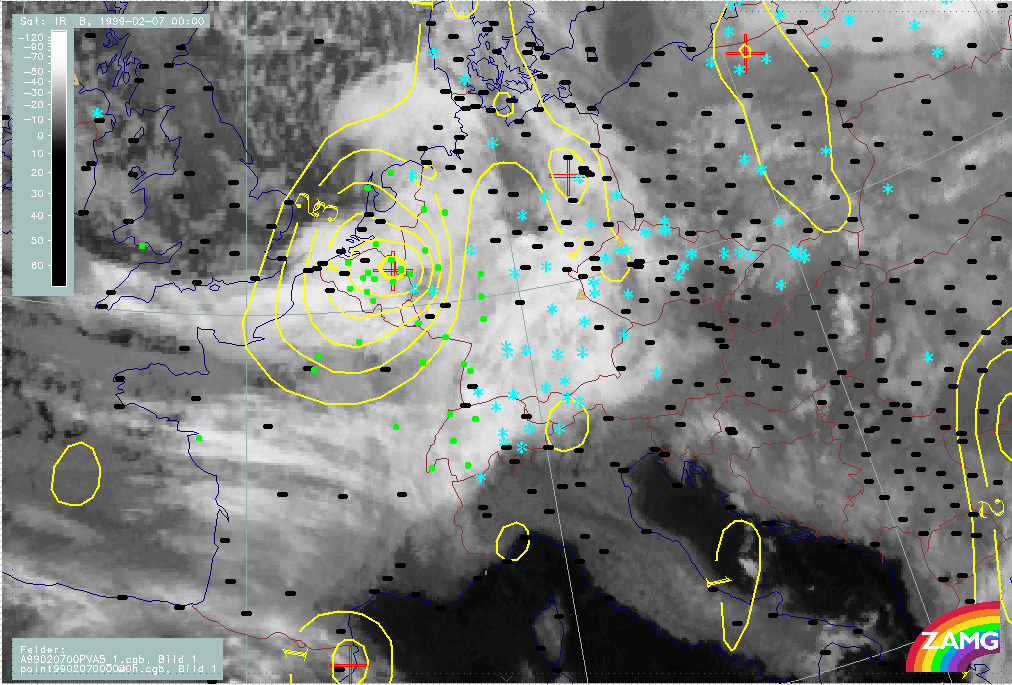
07 February 1999/00.00 UTC - Meteosat IR image; yellow: positive vorticity advection (PVA) 500 hPa; weather events (green: rain and showers, blue: drizzle, cyan: snow, red: thunderstorm
with precipitation, purple: freezing rain, orange: hail, black: no actual precipitation or thunderstorm with precipitation)
|
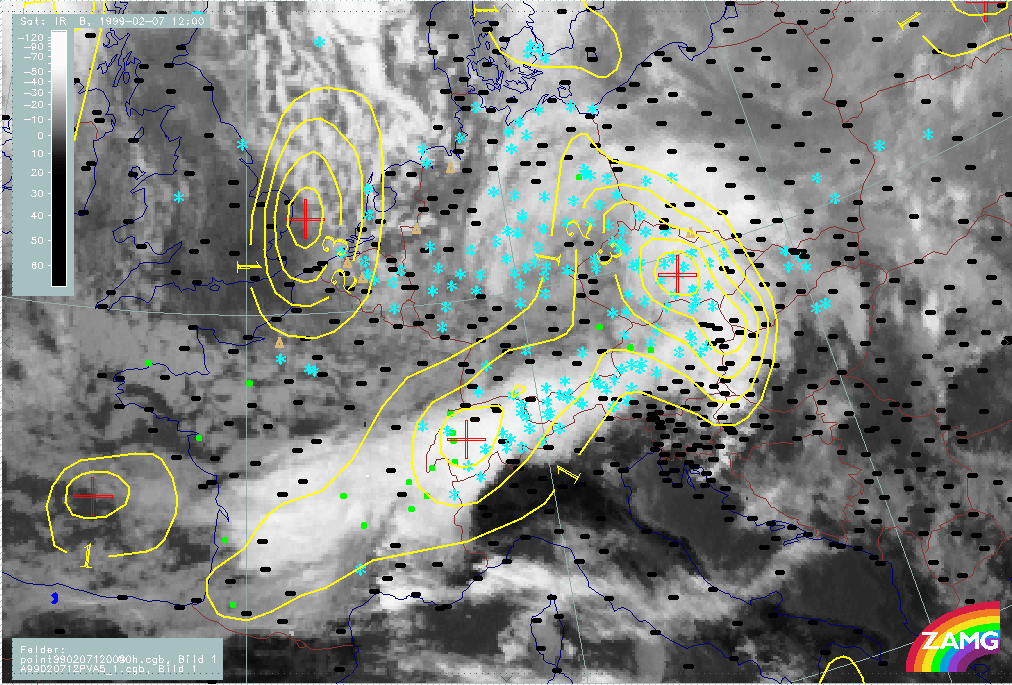
07 February 1999/12.00 UTC - Meteosat IR image; yellow: positive vorticity advection (PVA) 500 hPa; weather events (green: rain and showers, blue: drizzle, cyan: snow, red: thunderstorm
with precipitation, purple: freezing rain, orange: hail, black: no actual precipitation or thunderstorm with precipitation)
|
|
|
|
|
|
17 February 1999/12.00 UTC - Meteosat IR image; yellow: positive vorticity advection (PVA) 500 hPa; weather events (green: rain and showers, blue: drizzle, cyan: snow, red: thunderstorm
with precipitation, purple: freezing rain, orange: hail, black: no actual precipitation or thunderstorm with precipitation)
|
|
Comma (CAD) cloud pass over the Alpine region - "jump" of frontal cloud band
During the detailed discussion of Phase 2 (See Overview - Phase 2 ), the movement of the Comma system across the Alps was shown to take place between 07/12.00 and 18.00 UTC. The development and increase of a cloud band south of the Alps was detected together with the decrease of cloudiness within the Alpine region. There was the suspicion of an upper level front crossing the Alps much faster and leading to cloud development to the south. Such a situation can be discussed in more detail with the help of vertical cross sections. However, it has to be recalled that neither the numerical model nor the algorithm for the analysis of vertical cross section contain the orography of the Alps in a satisfactory manner. Nevertheless, some interesting results can be derived.
|
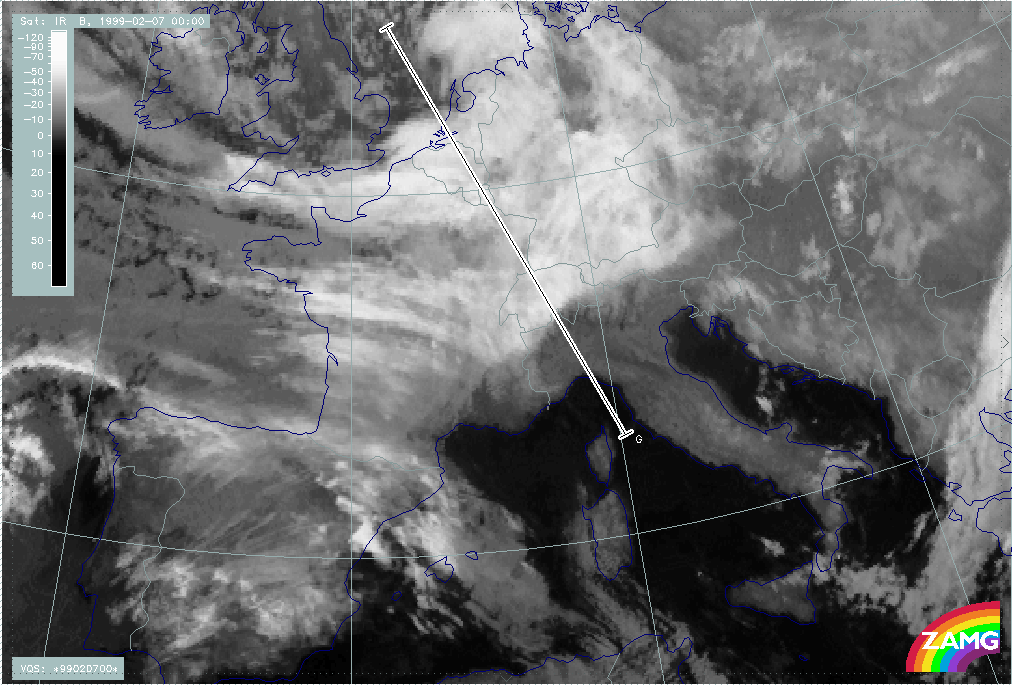
07 February 1999/00.00 UTC - Meteosat IR image; position of vertical cross section G indicated
|
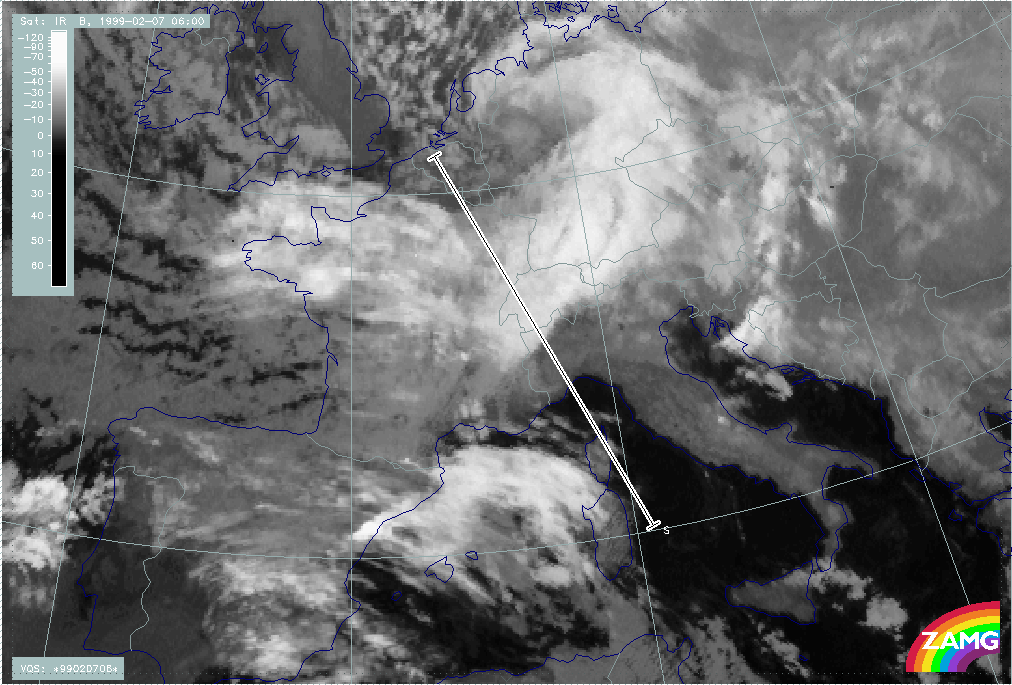
07 February 1999/06.00 UTC - Meteosat IR image; position of vertical cross section S indicated
|
|
|
|
|
|
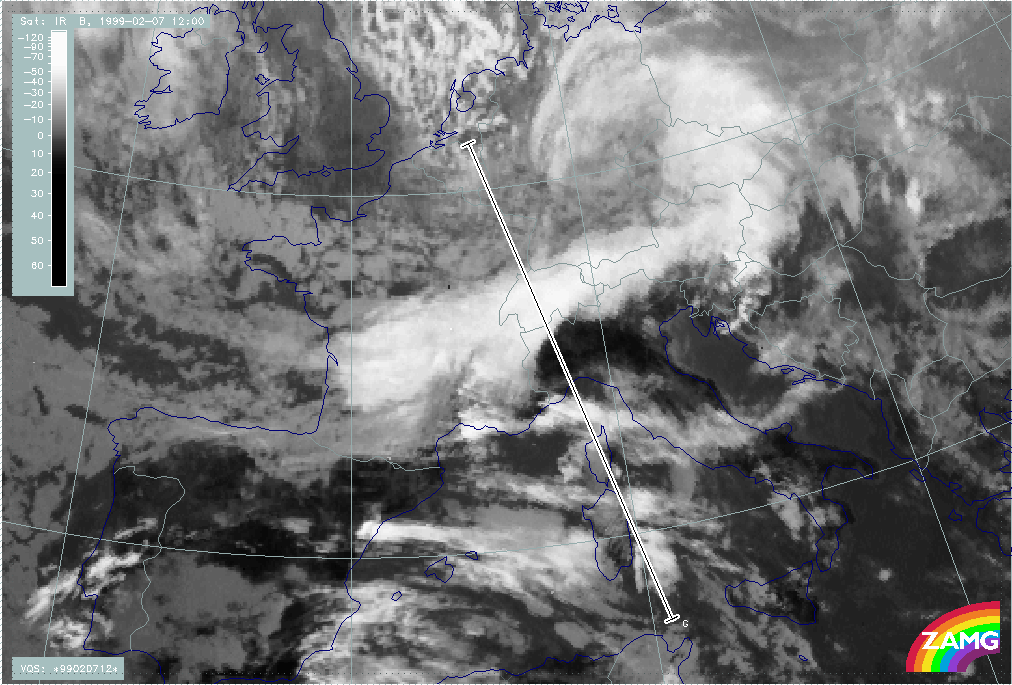
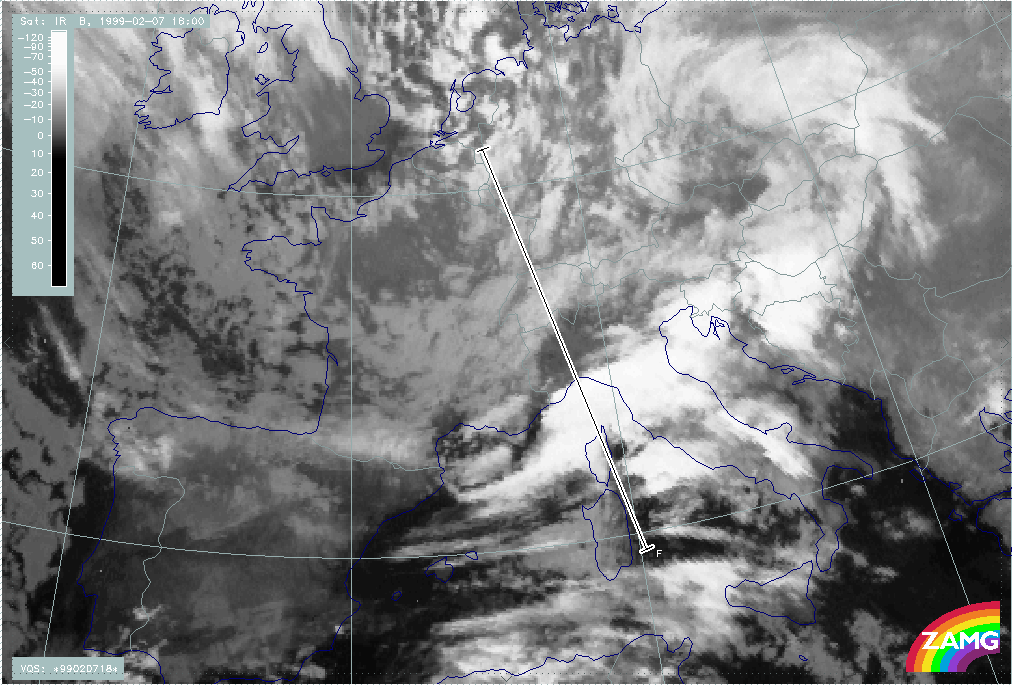
07 February 1999/12.00 UTC - Meteosat IR image; position of vertical cross section F indicated
|
07 February 1999/18.00 UTC - Meteosat IR image; position of vertical cross section G indicated
|
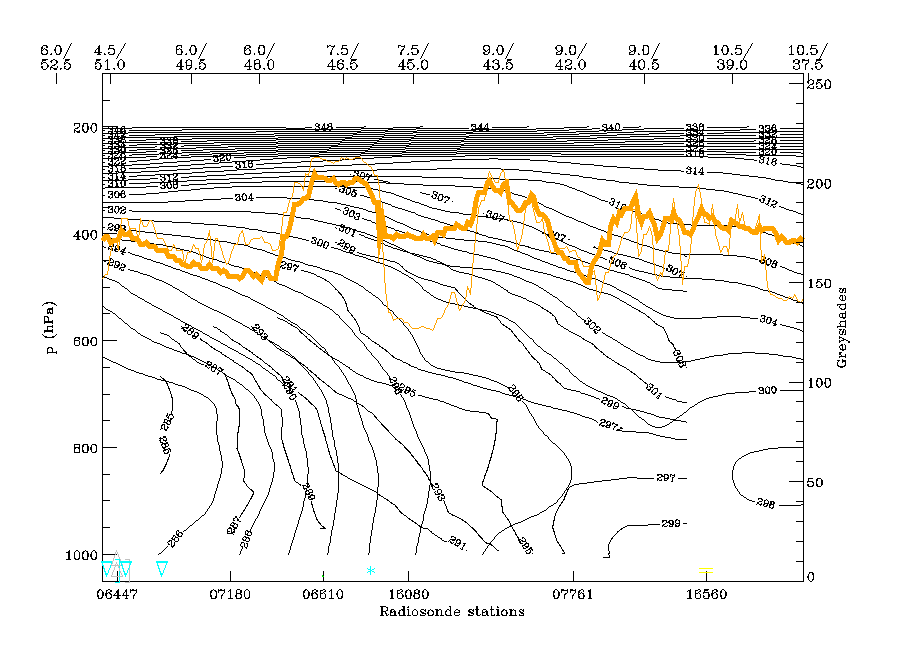
Isentropes and temperature advection is analysed at 6 hourly intervals, in the vertical cross sections from 07/00.00 to 18.00 UTC. The vertical cross section lines are from NW to SE and are perpendicular to the increased Comma tail and the Alpine mountain chain in Switzerland. Although there are slight variations in the lines they start in NW Europe (North Sea, Netherlands, Belgium) and end in the Mediterranean (Corsica, Sardinia). At 07/12.00 UTC, the fibrous cloud areas to the lee of the French W. Alps and the mountains in Sardinia are shown in the cross section. This is the area where frontal cloudiness develops south of the Alps and intensifies till 18.00 UTC.
|
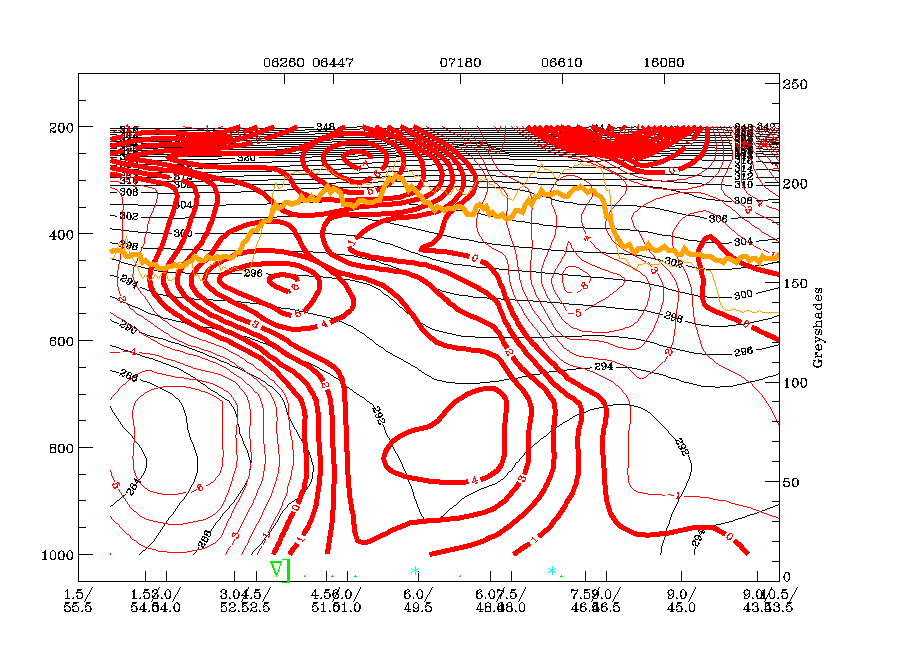
07 February 1999/00.00 UTC - Vertical cross section; black: isentropes (ThetaE), red thin: temperature advection - CA, red thick: temperature advection - WA, orange thin: IR pixel
values, orange thick: WV pixel values
|
07 February 1999/06.00 UTC - Vertical cross section; black: isentropes (ThetaE), red thin: temperature advection - CA, red thick: temperature advection - WA, orange thin: IR pixel
values, orange thick: WV pixel values
|
|
|
|
|
|
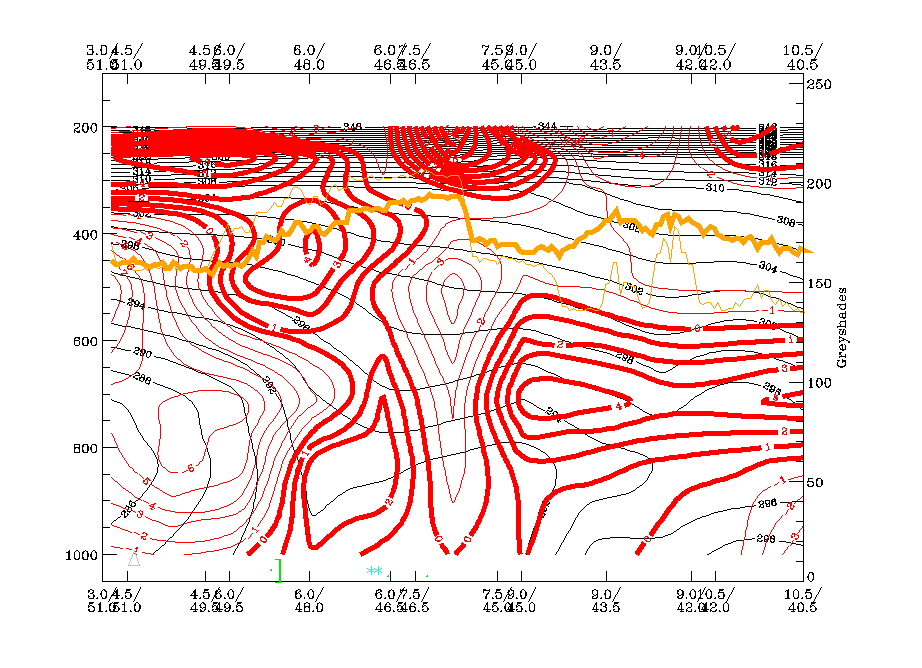
07 February 1999/12.00 UTC - Vertical cross section; black: isentropes (ThetaE), red thin: temperature advection - CA, red thick: temperature advection - WA, orange thin: IR pixel
values, orange thick: WV pixel values
|
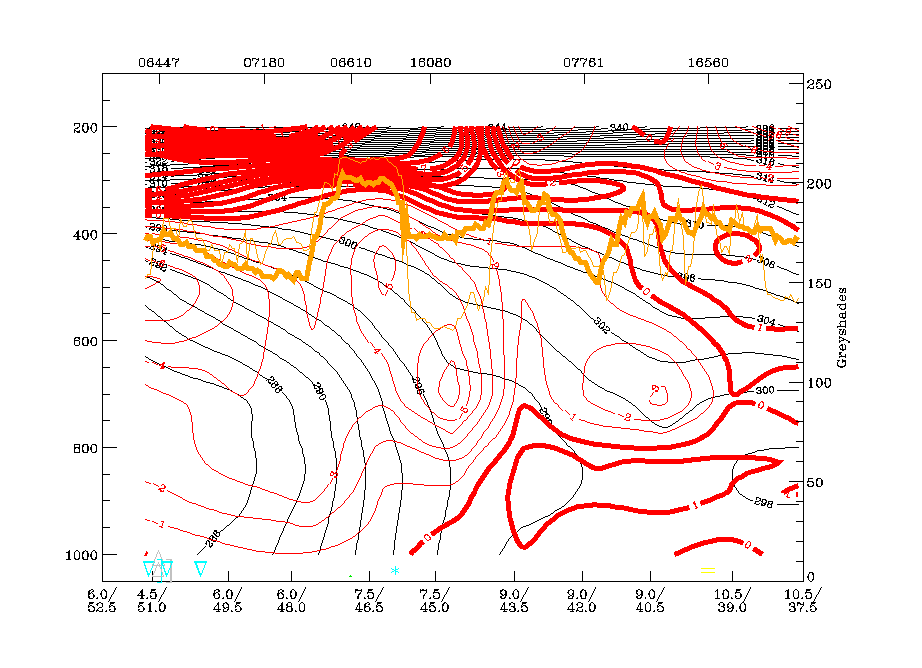
07 February 1999/18.00 UTC - Vertical cross section; black: isentropes (ThetaE), red thin: temperature advection - CA, red thick: temperature advection - WA, orange thin: IR pixel
values, orange thick: WV pixel values
|
|
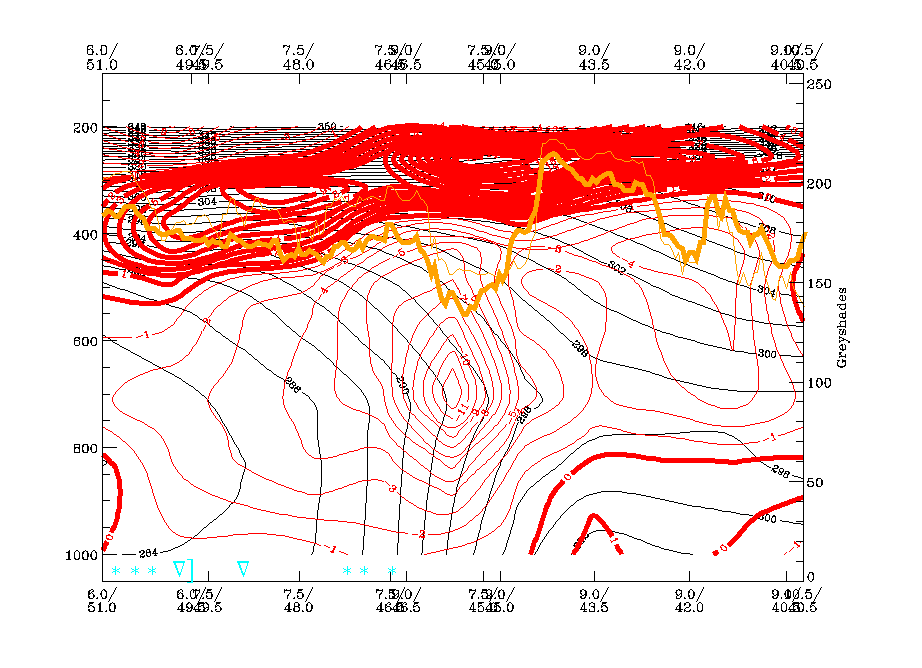
07 February 1999/12.00 UTC - Vertical cross section; black: isentropes (ThetaE) from ECMWF, black: isentropes (ThetaE) from radiosonde measurements, orange thin: IR pixel values, orange
thick: WV pixel values
|
|
|
In the initial stage at 07/00.00 UTC, there is a broad area of high IR and WV pixels between approximately 52N/05W and 46N/08E. It comprises both, Comma tail cloudiness and fibrous warm air cloudiness north of as well as over the Alps. The most important feature in the isentropes is the downward inclined frontal-like boundary below 600 hPa at the north-western boundary of the cross section. This is quite typical for a comma; there is CA below. The broad zone of WA in front hardly accompanies a Warm Front but represents WA cloudiness.
6 hours later the frontal-like boundary can still be observed reaching the surface at about 49N/05E which is still north of the Alps; but the most important new features are the development of an upper level zone inclined downward between 450 and 700 hPa at 46N/06E. This is immediately at the northern boundary of the W. Alps over Switzerland. On top of this frontal zone WA dominates but there is a bulge of CA around 700 hPa at about 48N/06E. This is a first indication for the development of an upper level zone which is in the middle troposphere at and above the tops of the Alps as well as clearly south of the Comma tail feature.
At 12.00 UTC, this feature is even more distinct and the geographical changes between 07/06.00 and 12.00 UTC are quite rapid. The downward inclined frontal zone accompanying the Comma tail is immediately north of the Alps (radiosonde station Payerne 06610) and the upper level zone is inclined downward between 300 and 600 (700) hPa south of the Alps (radiosonde stations Milan 16080 and Ajacco 07761). This is exactly the area where the high cloud fibres form to the lee of the relevant mountains. There is now a separate maximum of CA within this frontal surface which is south of the Alps and in front of the main CA maximum associated with the CAD north of the Alps. This supports the idea of an upper level frontal zone rapidly crossing the Alps. It can be observed very frequently that cloudiness develops at these heights where upward motion is produced by different physical processes (e.g. upper level front, convergence and lee waves). The idea of an upper level front is even supported by radiosonde measurements from which two frontal zones are detected: one to the north of the Alps, reaching down to the surface, and one to the south of the Alps at upper levels.
6 hours later at 07/18.00 UTC both frontal features can be still recognised. The main frontal zone now also reaches the surface south of the Alps and is much closer to the upper level frontal zone. Associated cloudiness has intensified.
|
07 February 1999/12.00 UTC - Meteosat IR image; magenta: relative streams 296K - system velocity 312° 11m/s; yellow: isobars
|
07 February 1999/12.00 UTC - Meteosat IR image; magenta: relative streams 302K - system velocity 312° 11m/s; yellow: isobars
|
|
|
The first signs of cloud development, at the upper level frontal zone south of the Alps appear at 07/12.00 UTC. Relative streams for this point in time show a Warm Conveyor Belt and an upper relative stream, a configuration typical of a frontal situation. But the limiting stream line between both relative streams lies on a low isentropic surface (296K) in the Alpine region and on a high isentropic surface (302K) far more to the south over Sardinia.