Overview
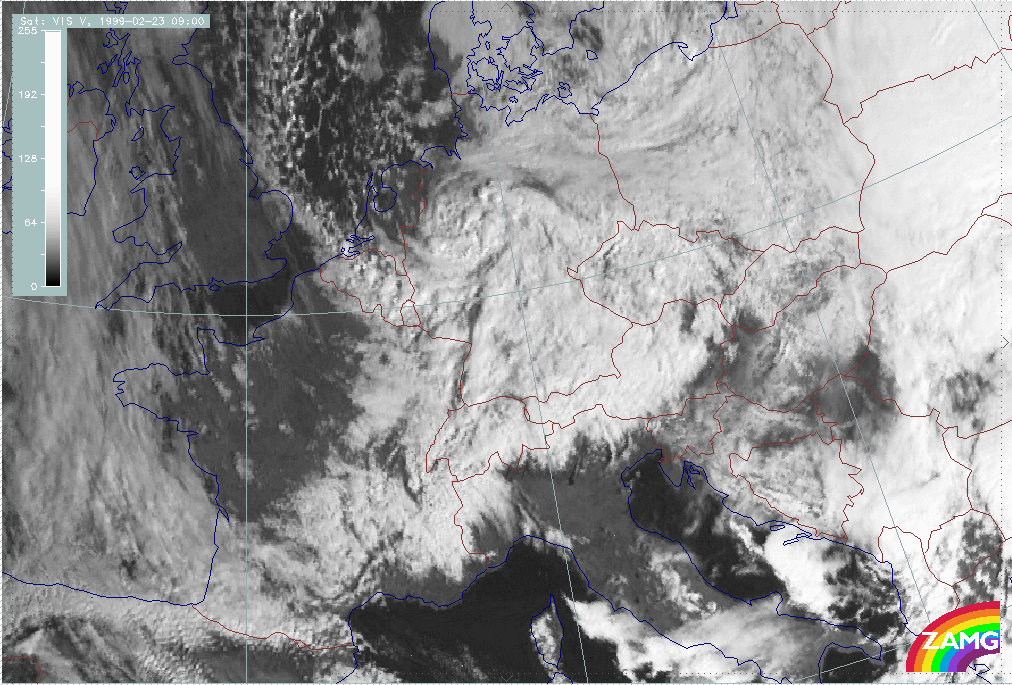
Phase 1: 05 February/06.00 - 06 February/12.00 UTC
This phase is characterised by:
- A thickness gradient forming a trough feature exactly over the Alpine area
- Non frontal conditions
- CA dominates
- PVA plays an additional role
- Stau cloud features
- Wind components at 850 hPa are mainly from NW
- Wind components at 500 hPa are mainly from NW
|
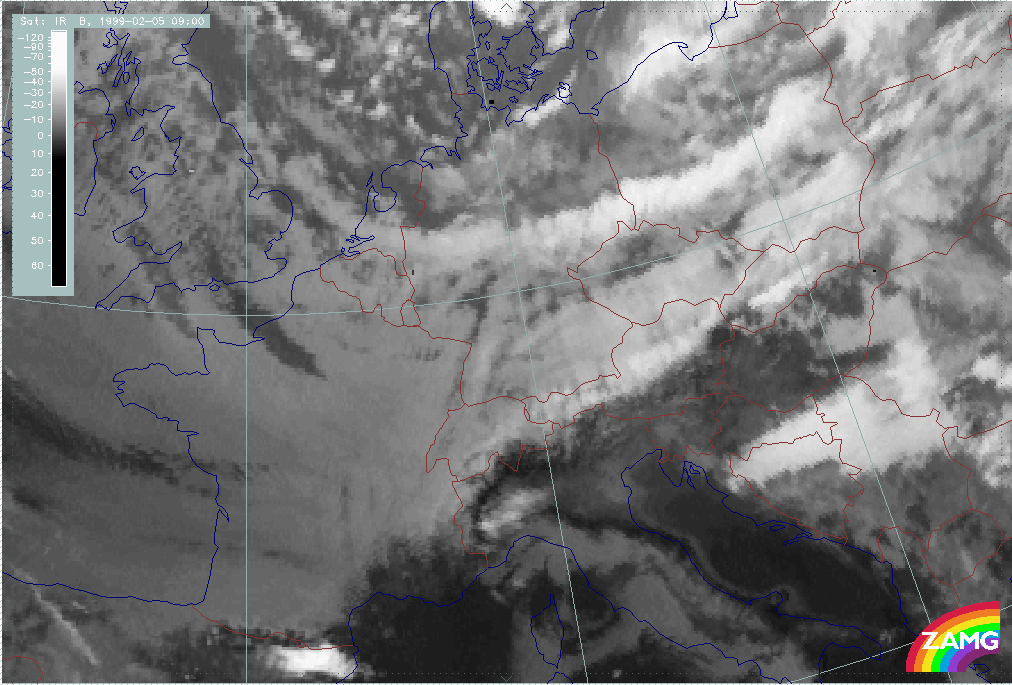
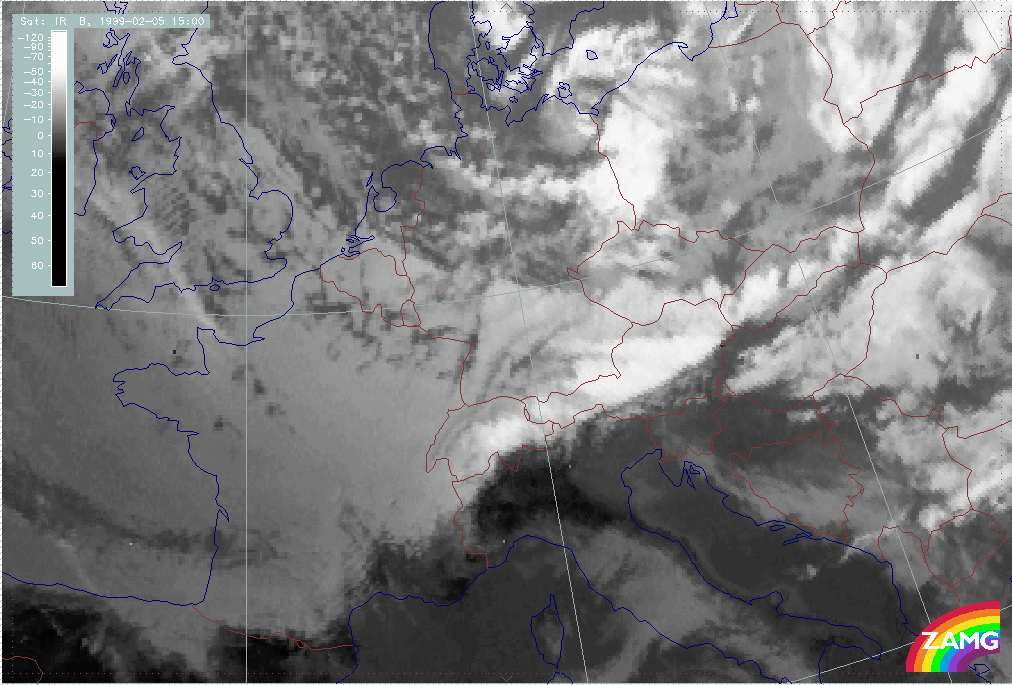
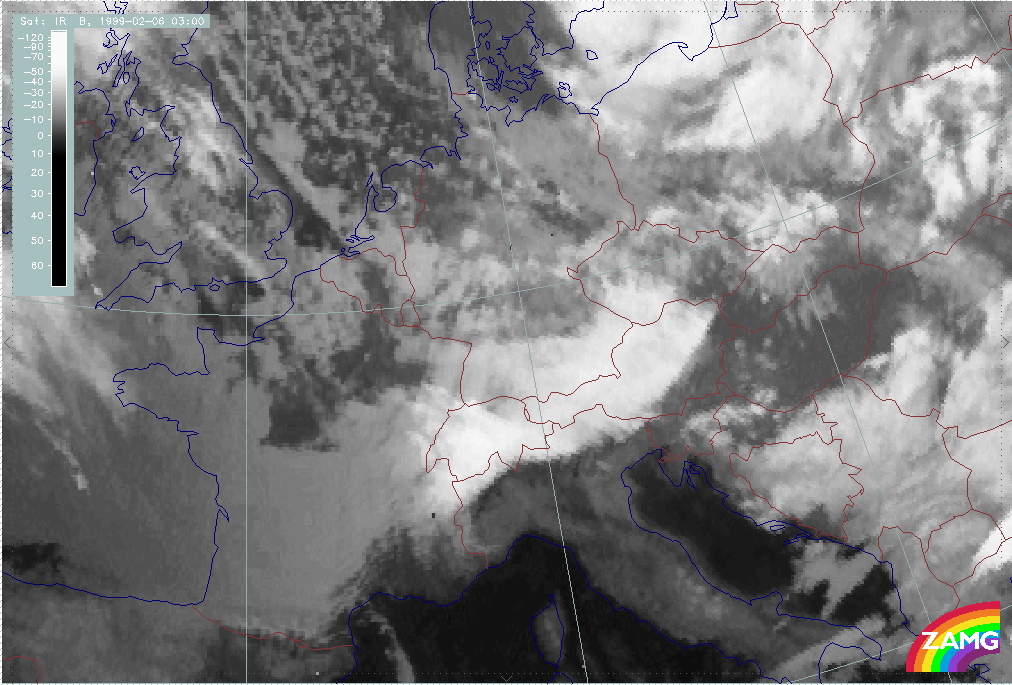
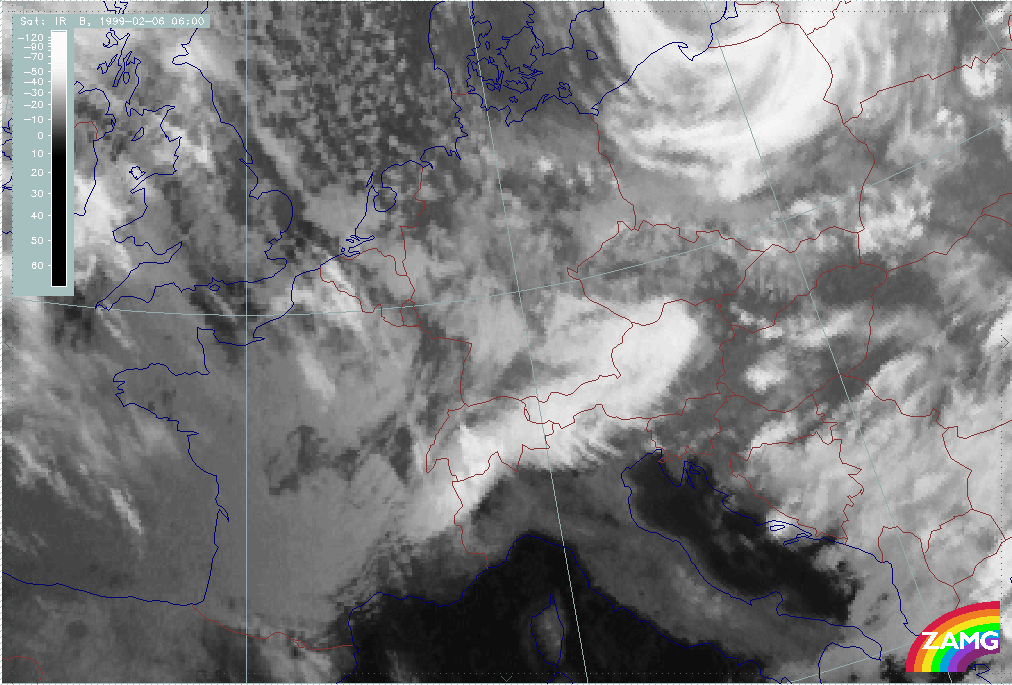
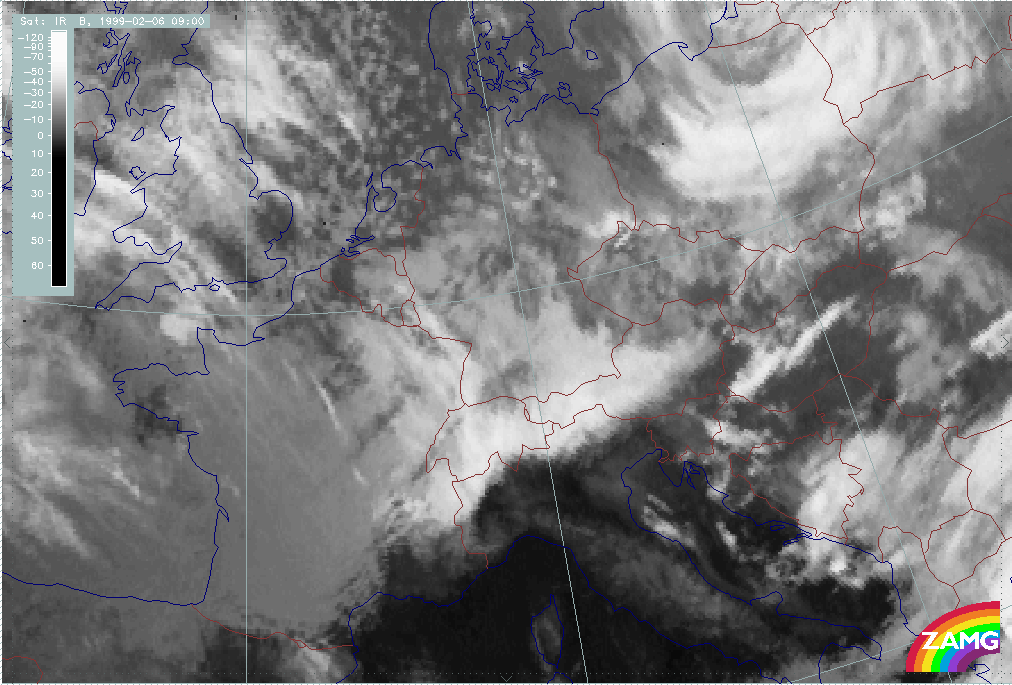
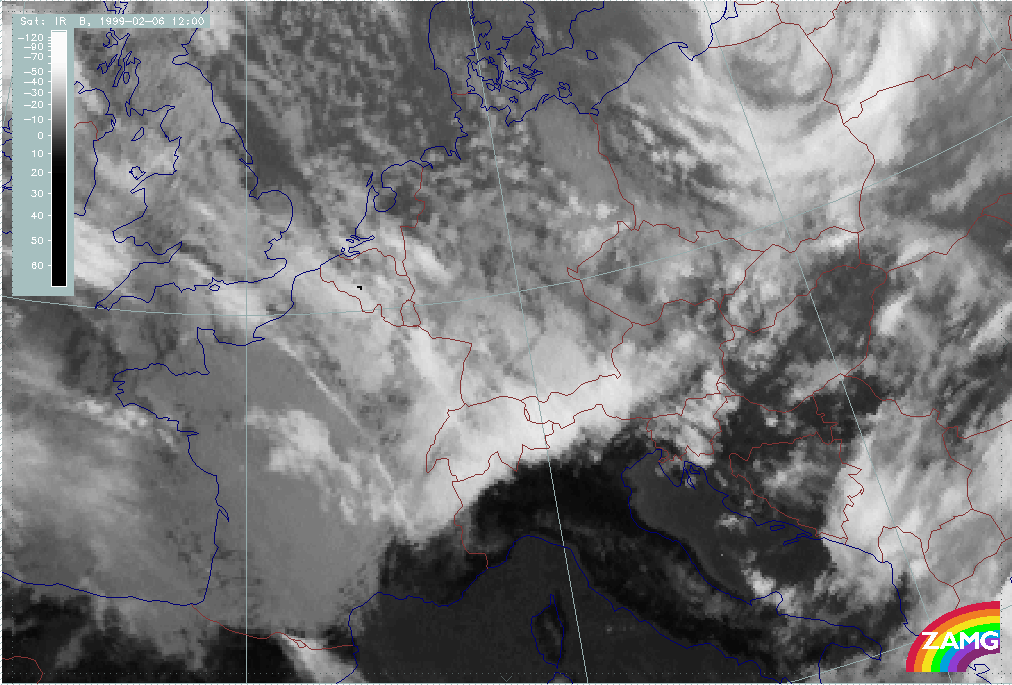
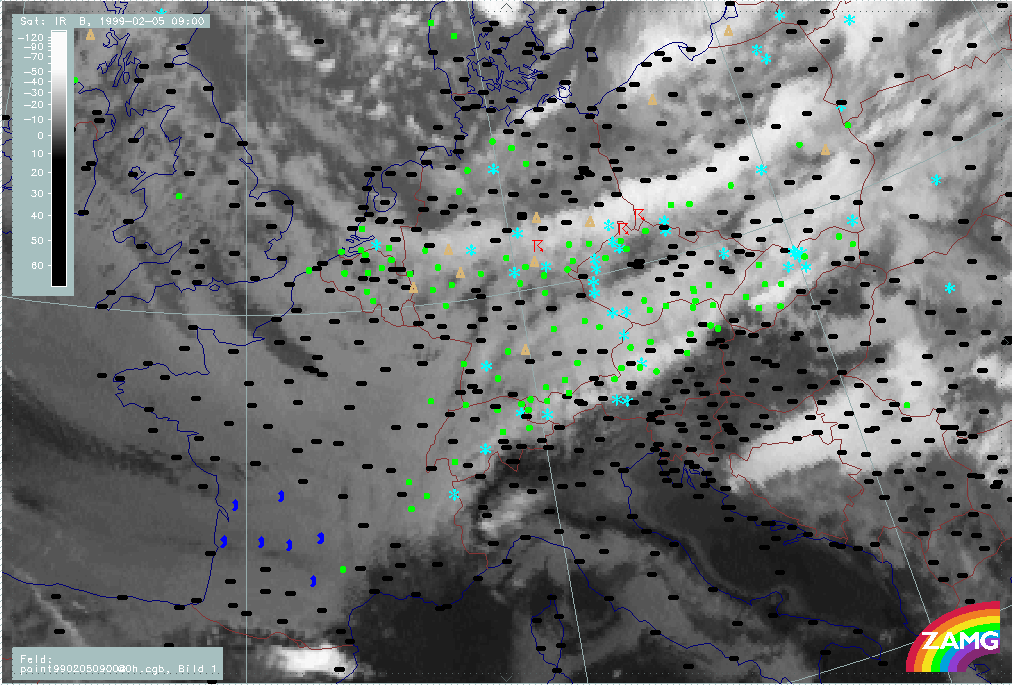
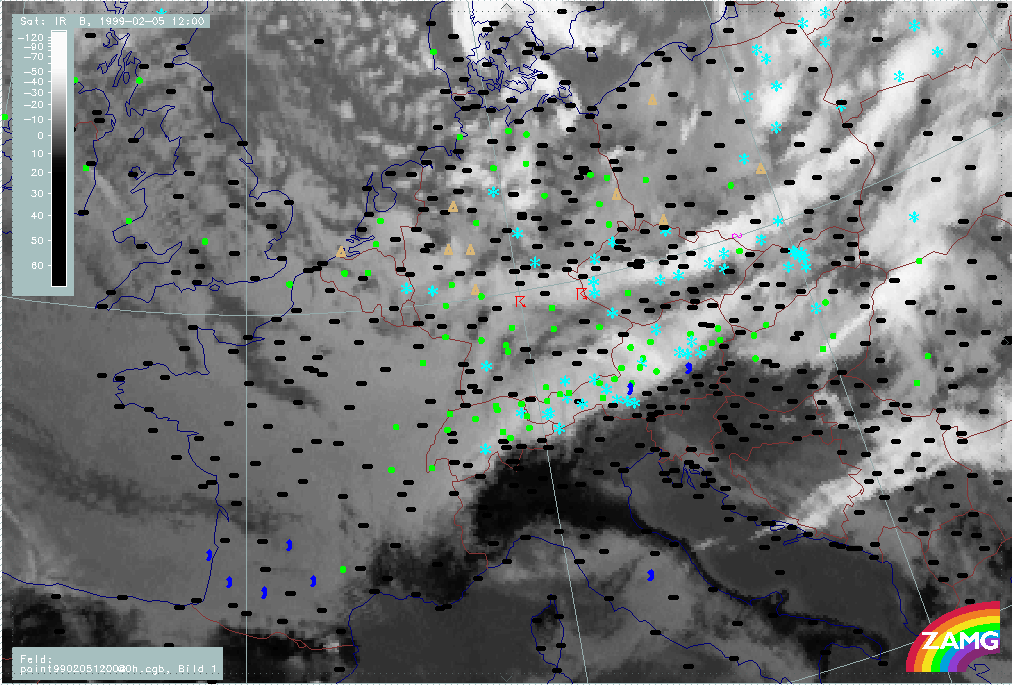
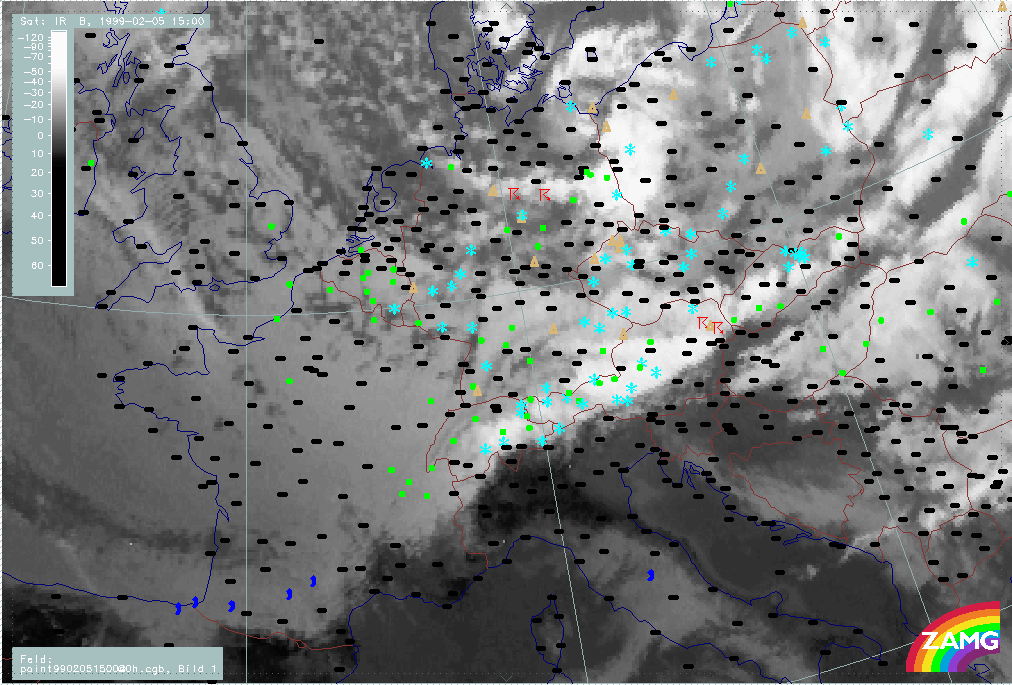
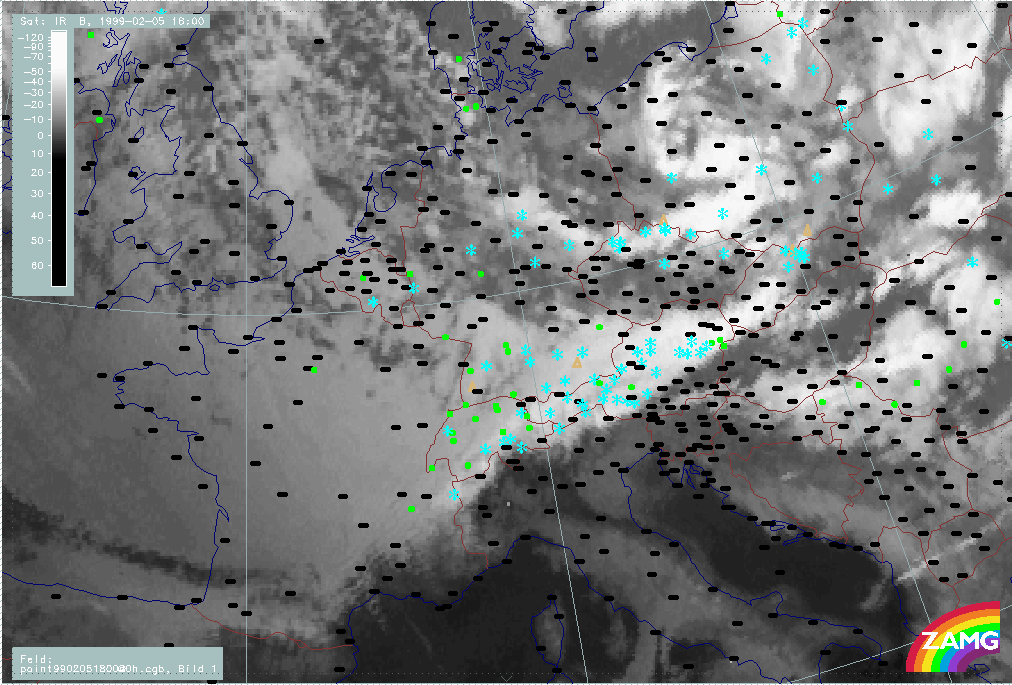
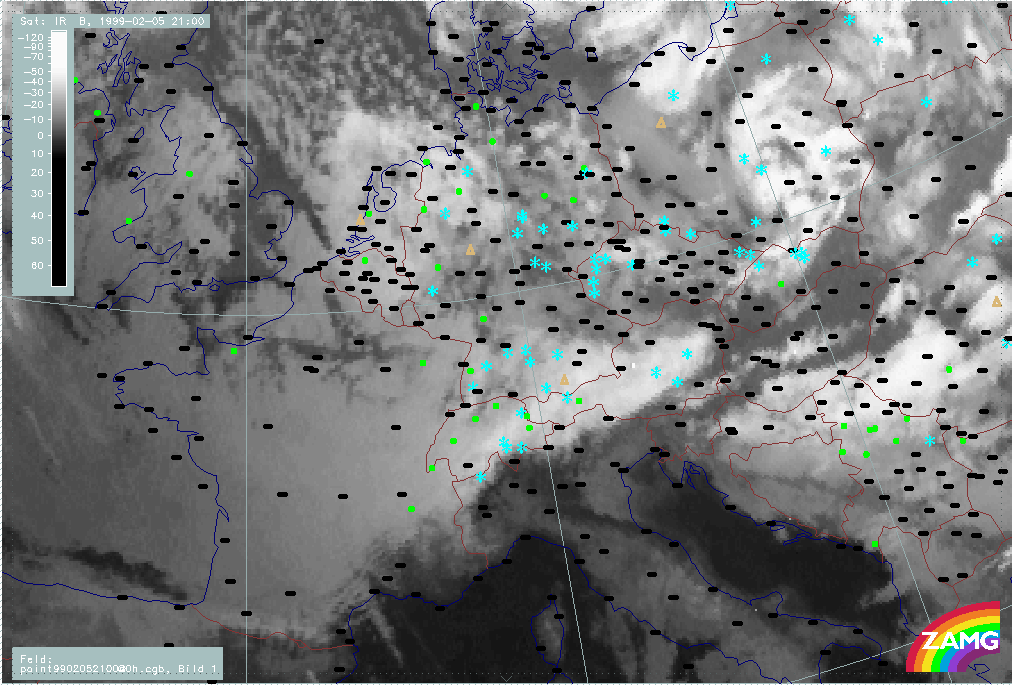
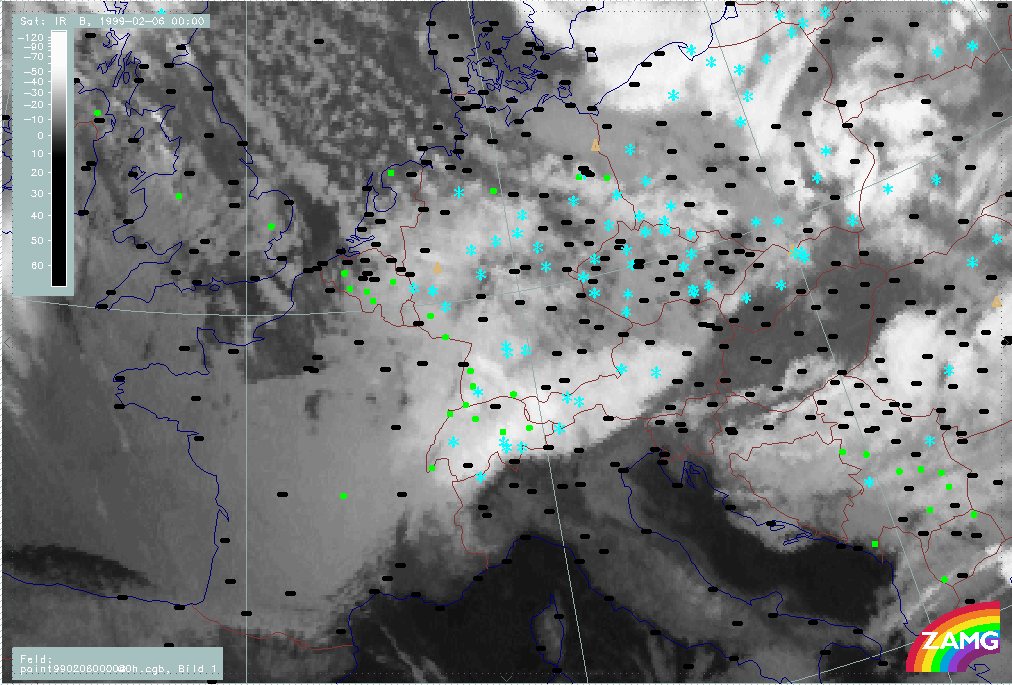
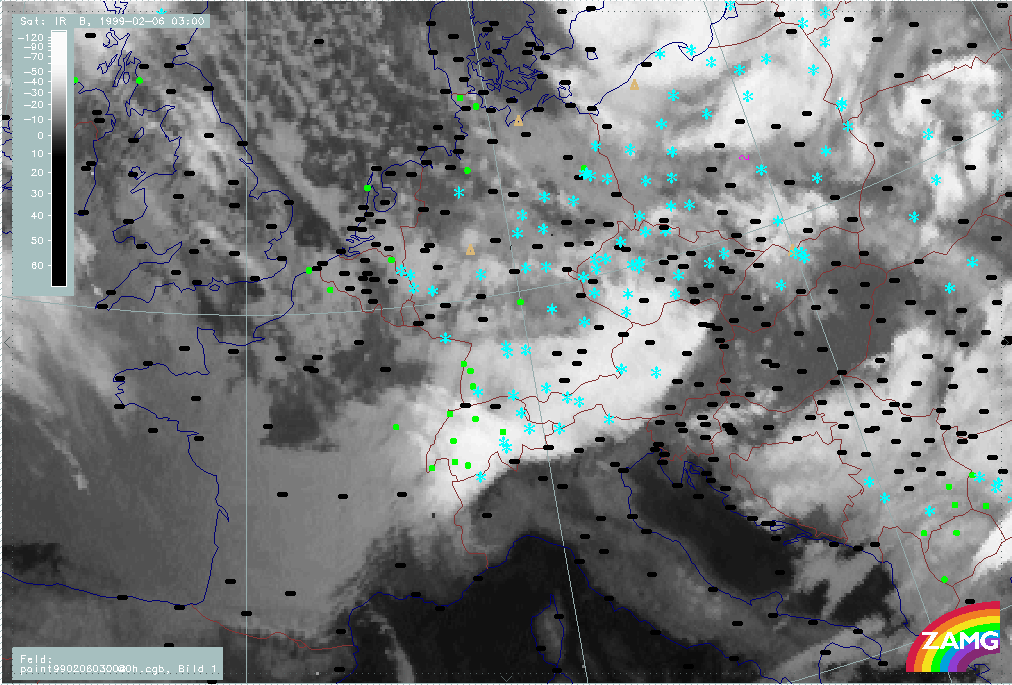
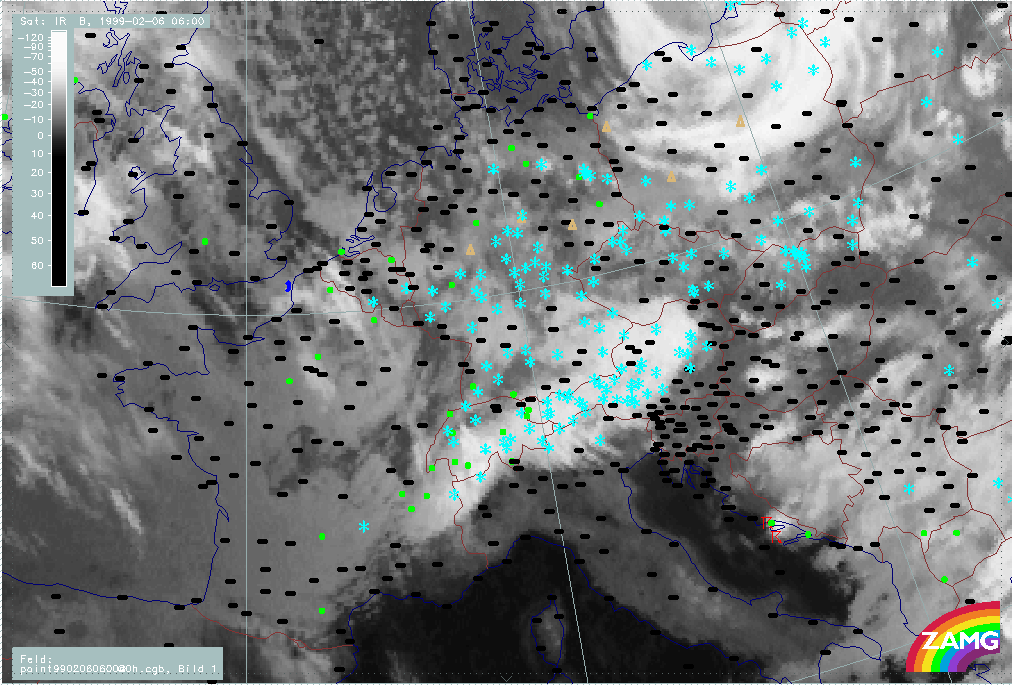
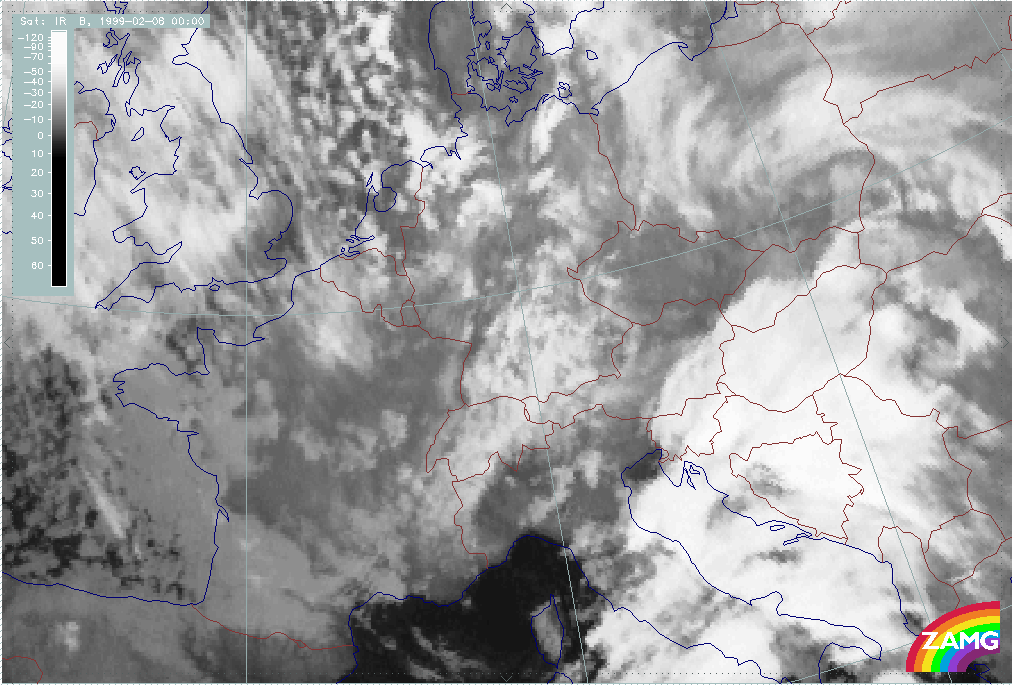
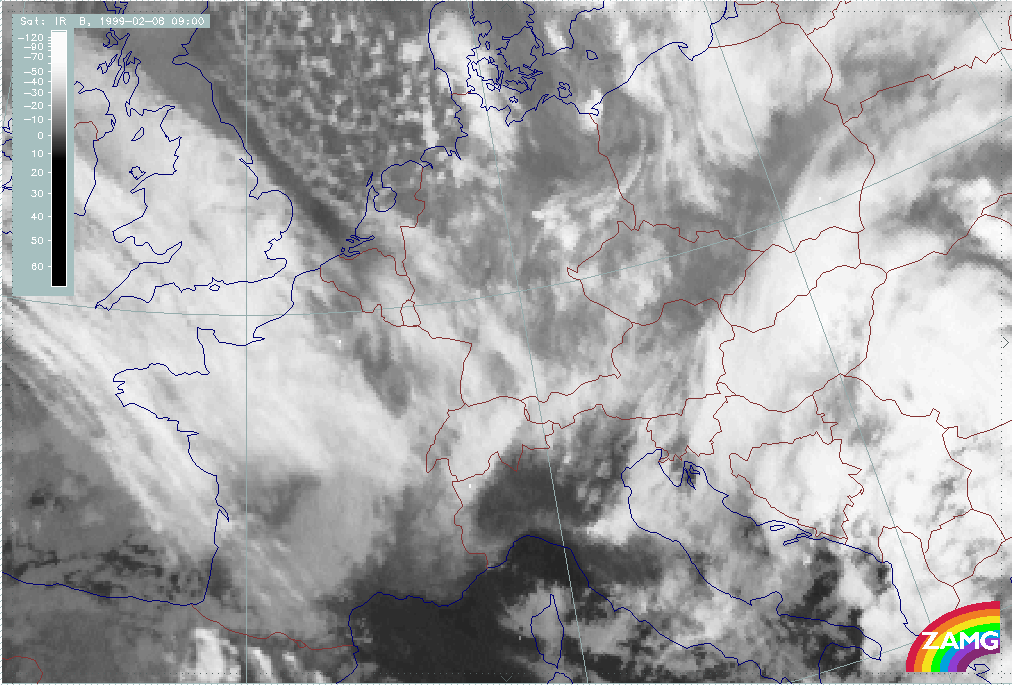
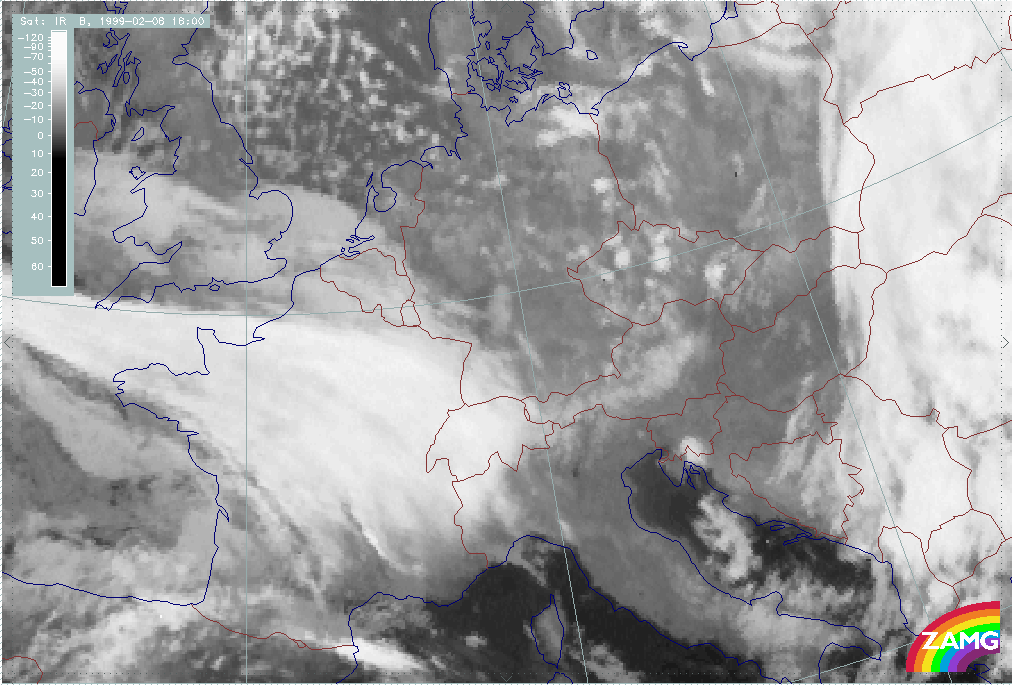
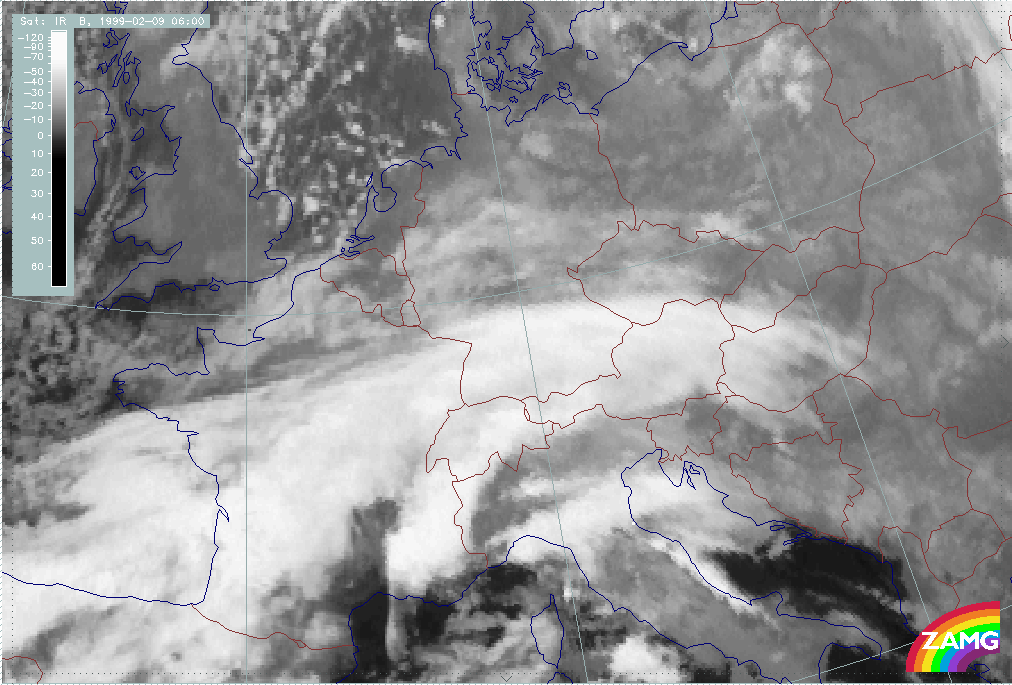
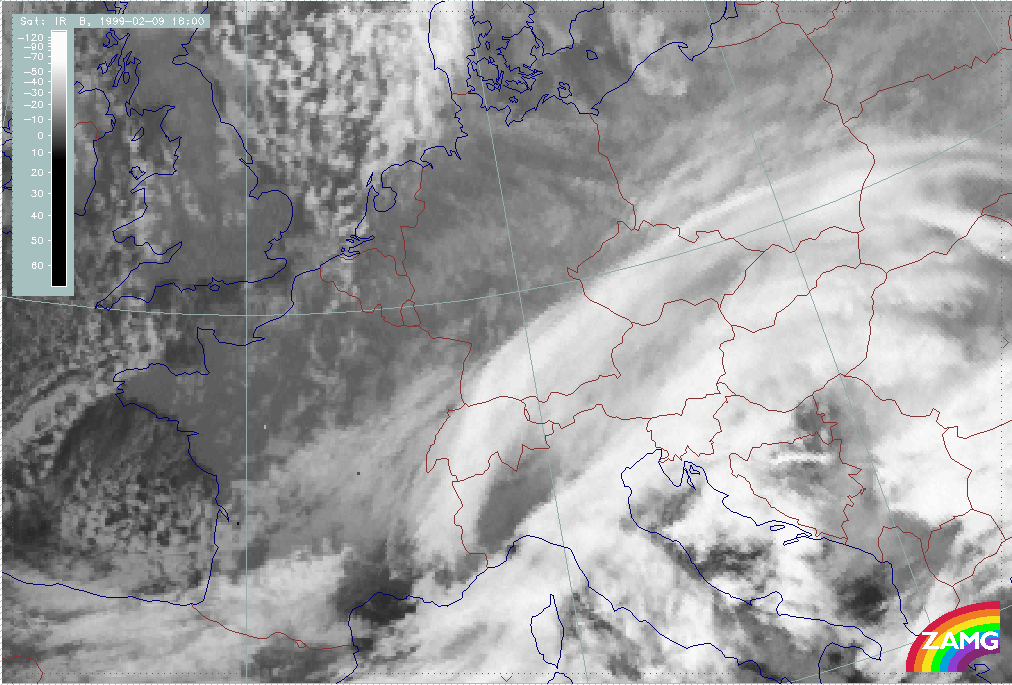
05 February 1999/06.00 UTC - Meteosat IR image; 05/06.00 - 06/12.00 UTC 3-hourly image loop
|
|
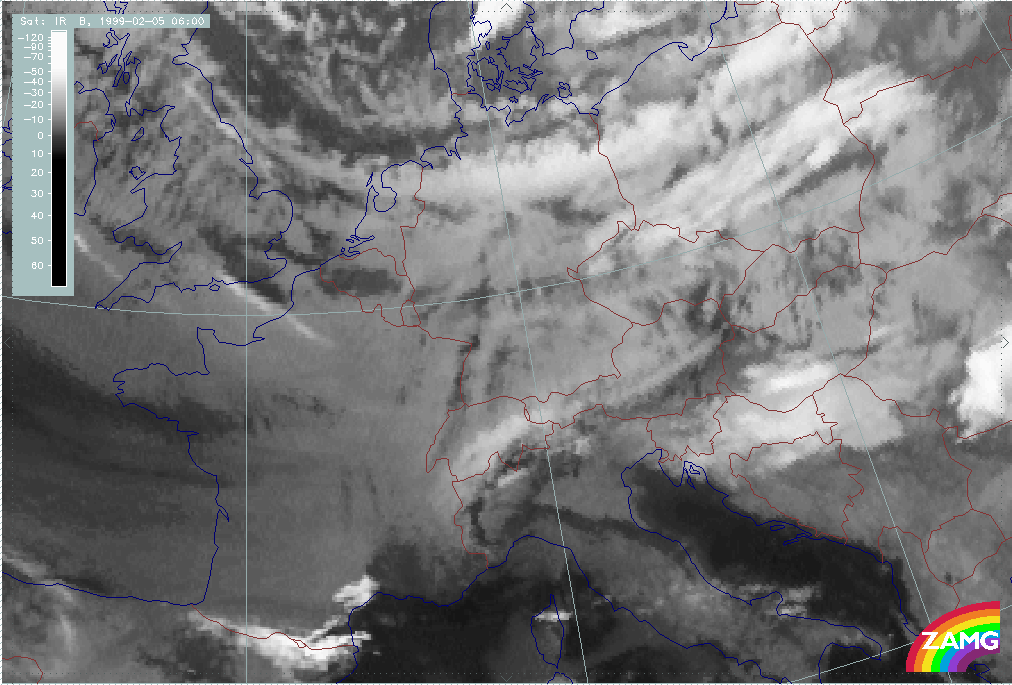
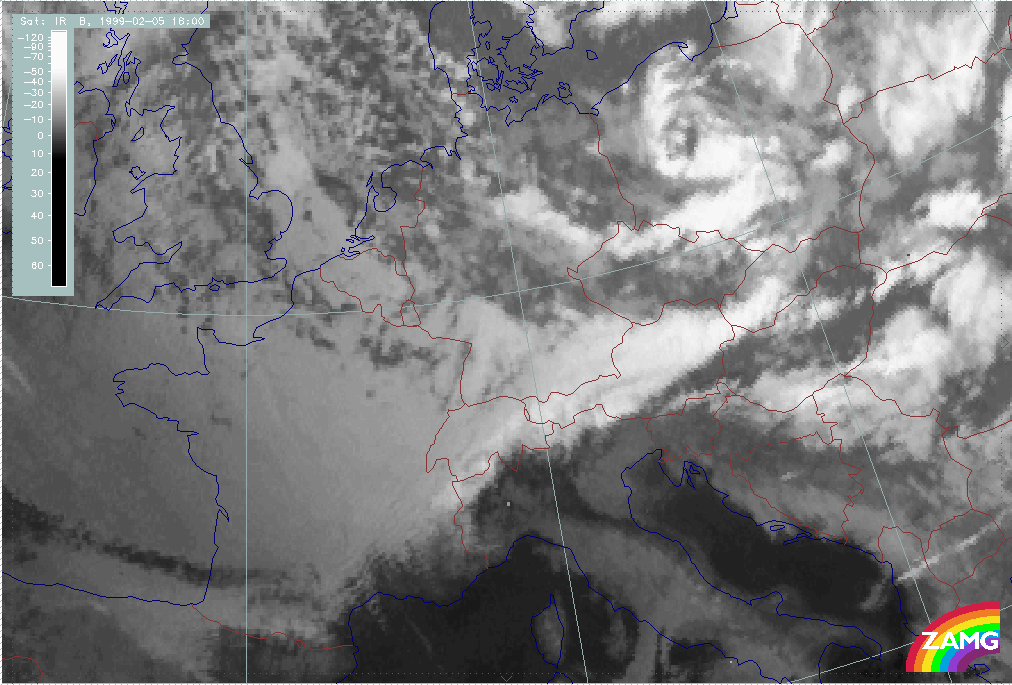
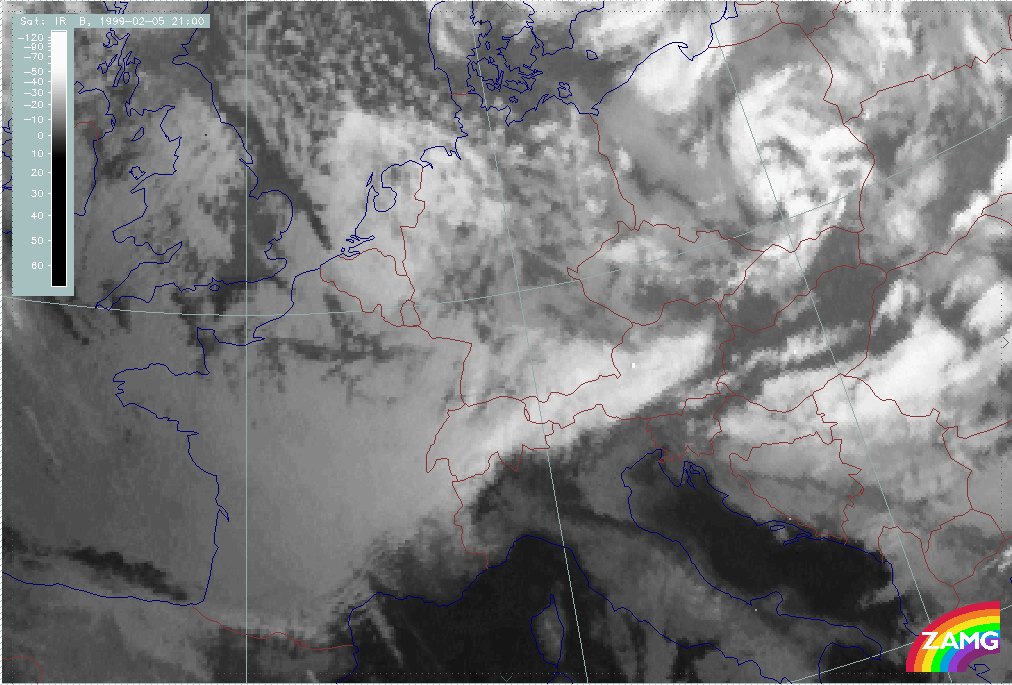
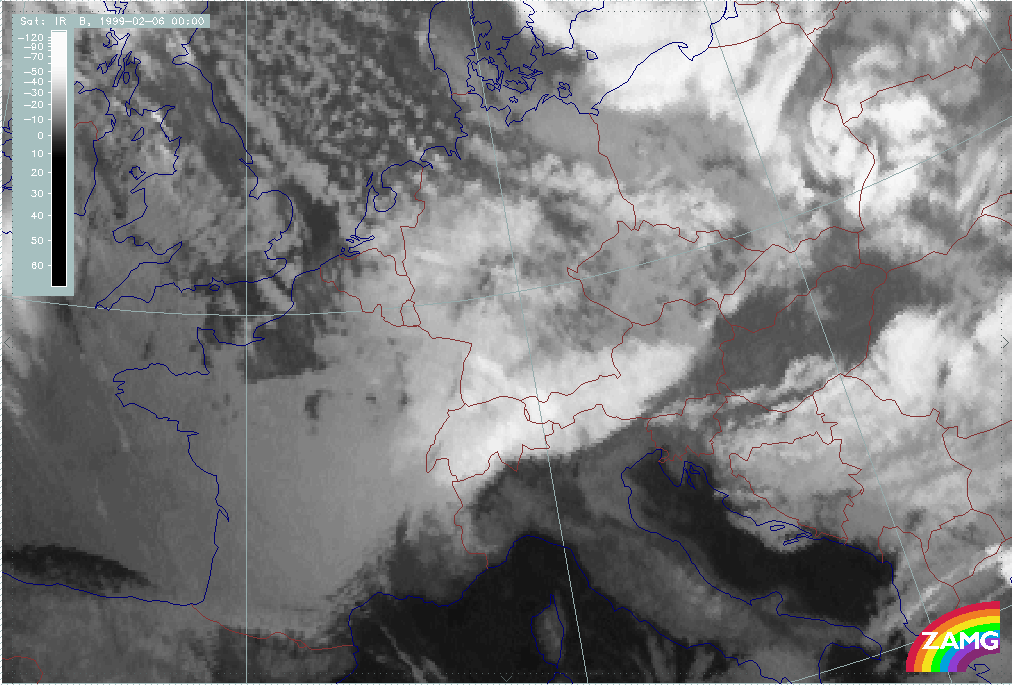
The main cloud features are Stau Clouds: in the beginning low Stau Clouds do exist but cloud tops are increasing in height during the rest of the phase. Special features are:
- The sharp boundary at the main mountain range forming a bow extending throughout Austria. In the beginning this bow is only a dark grey line (ph101: 06.00 UTC) which intensifies and finally forms a triangular shaped broad, bright Stau Cloud band (ph103: 12.00 UTC).
- Cold Stau Cloud extending far into the South of the Alps (S. Tyrol and Upper Italy; ph107: 06/00.00 UTC). This seems to go hand in hand with the crossing of a convective cloud band (compare loop of weather events below).
- Parallel lines within the Stau Cloud south of and perpendicular to the main mountain chain (ph109: 06/06.00 UTC) over N. Italy and especially ph111, 06/12.00 UTC over Slovenia and
Croatia; these lines might be superimposed Lee Cloud that
- starts at single mountains within the region of highest mountains,
- undergoes descent immediately to the south of the highest mountains which leads to a small area of cloud dissipation (Carinthia - Styria) and
- forms again more to the south (Slovenia - Croatia)
|
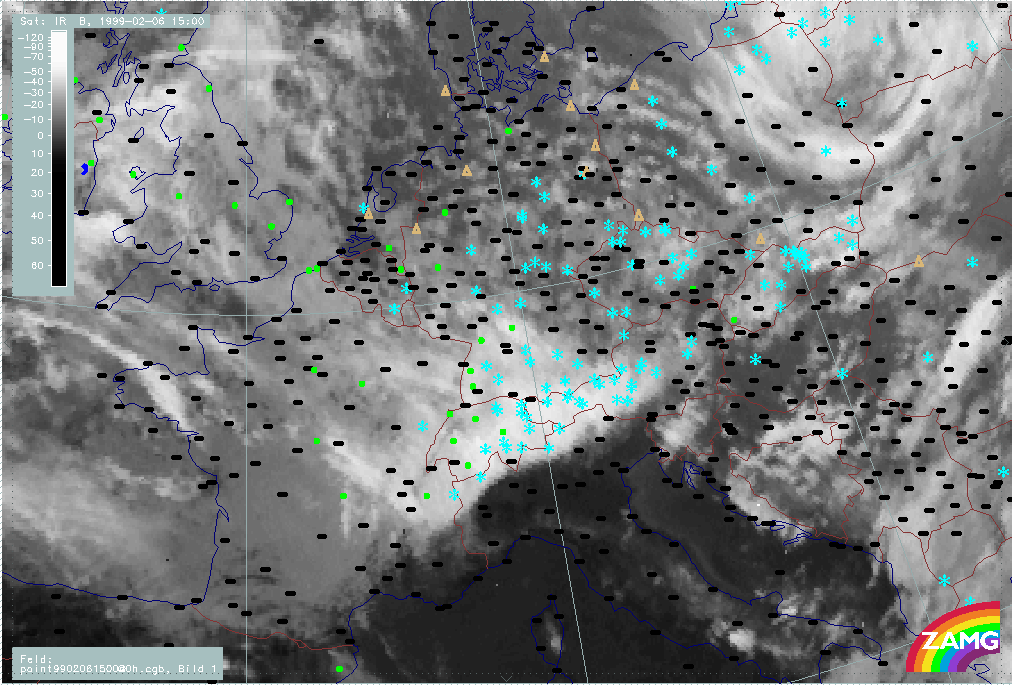
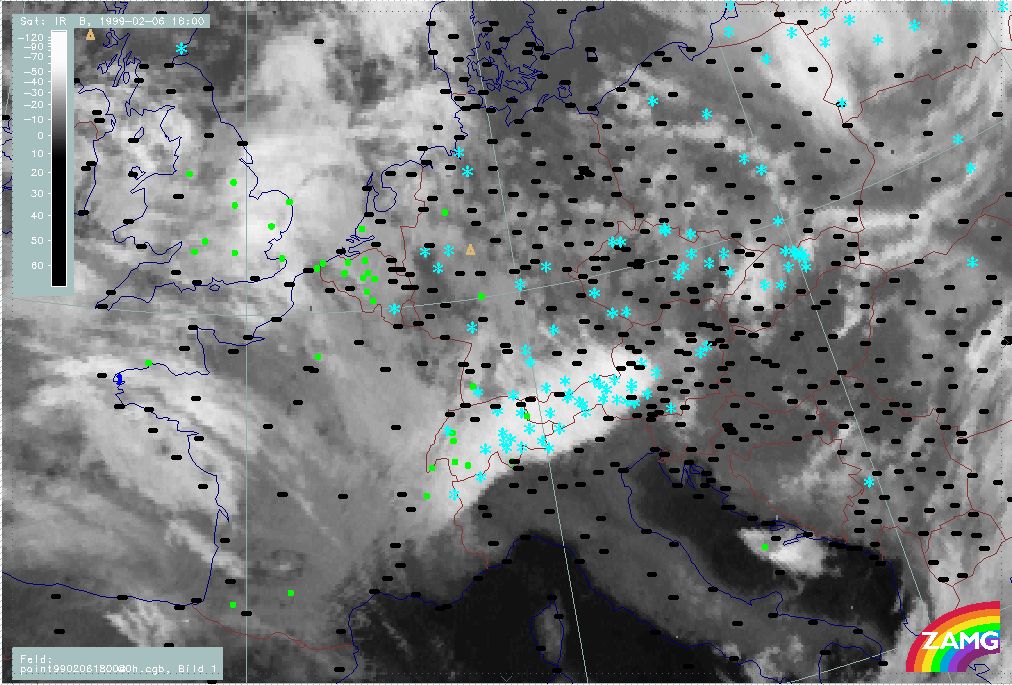
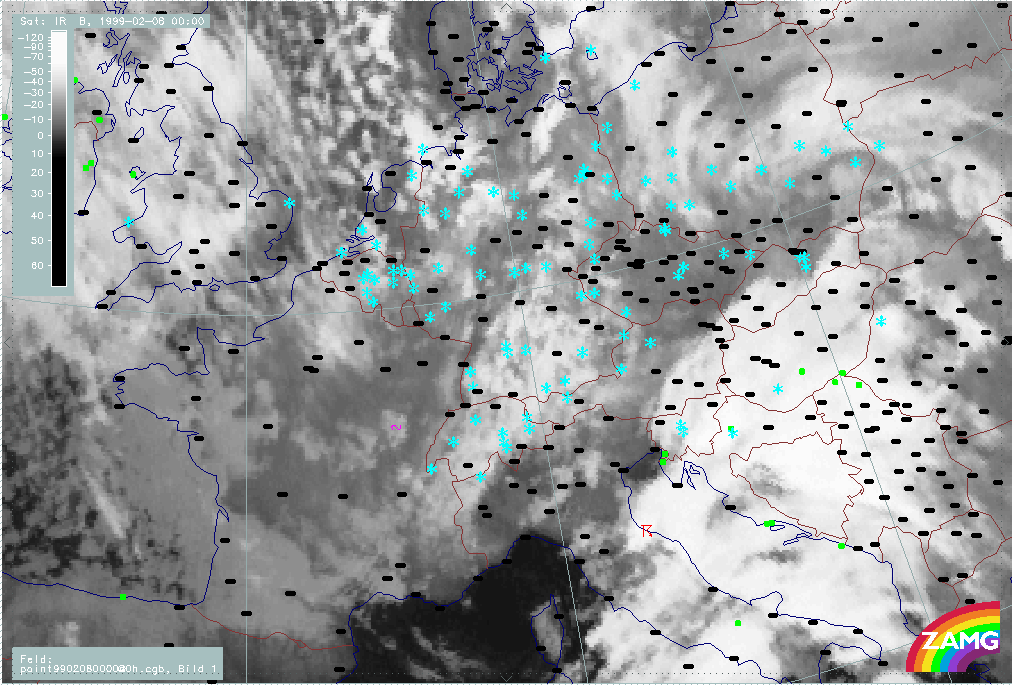
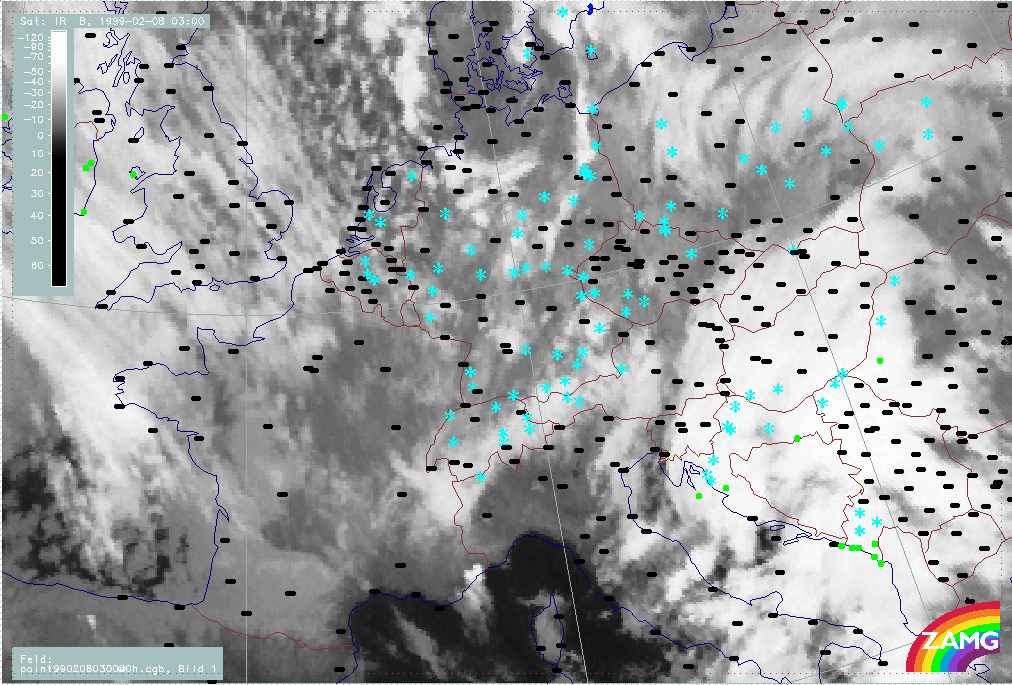
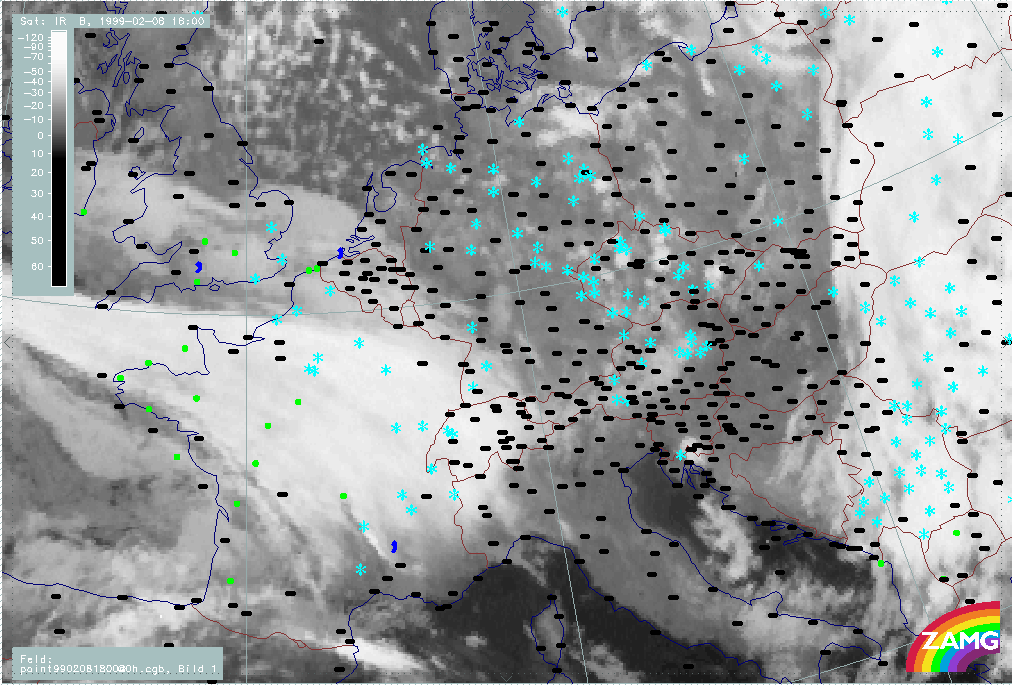
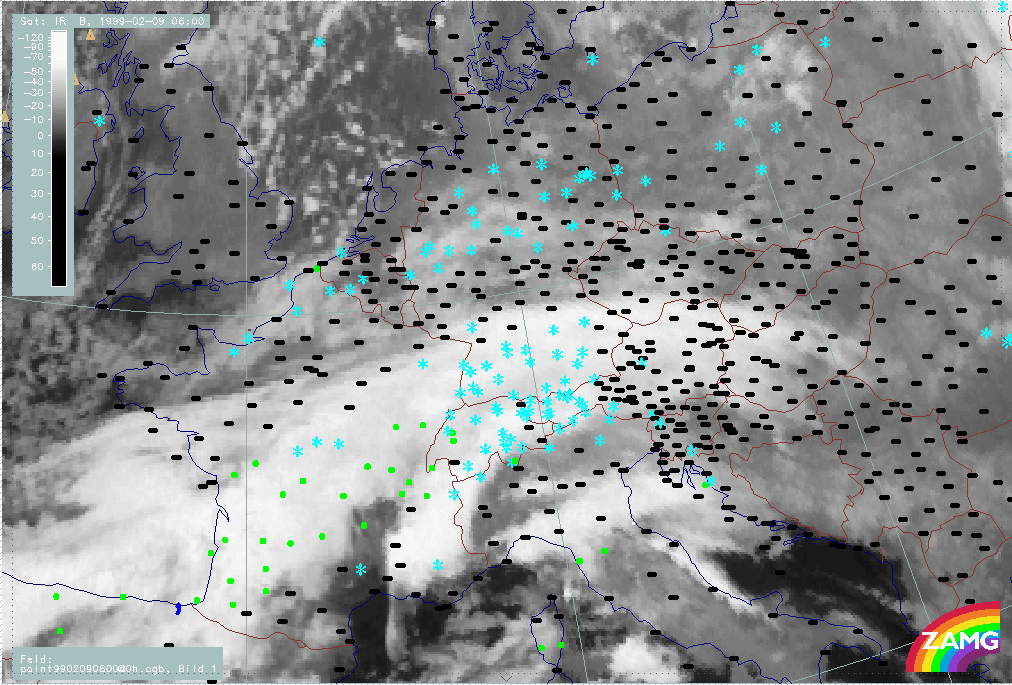
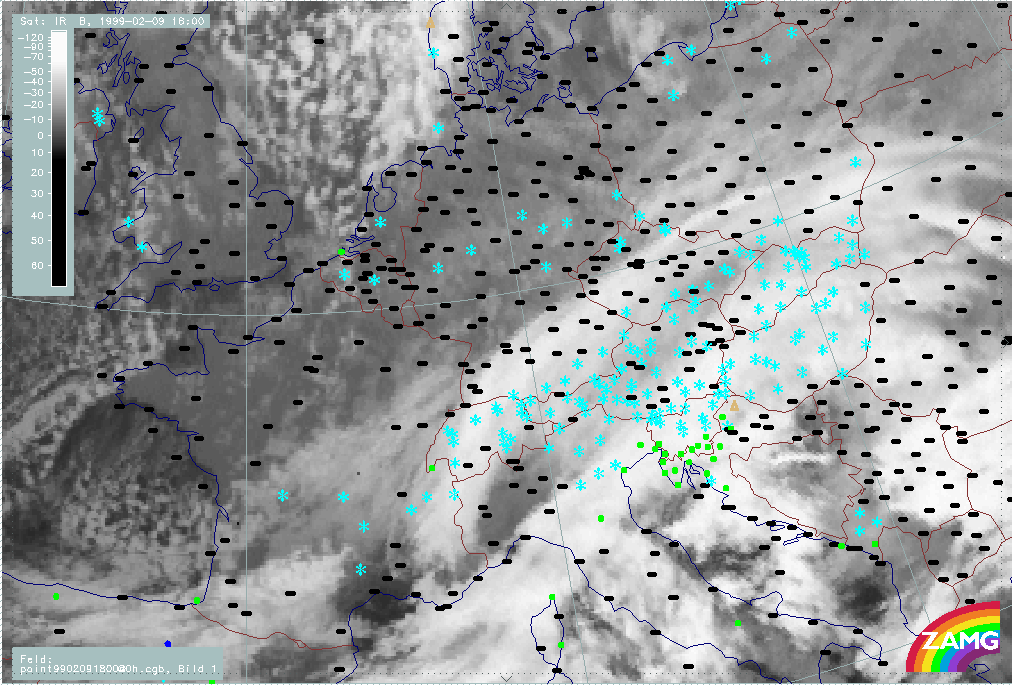
05 February 1999/06.00 UTC - Meteosat IR image; weather events (green: rain and showers, blue: drizzle, cyan: snow, red: thunderstorm with precipitation, purple: freezing rain, orange:
hail, black: no actual precipitation or thunderstorm with precipitation); 05/06.00 - 06/12.00 UTC 3-hourly image loop
|
|
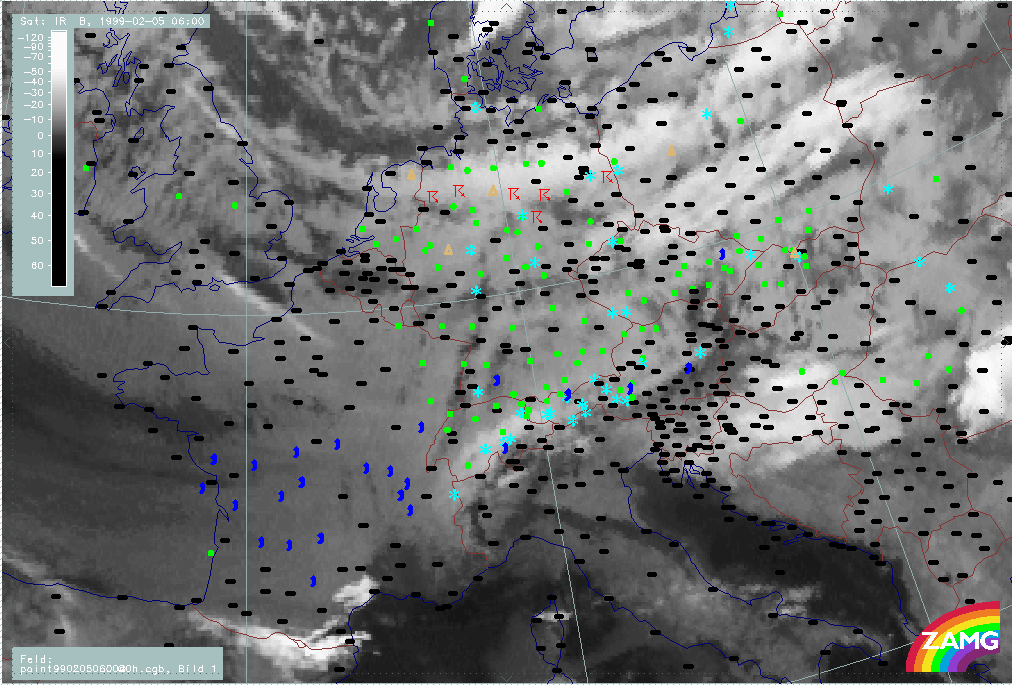
- There is precipitation in the Alpine region throughout the whole period;
- During a short phase (05/21.00 - 06/00.00 UTC) precipitation is concentrated only on the mountains. But during the rest of the phase precipitation is also widespread north and north-west of the Alps in Germany and France.
- In the beginning of this phase (05/06.00 - 05/15.00 UTC), snow exists only in the high Alpine mountain ranges while north and north-west of the Alps rain prevails. This changes from 05/15.00 UTC onwards to snow. Only over Switzerland rain events can be observed longer, until about 06/06.00 UTC.
- The phenomenon of a southward moving small convective cloud band which crosses the Alps shows up very dramatically in the weather reports with a line of thunderstorms which even reach E. Austria at 05/15.00 UTC.
|
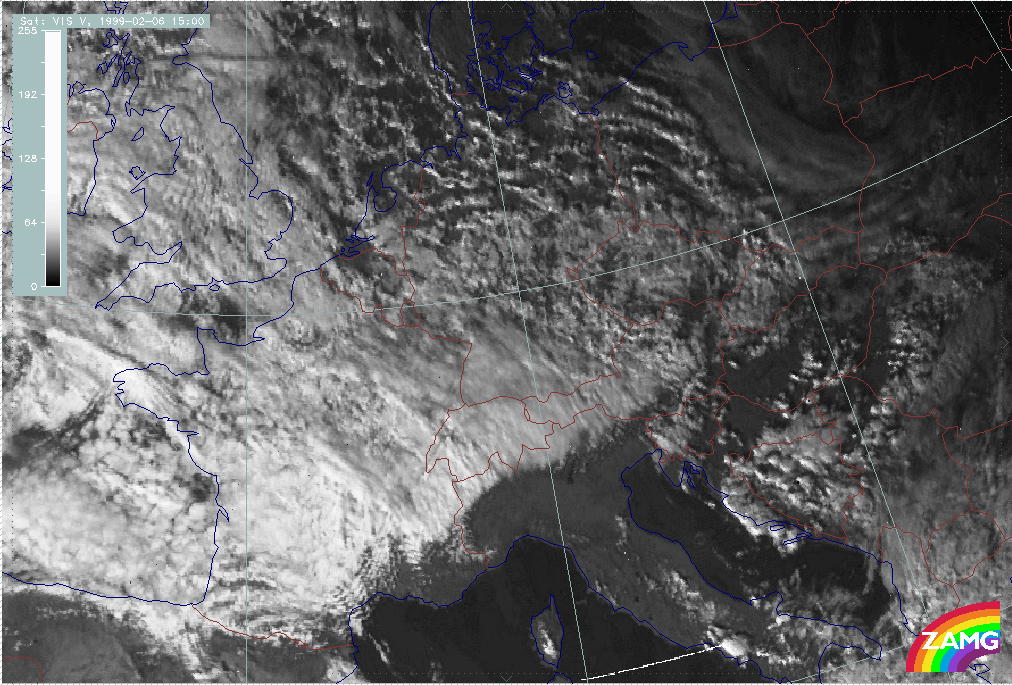
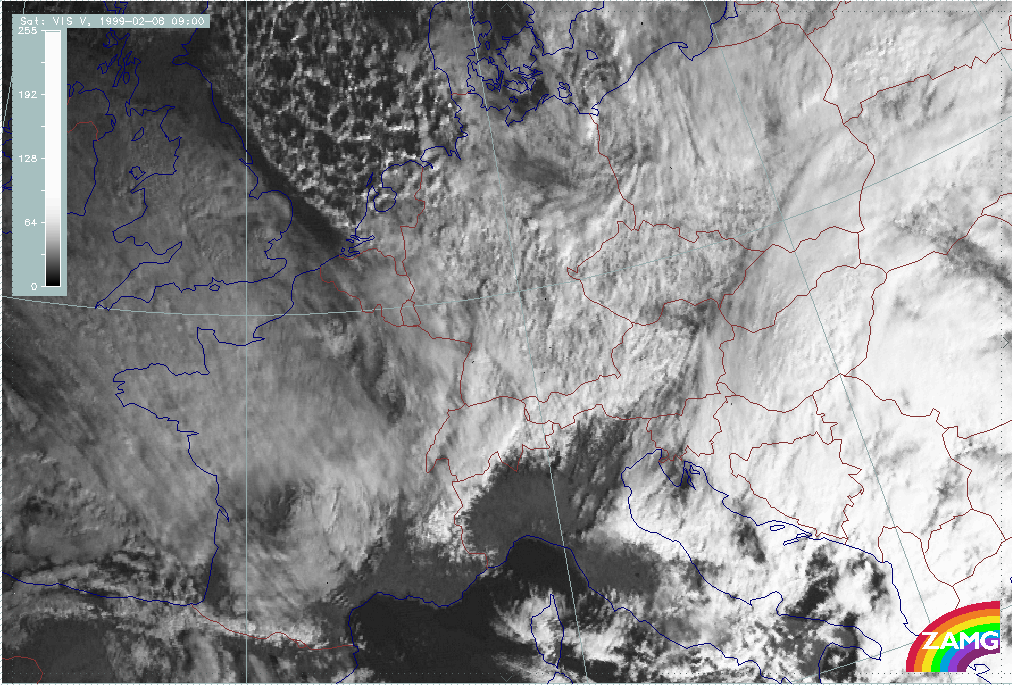
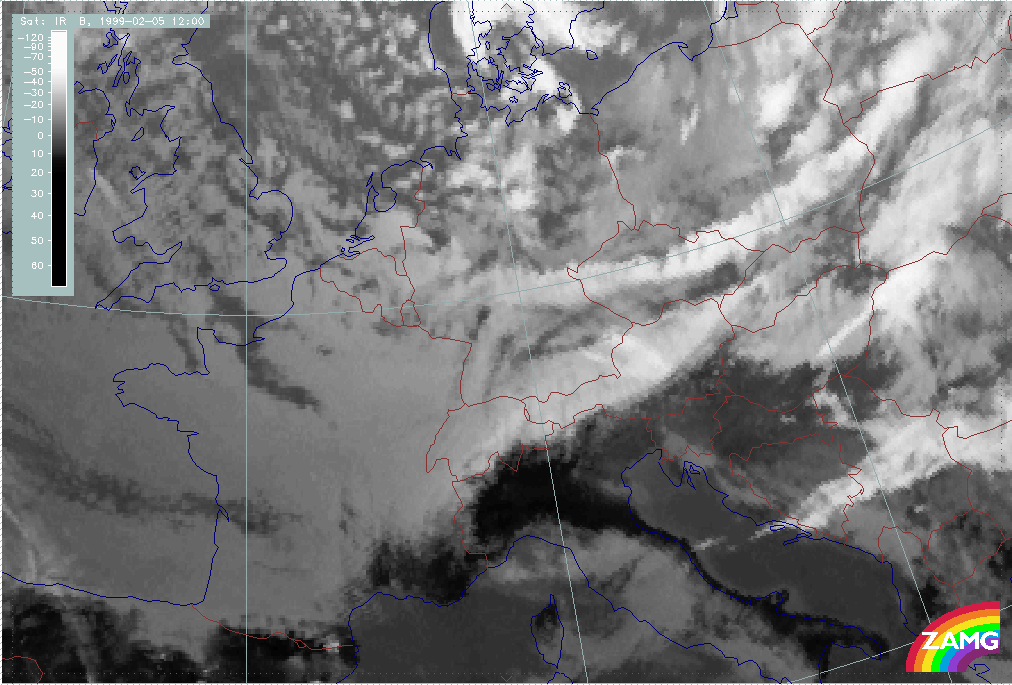
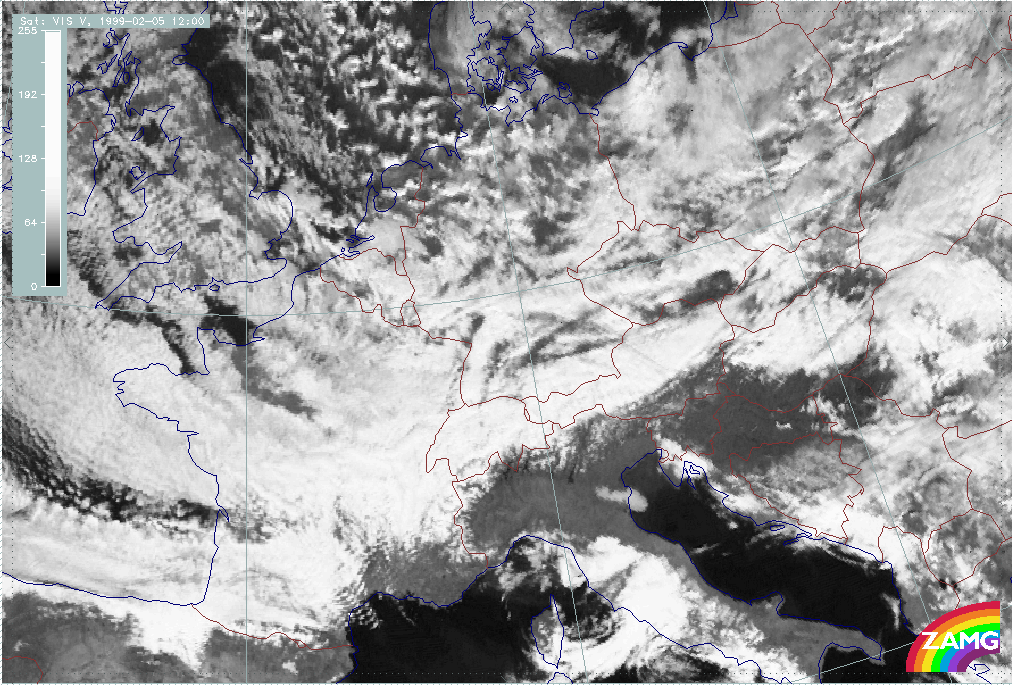
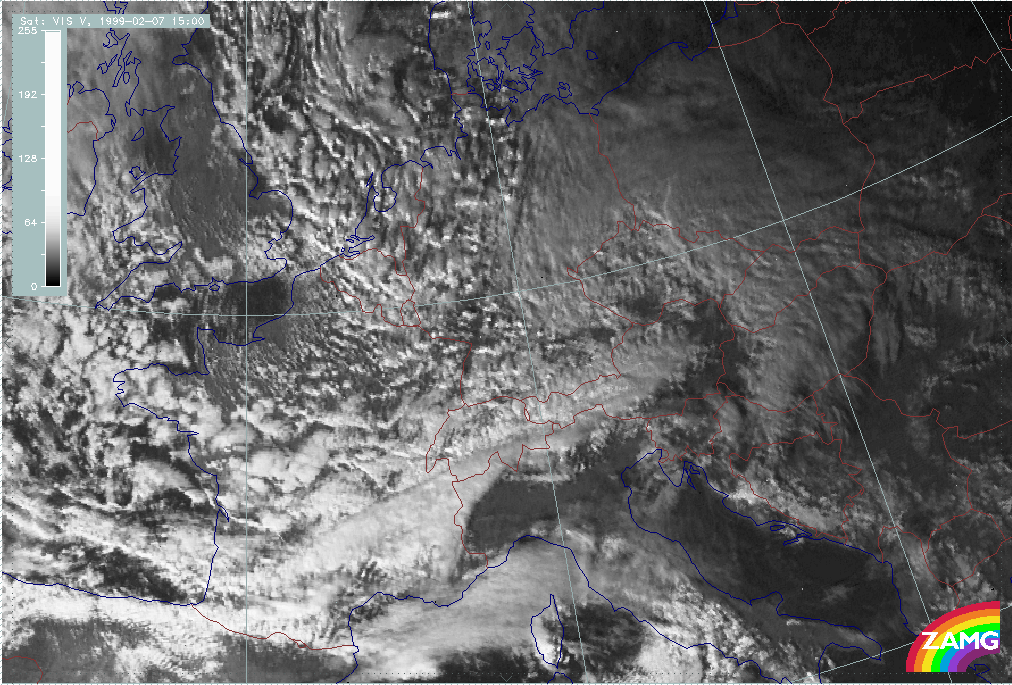
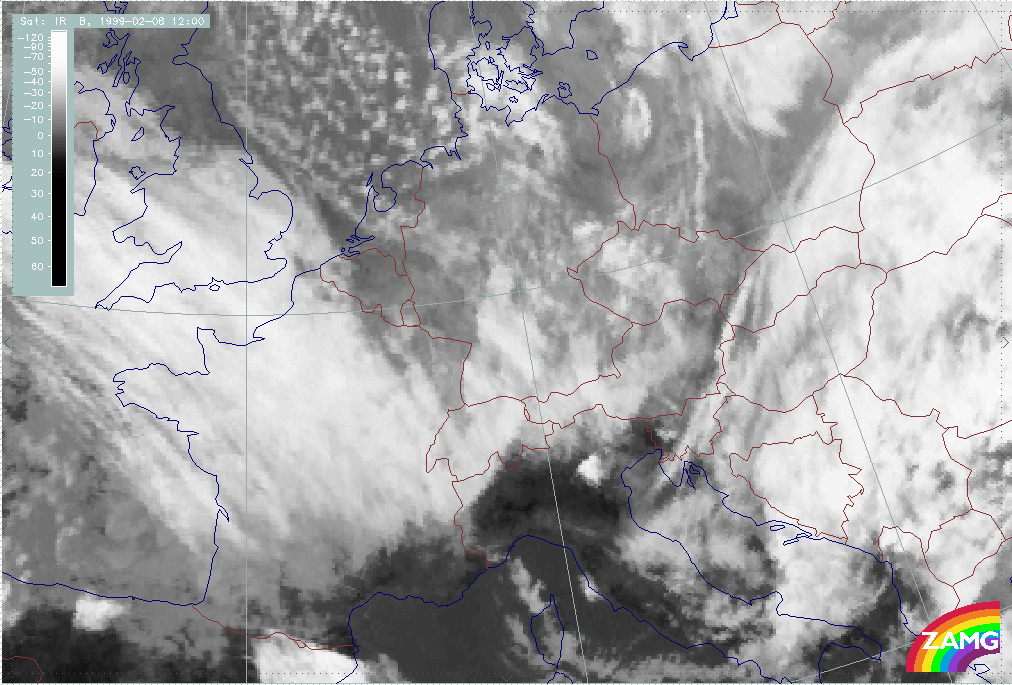
05 February 1999/09.00 UTC - Meteosat VIS image; 09.00 - 15.00 UTC 3-hourly image loop
|
|
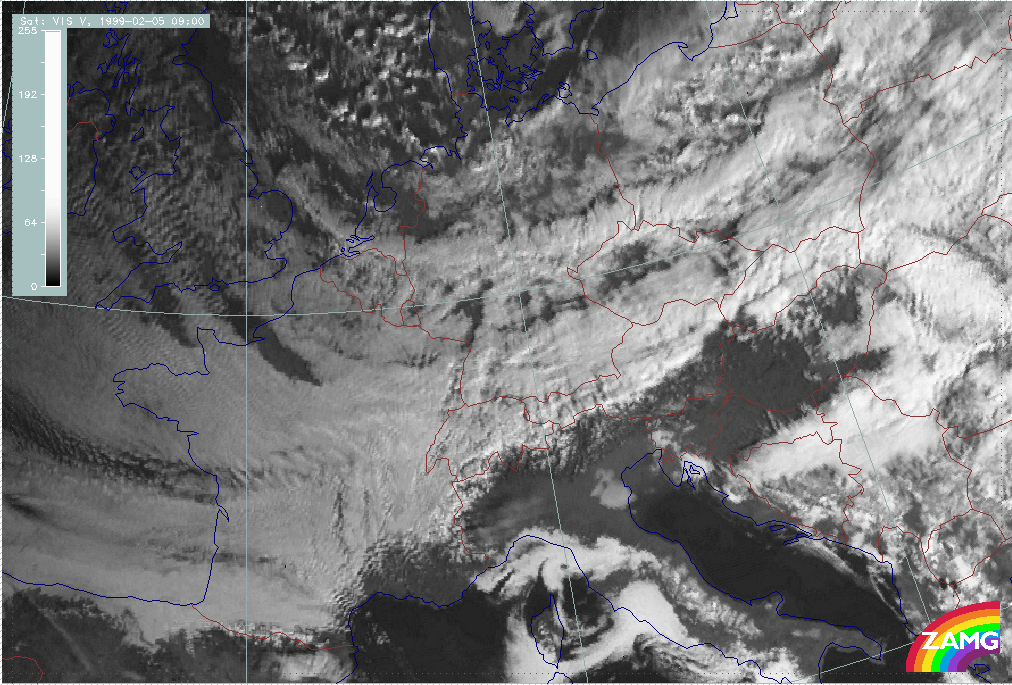
Stau clouds in the VIS images are quite impressive. Main features are:
- The sharp boundary of the Stau Cloud at the highest mountain range with snow covered mountain ranges to the south (ph104v: 05/12.00 UTC)
- The sharp northern boundary of the Stau Cloud through Bavaria (ph103v: 05/12.00 UTC)
- Parallel band-like structures north of the Alps superimposed on the Stau Cloud but perpendicular to it (ph102v: 05/09.00 UTC and ph104v: 05/15.00 UTC)
For a detailed example see: Thickness gradient forming a trough
Phase 2: 06 February/18.00 - 07 February/18.00 UTC
This phase is characterised by:
- Sequence of frontal passages:
- Approach of a WA maximum and increase of WA cloud north of Alps
- Cold Air Development (CAD) from a Comma feature north of Alps and subsequent crossing of the Alps
- Non frontal conditions for the CAD phase
- Changing conditions of Temperature Advection (TA): CA - WA - CA
- PVA plays an additional role, especially in the CAD phase
- Main cloud features are: Stau features, CAD
|
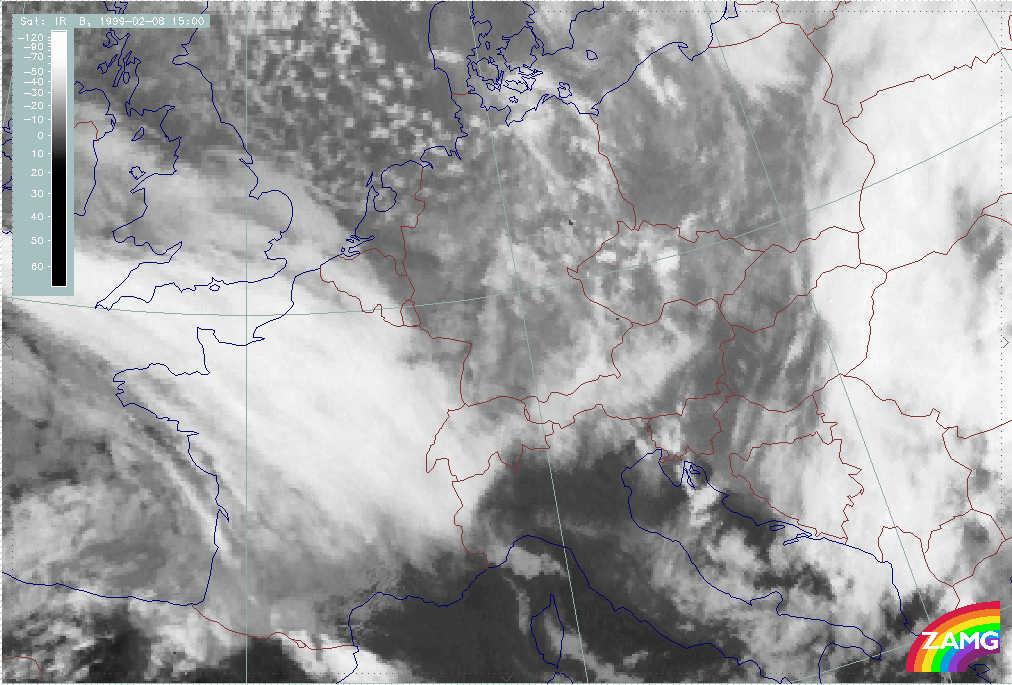
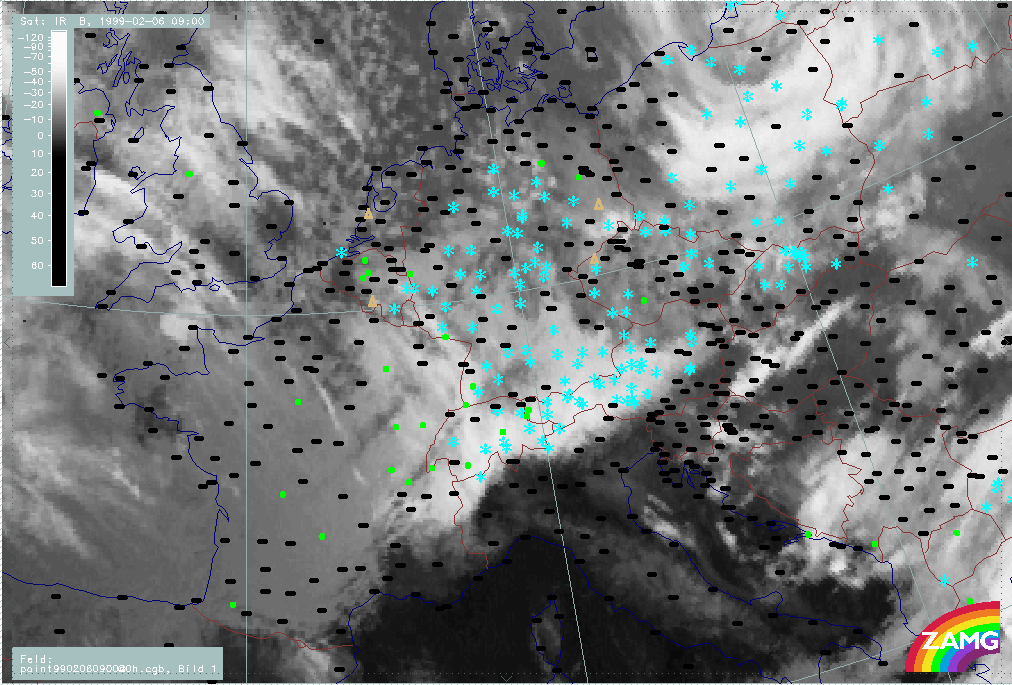
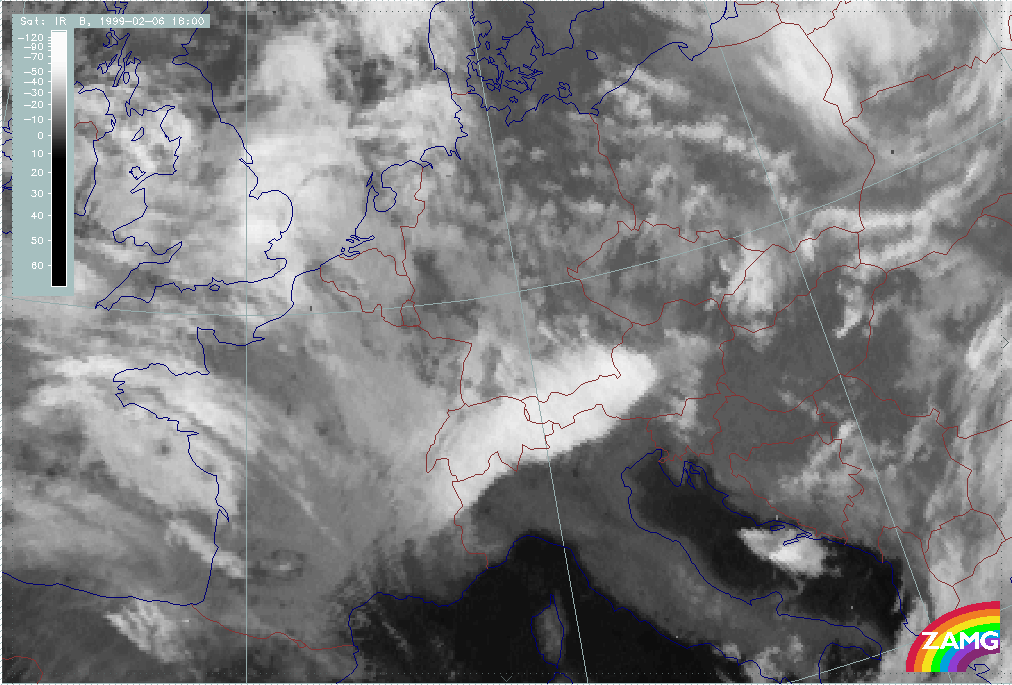
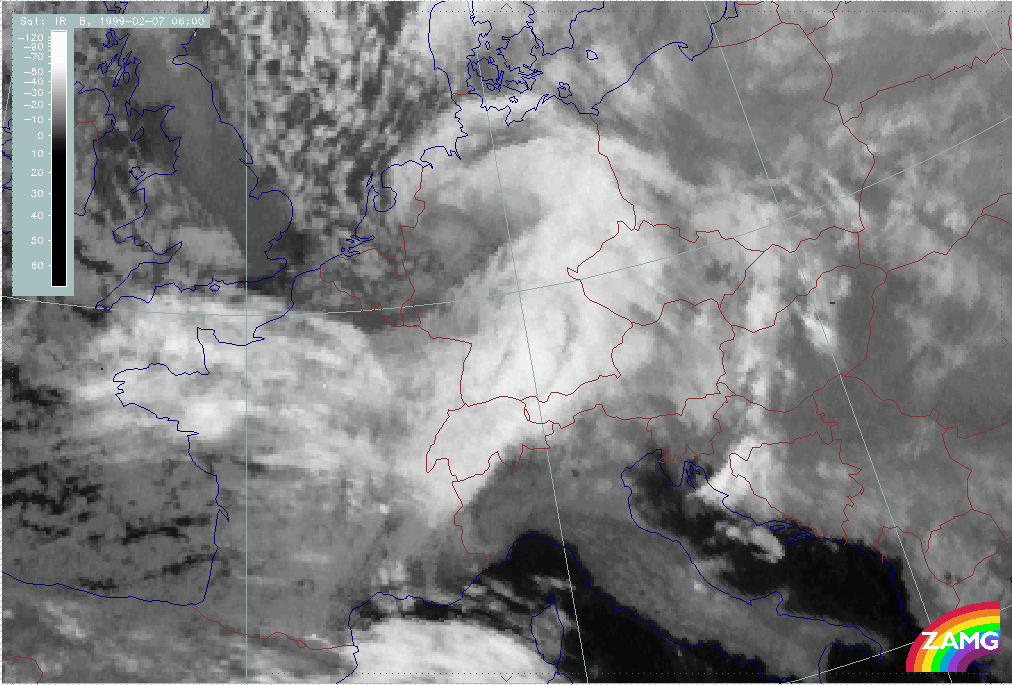
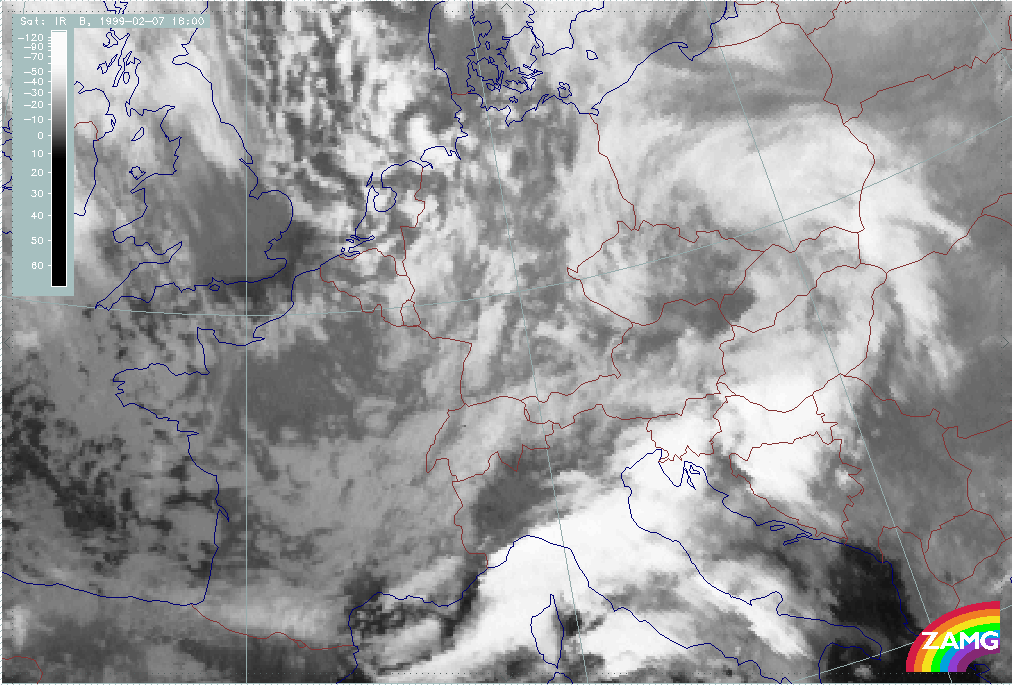
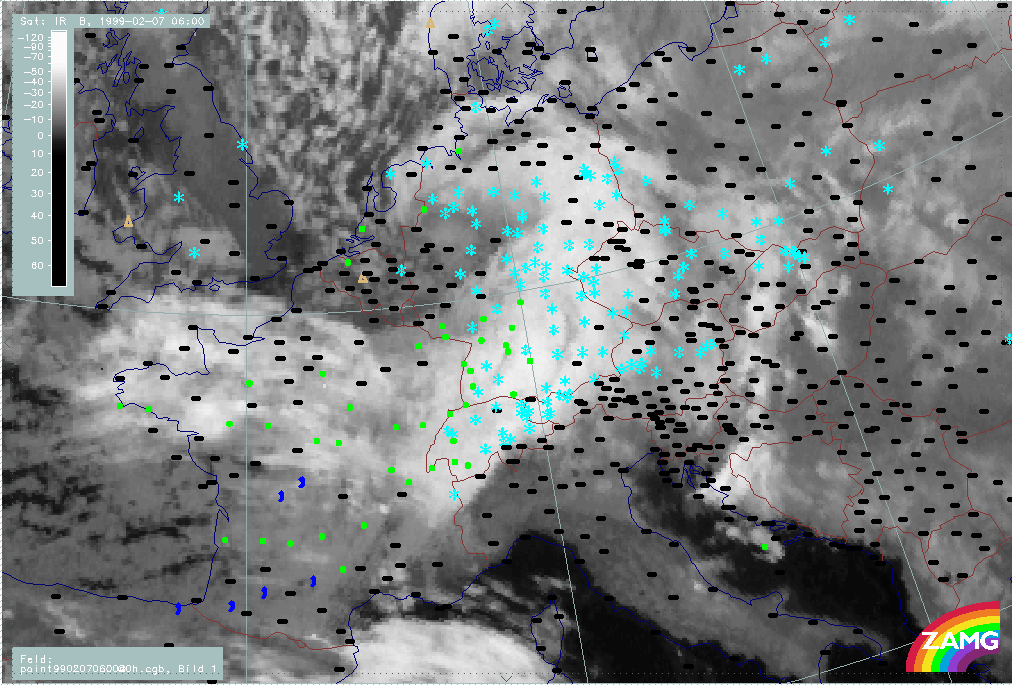
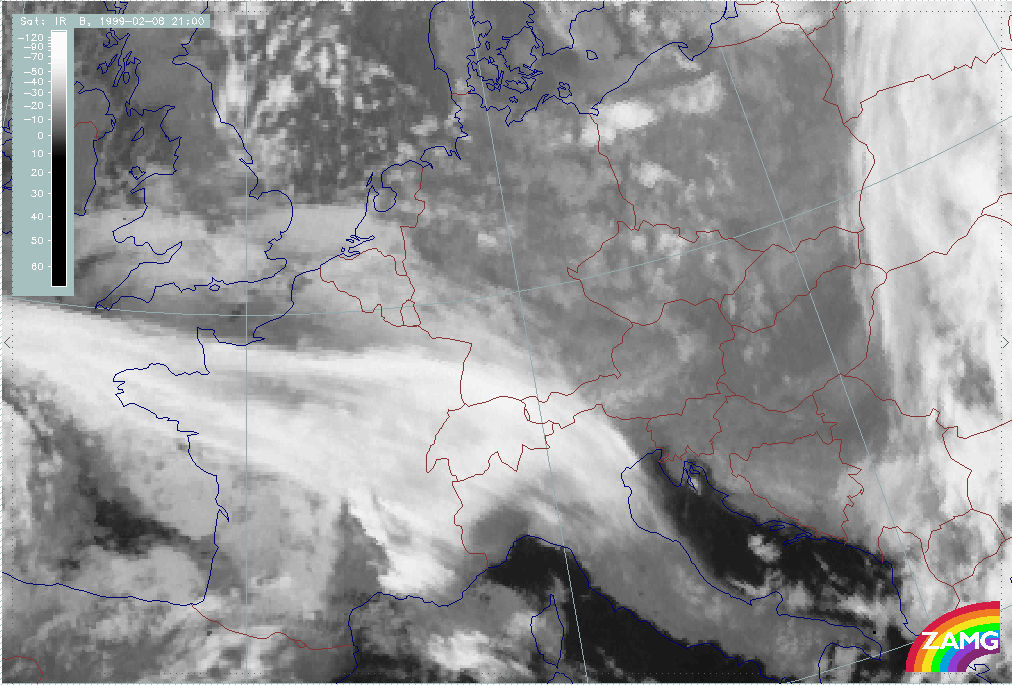
06 February 1999/15.00 UTC - Meteosat IR image; 06/15.00 - 07/18.00 UTC 3-hourly image loop
|
|
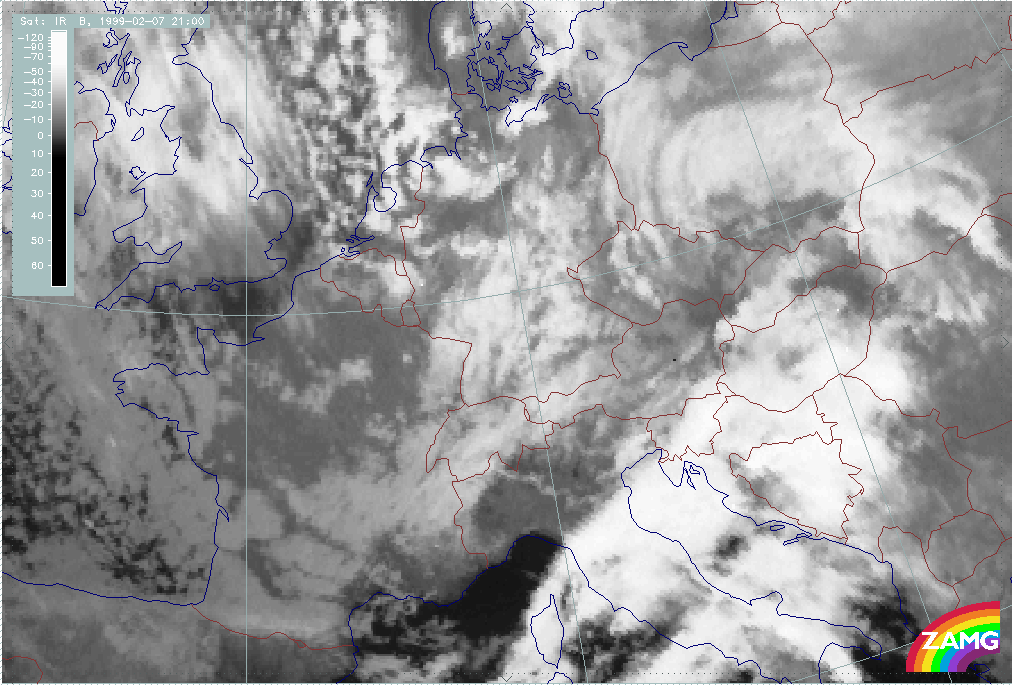
- During the first phase from 06/12.00 to 21.00 UTC (ph201 - ph203), fibrous cloudiness typical of a Detached Warm Front develops north and north-west of the Alps.
- At the same time there are distinct Stau features at the Alps with a distinct southern boundary extending from NW. Italy across S. Tyrol into Austria, where it ends at the main mountain chain of the "Hohe Tauern". So this southern boundary of the Stau Cloud is quite far to the south (east) of the highest mountain chains.
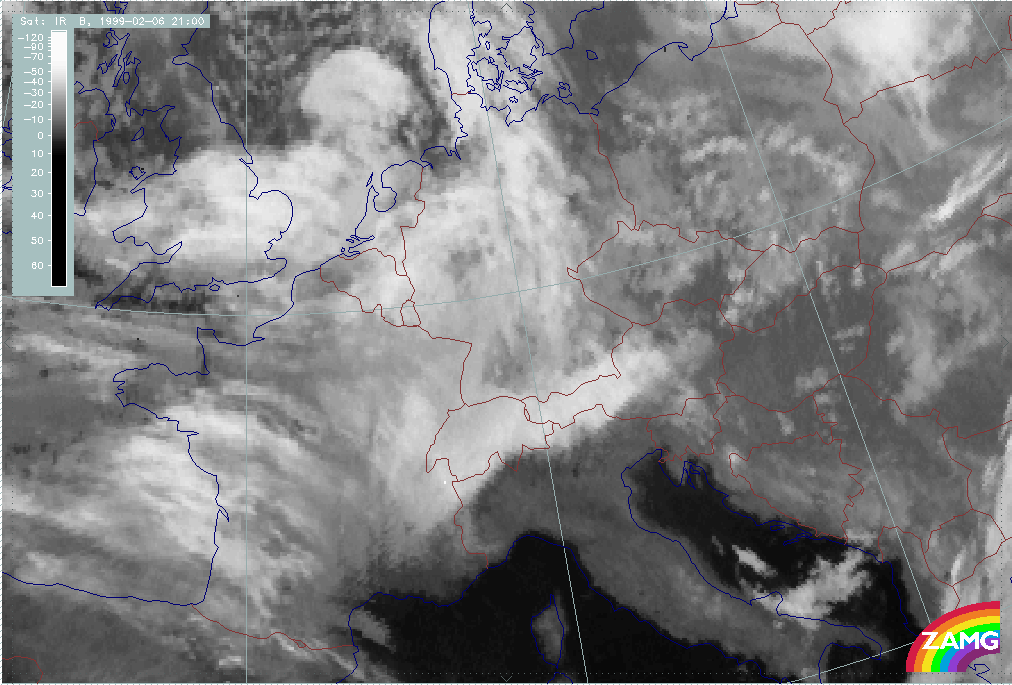
- At 06/21.00 UTC, the fibrous Warm Front cloudiness becomes more widespread over Germany which is in front of a Comma configuration developing over the North Sea. This Comma develops further and moves southward approaching the Alpine region.
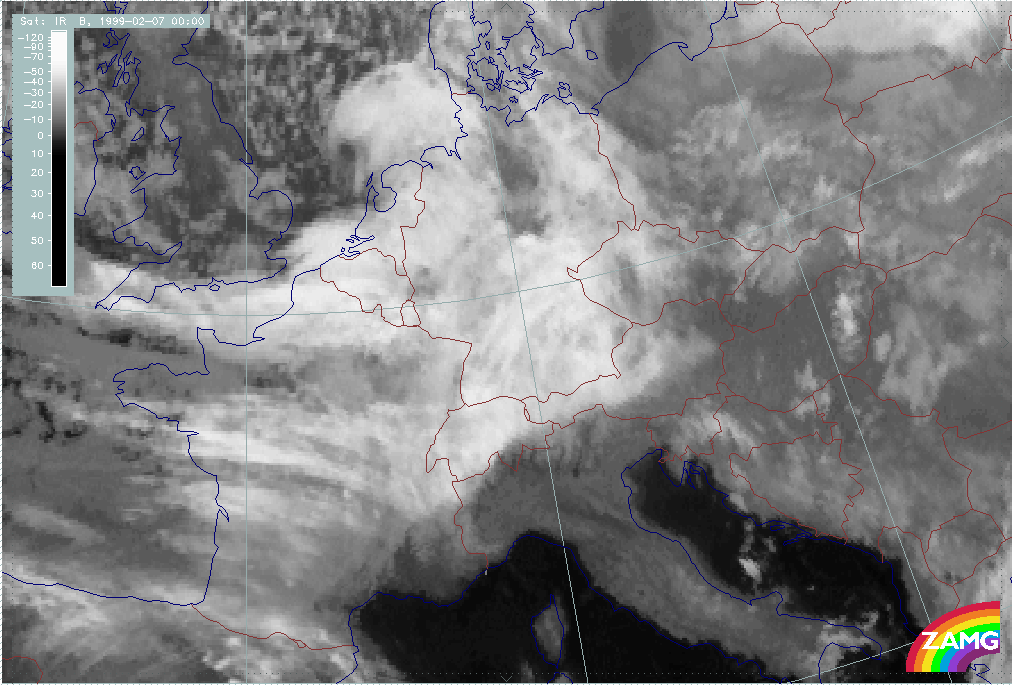
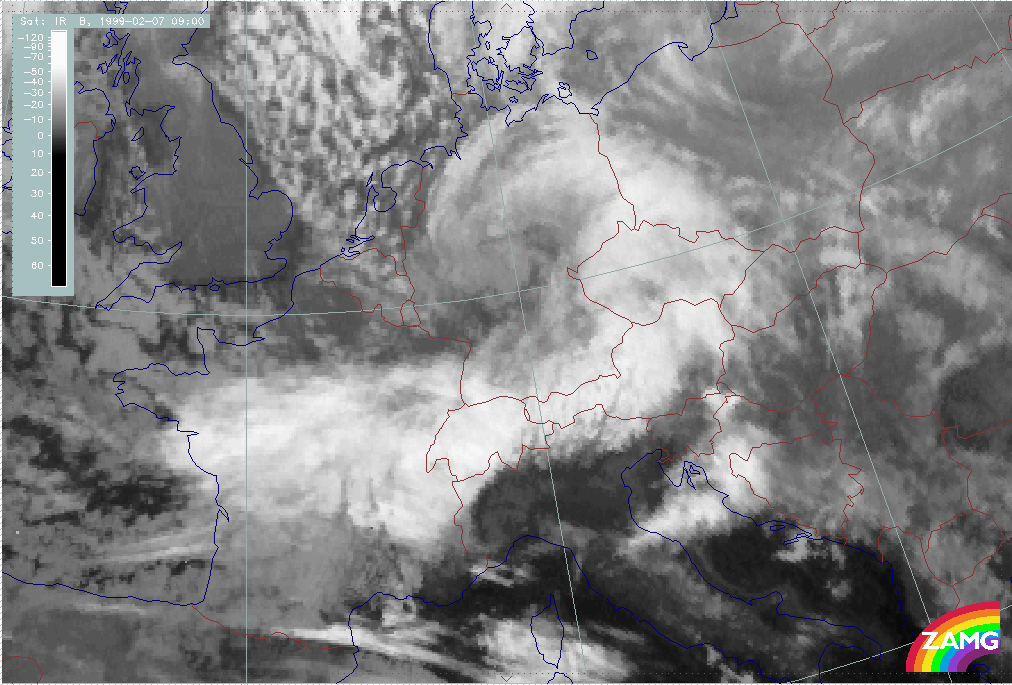
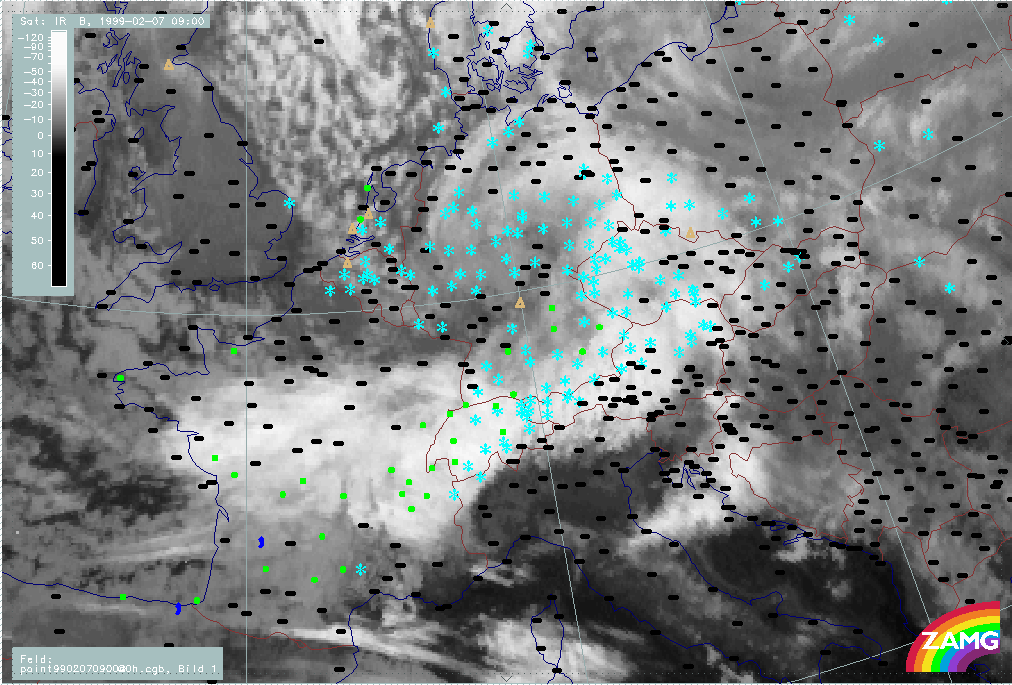
- From 07/00.00 UTC (ph204) onwards, the Stau Cloud changes insofar as the distinct southern boundary moves northward: Mountain chains in SE. Switzerland and S. Tyrol become cloud free and their snow cover becomes visible. This process continues until about 07/06.00 UTC (ph206), when Stau Cloud prevails only north of the mountain chain in Austria.
- There is also a tendency during this phase that Lee Cloud is produced over North Croatia moving into SW Hungary.
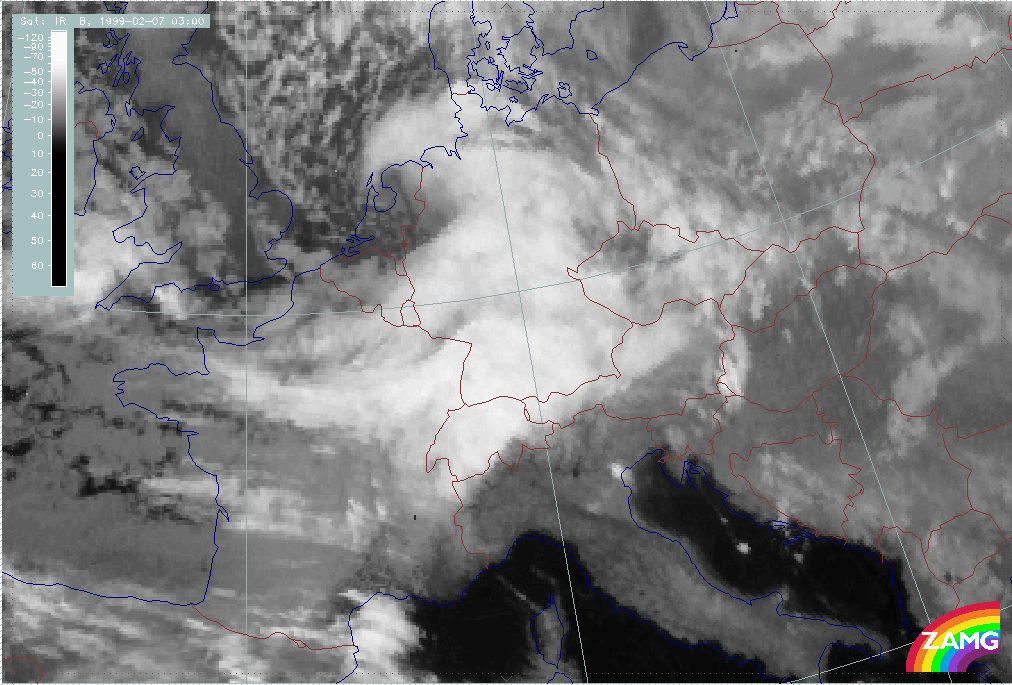
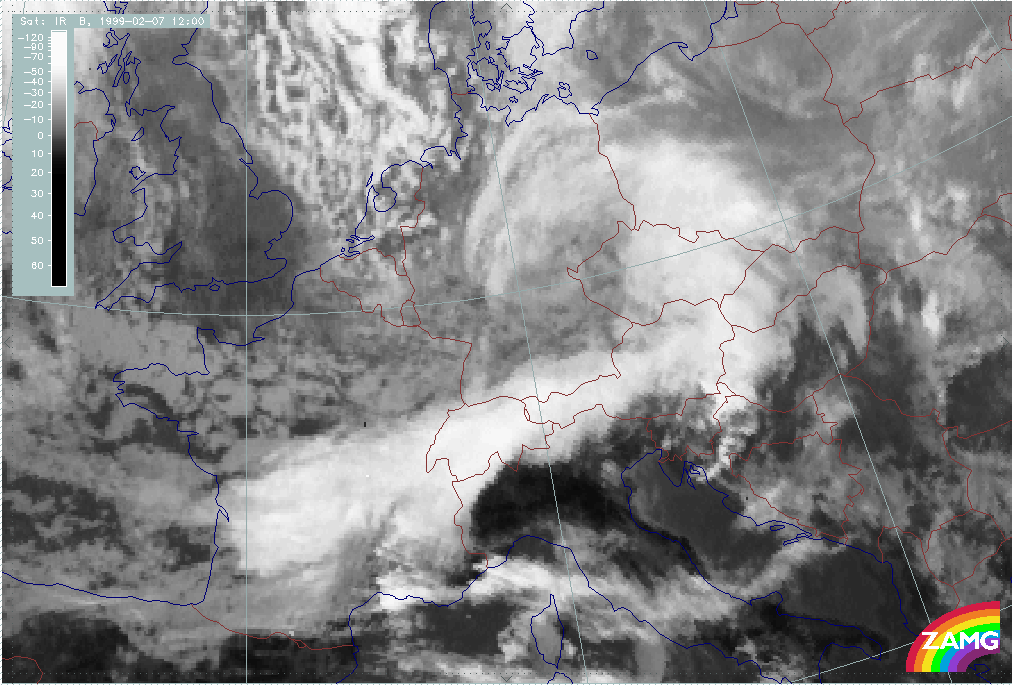
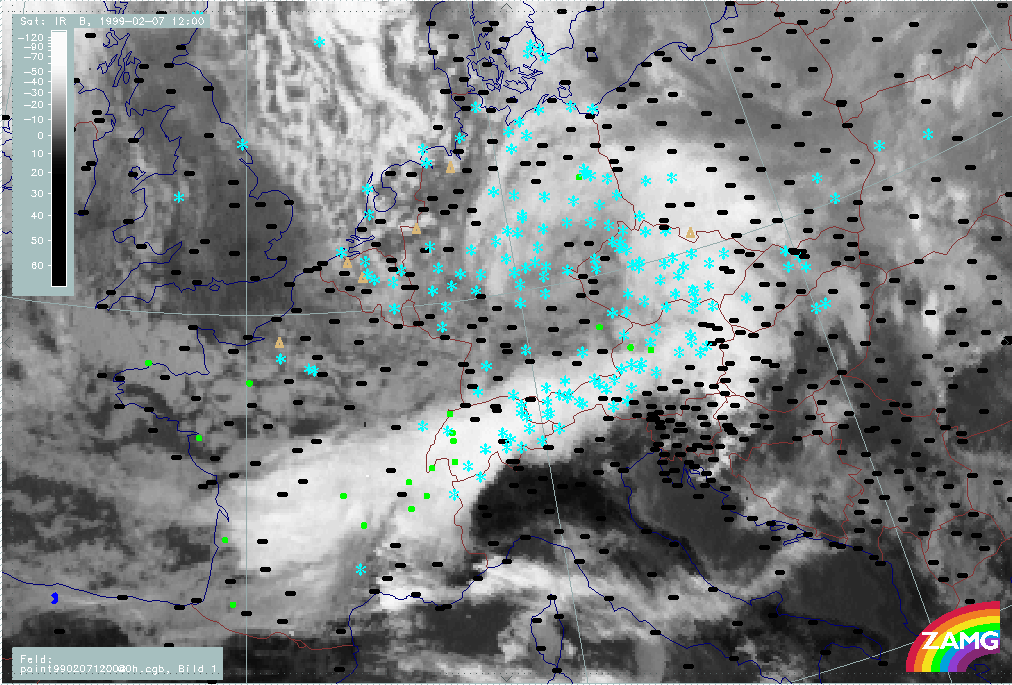
- At the same time, but especially from 07/06.00 UTC onwards, the approaching increased Comma (Cold Air Development CAD) forms a distinct cloud band north of the Alps which covers the Alps at 12.00 UTC (ph208).
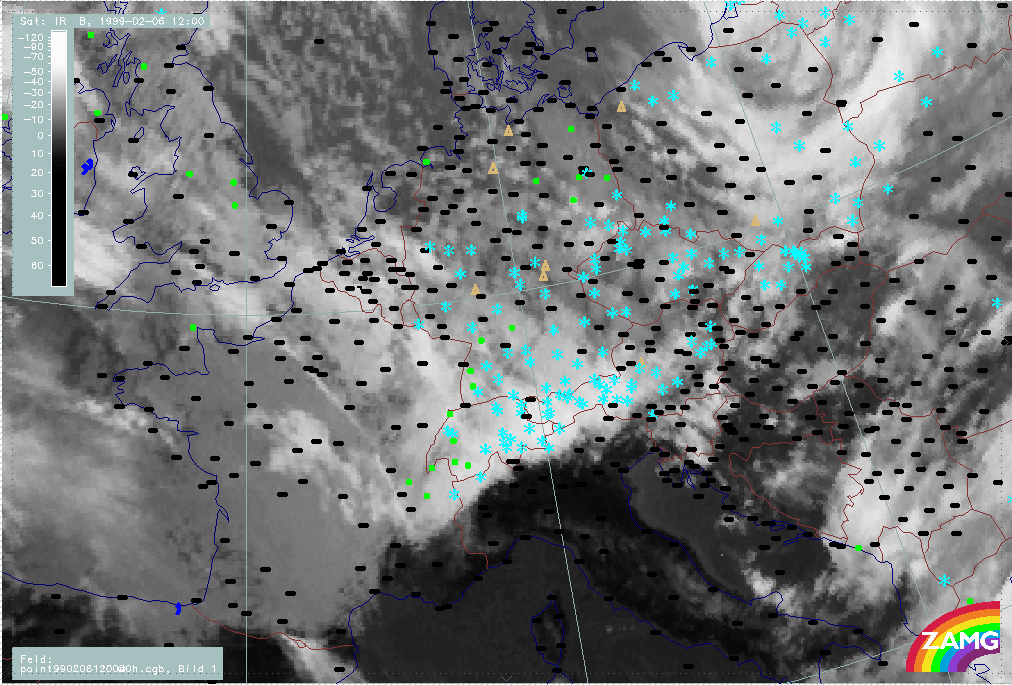
- During this phase Stau Cloud can only be observed over the W. Alps with a distinct south-eastern boundary extending quite far into NW. Italy.
- At the same time high Lee Cloudiness has developed in two areas, one starting at the French Central Mountains and the second one at the French W. Alps.
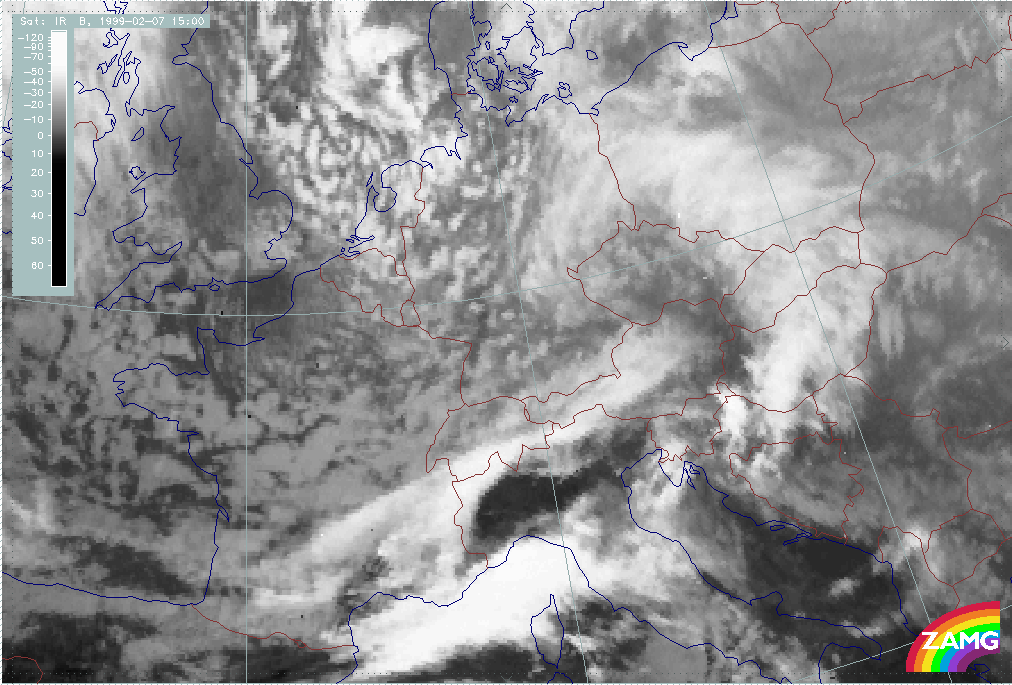
- A very interesting development takes place between 07/12.00 and 18.00 UTC (ph208 - ph210) with the passage of the Comma cloud band over the Alps. There seems to be a jump of the frontal
cloud band from a position over the Alps at 12.00 UTC to a position far south of the Alps (S. France - Corsica - Slovenia) at 18.00 UTC. Looking at a half hourly image sequence (not
shown here) one can see three main points:
- Cloudiness intensifies in the region of the Lee Cloud mentioned for 12.00 UTC, that means south of the Alps.
- Part of the cloud band remains over the Alpine mountain area but becomes lower in height
- A high level cloud feature seen very well at 07/15.00 UTC (ph209) over the highest mountain chain moves across the Alps and merges with the intensified cloud area south of the Alps.
- Synoptically, the most interesting is the first (a.), describing the intensification of cloudiness south of the Alps. This is an effect which can be observed frequently and might be explained by a pre-upper level front which either develops south of the Alps, or is moved across the mountains by the faster upper level flow.
|
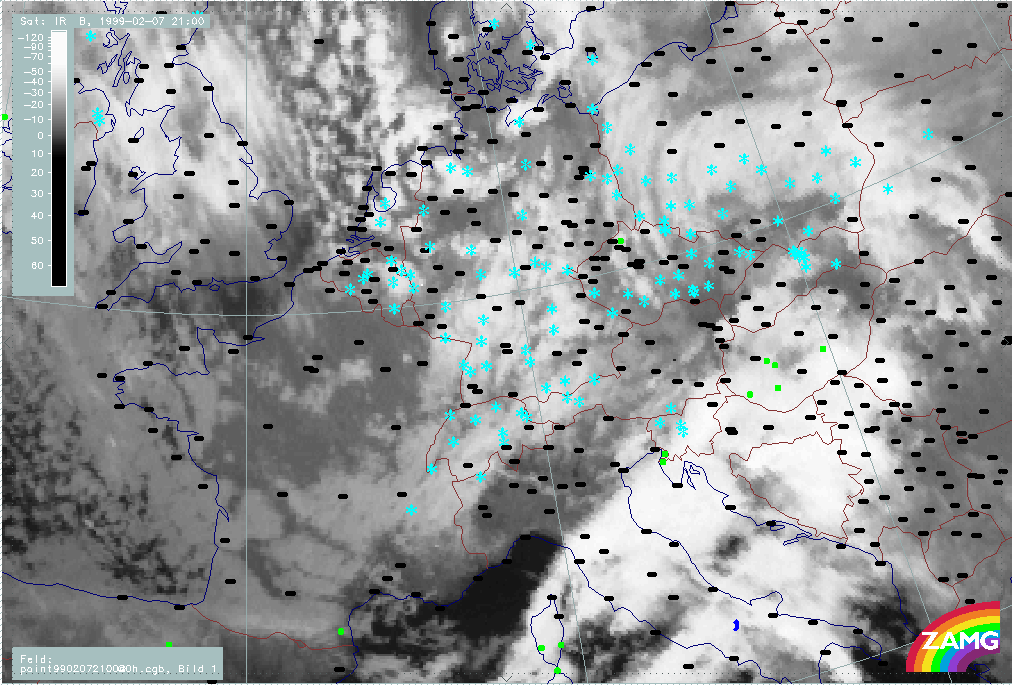
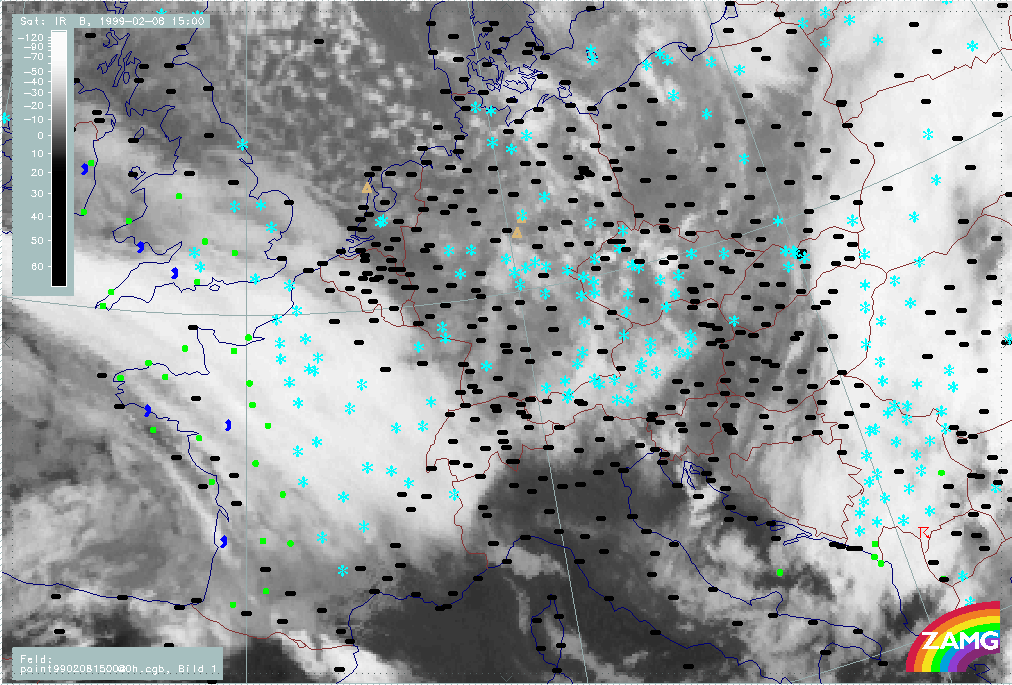
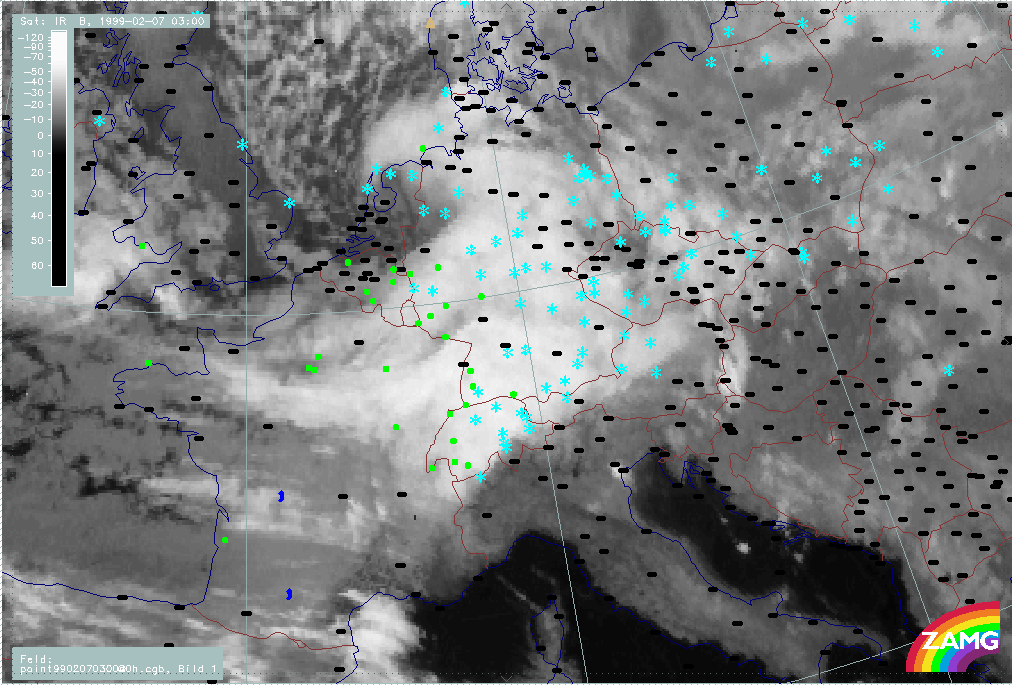
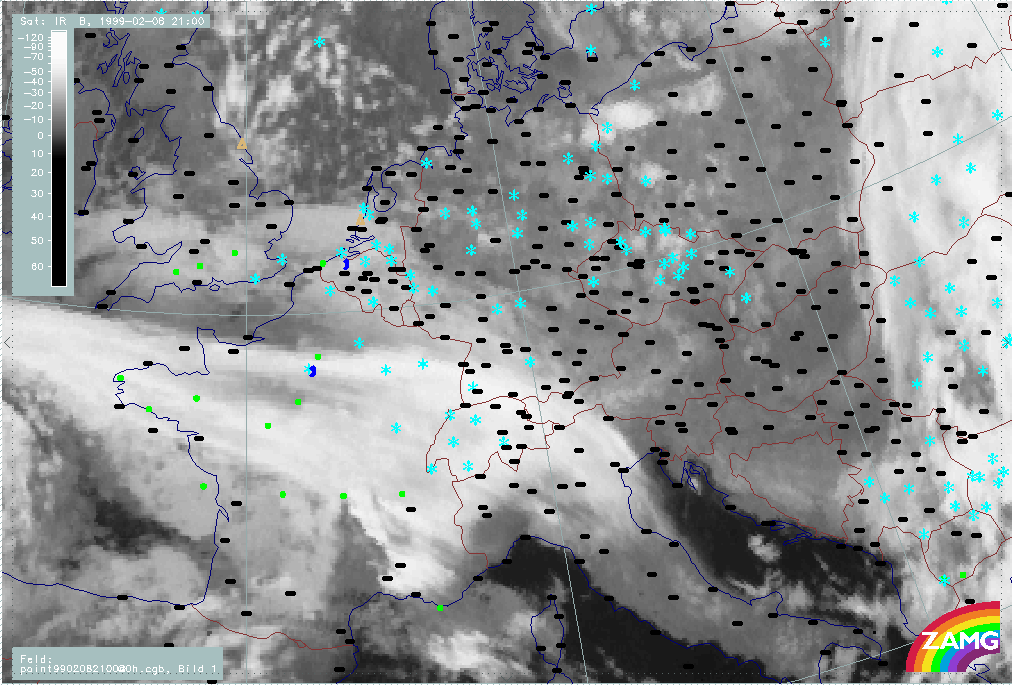
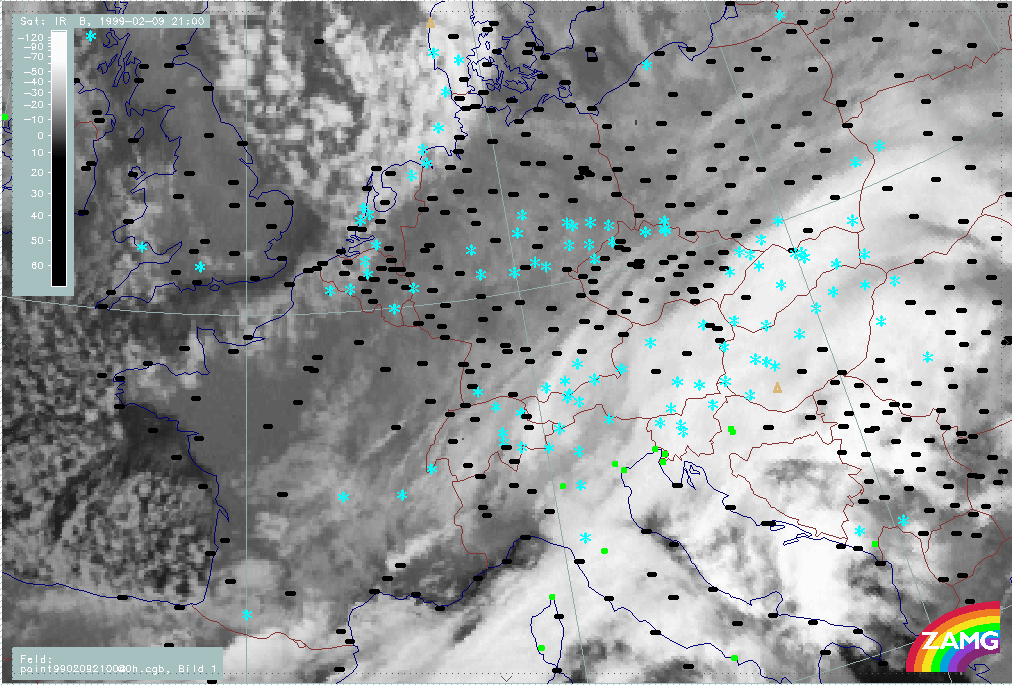
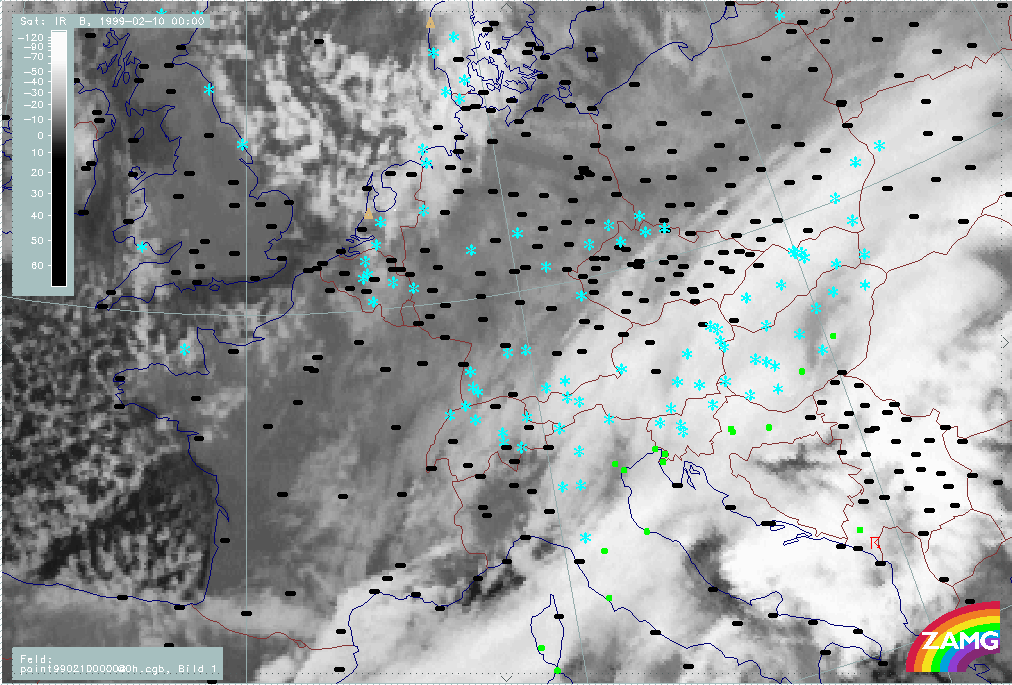
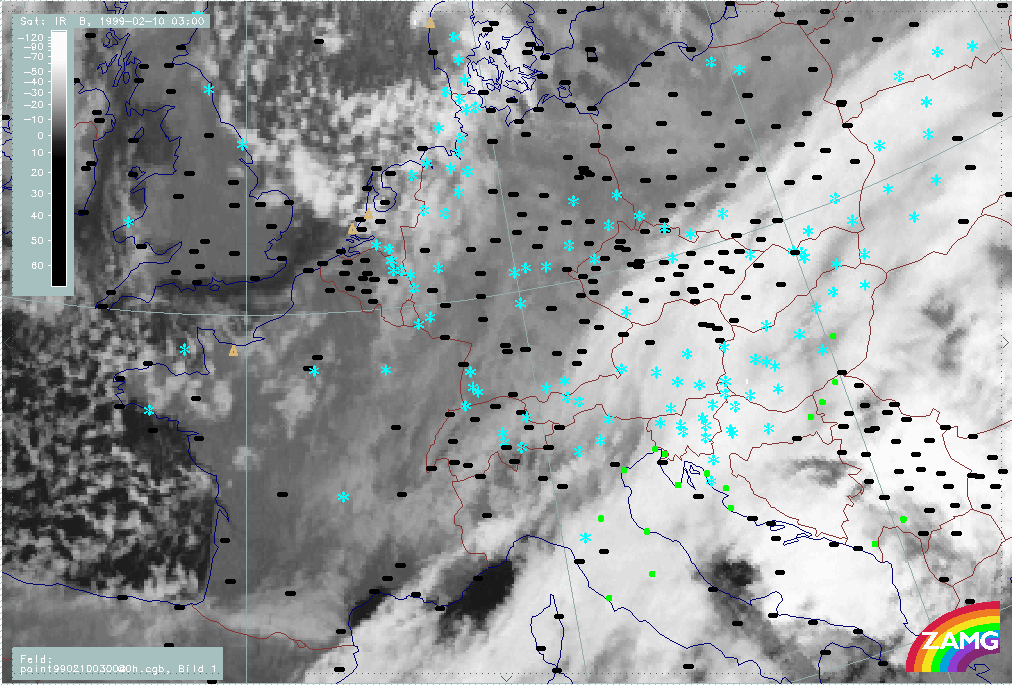
06 February 1999/15.00 UTC - Meteosat IR image; weather events (green: rain and showers, blue: drizzle, cyan: snow, red: thunderstorm with precipitation, purple: freezing rain, orange:
hail, black: no actual precipitation or thunderstorm with precipitation); 06/15.00 - 07/18.00 UTC 3-hourly image loop
|
|
The following points can be summarized:
- There is precipitation within, north and north-west of the Alpine region during the whole phase.
- Over Austria and Bavaria snow prevails but over Switzerland and especially over W. Switzerland there is rain till at least 07/09.00 UTC
- At 07/09.00 UTC, high cloudiness increases over the southern areas of Austria associated with the approaching Comma; but it is not prouducing precipitation; snow still is only reported from the Stau Cloud areas;
- There are no precipitation reports in the area of the newly developed cloud band south of the Alps at 07/15.00 UTC.
|
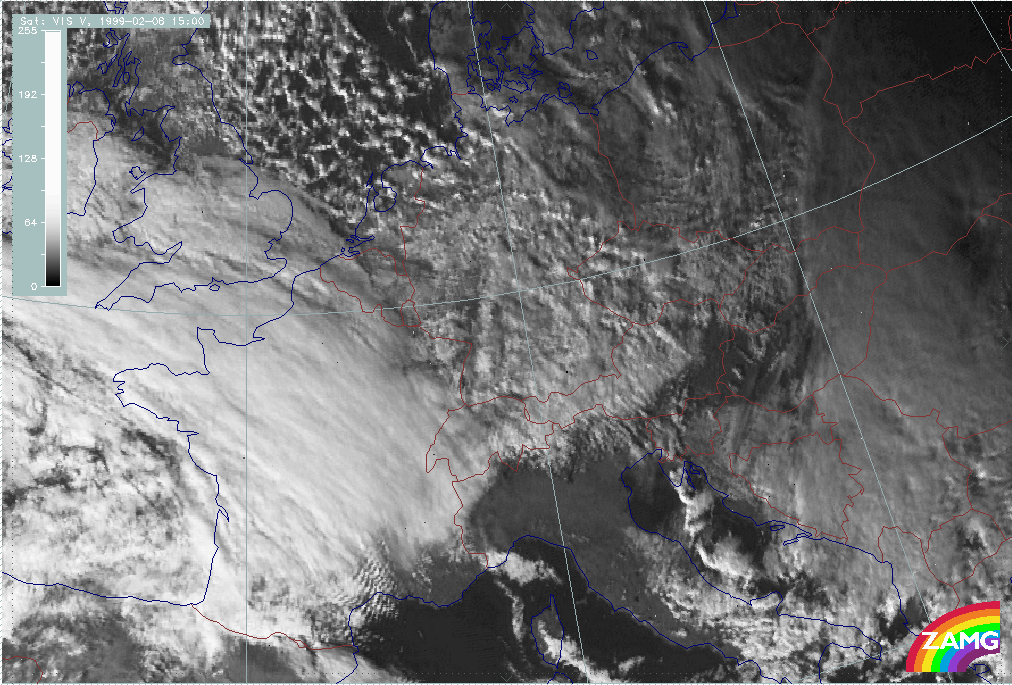
06 February 1999/15.00 UTC - Meteosat VIS image; 06/15.00 - 07/15.00 UTC 3-hourly image loop
|
|
The most interesting feature in the VIS images from 07/09.00 to 15.00 UTC relates to the crossing of the Comma cloud band (features looking like a jump of frontal cloudiness):
- Dramatic development of cloudiness south of the Alps in the area of the Lee Cloud between 12.00 and 15.00 UTC (ph208 - ph209)
- Southward moving high cloud boundary over the Apine region between 12.00 and 15.00 UTC (especially distinct over Switzerland)
For a detailed example see: Comma feature (Cold Air Development CAD)
Phase 3: 08 February/00.00 - 08 February/12.00 UTC
This phase is characterised by:
- Thickness trough
- Non frontal conditions
- CA dominates
- Main cloud features: Stau features (approaching WF from W)
|
07 February 1999/21.00 UTC - Meteosat IR image; 07/21.00 - 08/12.00 UTC 3-hourly image loop
|
|
In summary, the following can be noted:
- Stau Cloud features are not very distinct at the beginning of this phase (ph301: 07/21.00 UTC).
- There are clouds north of the Alps extending far into Germany at the beginning of this phase.
- From 08/09.00 UTC (ph305) on, Stau Cloud features become more distinct and intensive over the W. Alps; such an effect goes hand in hand with the approach of Warm Front cloudiness.
- Intensification of Stau Cloudiness together with approaching synoptic scale cloudiness can be observed frequently during this case study.
|
07 February 1999/21.00 UTC - Meteosat IR image; weather events (green: rain and showers, blue: drizzle, cyan: snow, red: thunderstorm with precipitation, purple: freezing rain, orange:
hail, black: no actual precipitation or thunderstorm with precipitation); 07/21.00 - 08/12.00 UTC 3-hourly image loop
|
|
In summary, the following can be noted:
- Snow reports are widespread within the Alpine region.
- Snow reports are also widespread north of the Alps over Germany.
|
08 February 1999/09.00 UTC - Meteosat VIS image; 08/09.00 - 08/12.00 UTC 3-hourly image loop
|
|
- Cloudfree snow-covered mountain ranges over N. Italy very pronounced
- Boundaries of higher cloud fields in connection with synoptic scale Warm Front cloud over the W. Alps very distinct, especially at 08/09.00 UTC
For a detailed example see: Thickness trough
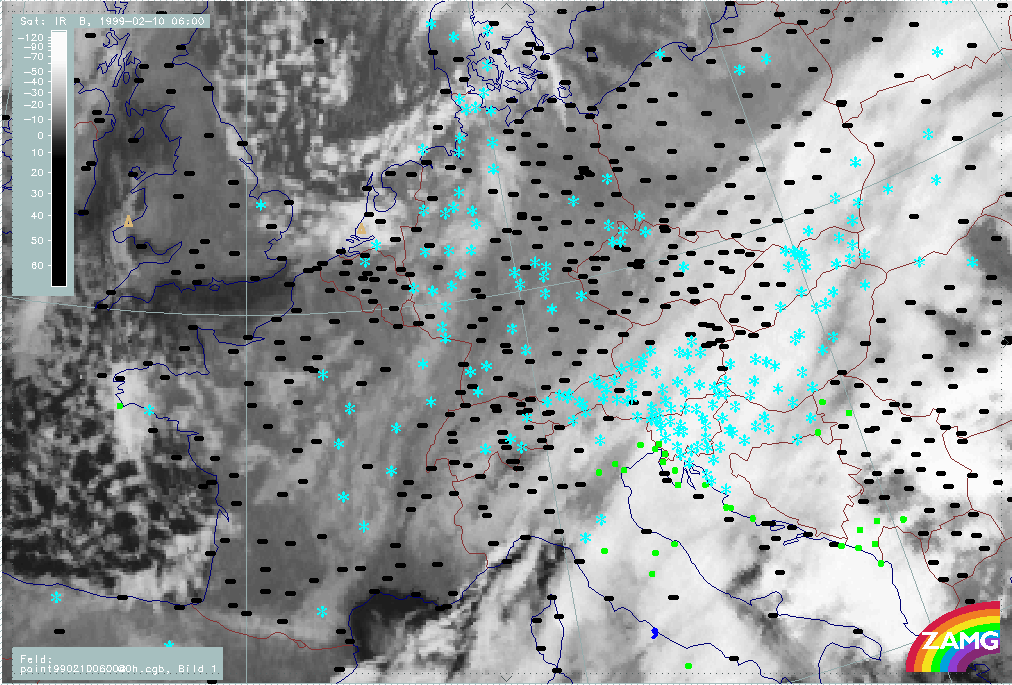
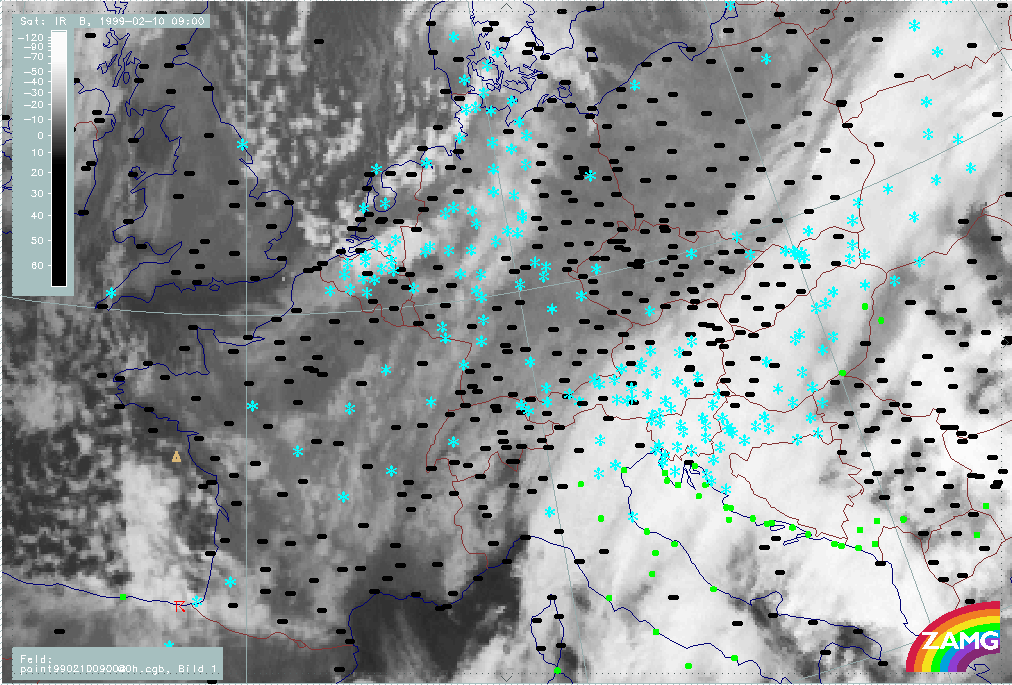
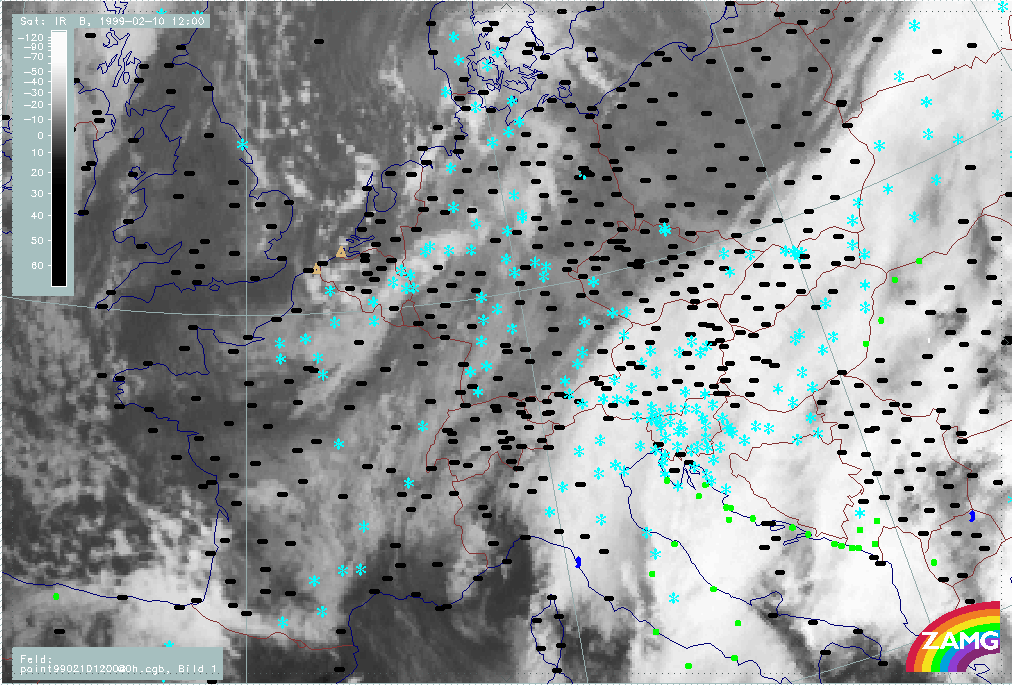
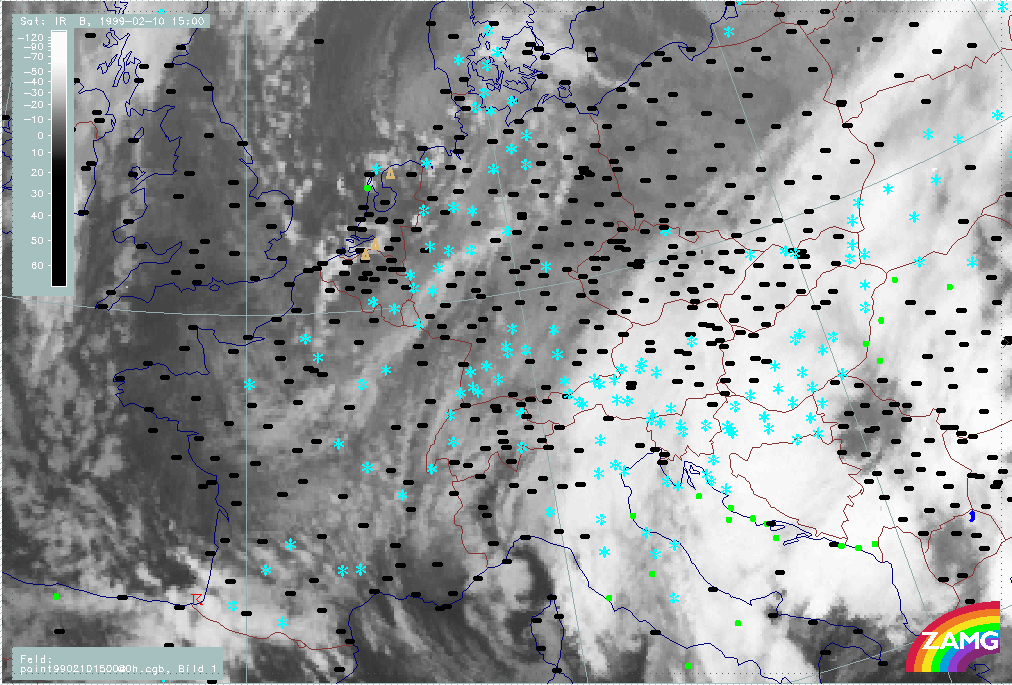
Phase 4: 08 February/18.00 - 10 February/18.00 UTC
This phase is characterised by:
- Sequence of crossing frontal systems:
- Warm Front
- Cold Front
- Wave formation south of Alps
- Main cloud features: Stau at W. Alps, Lee clearing after Cold Front passage
|
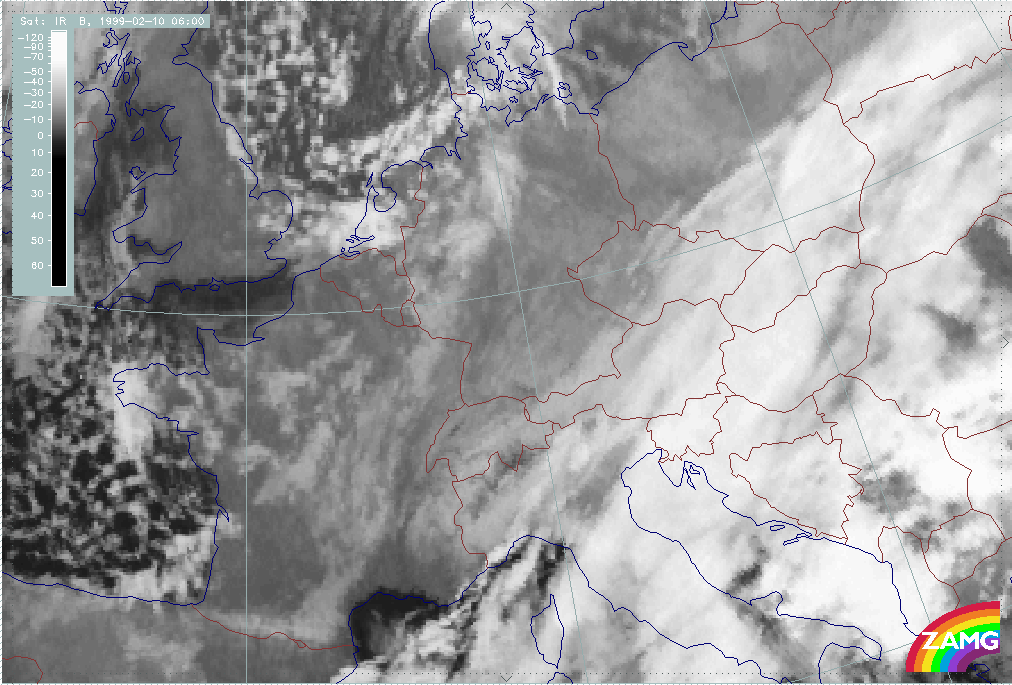
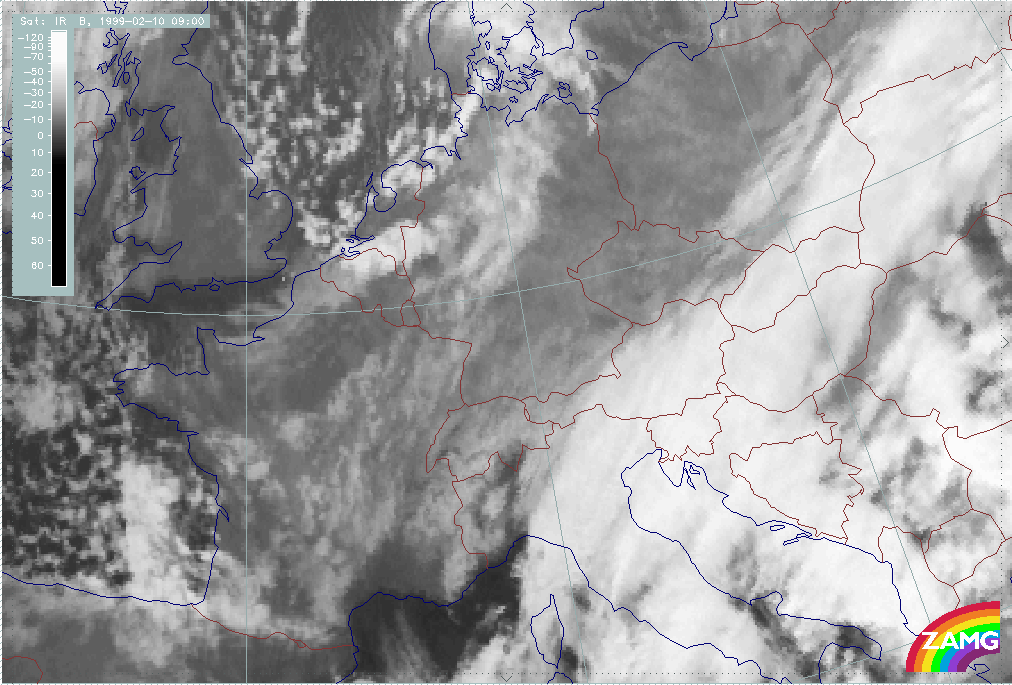
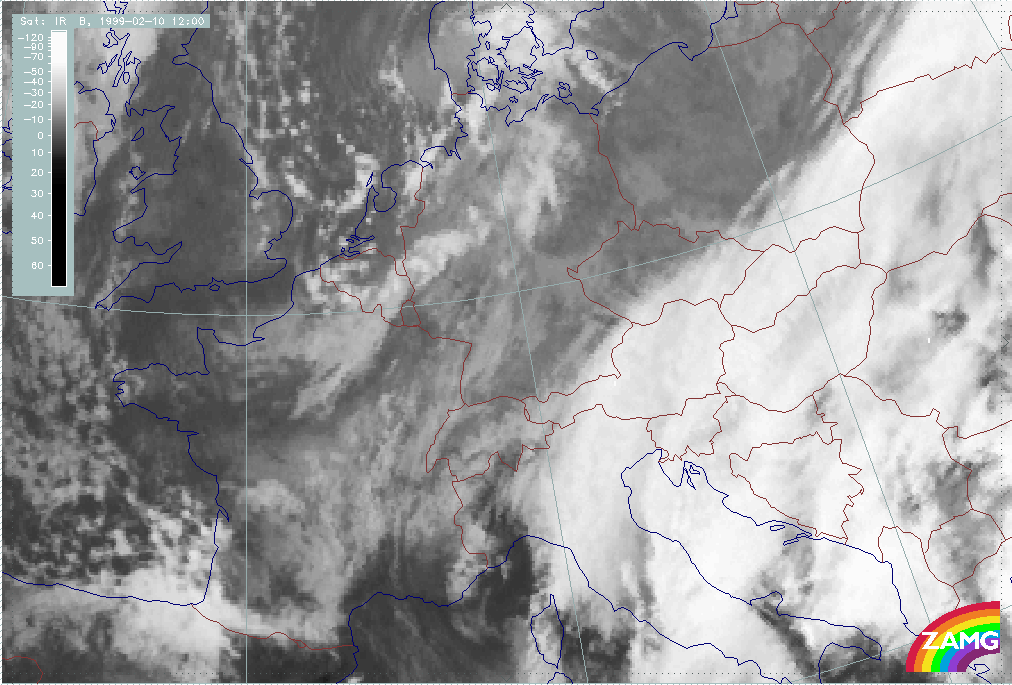
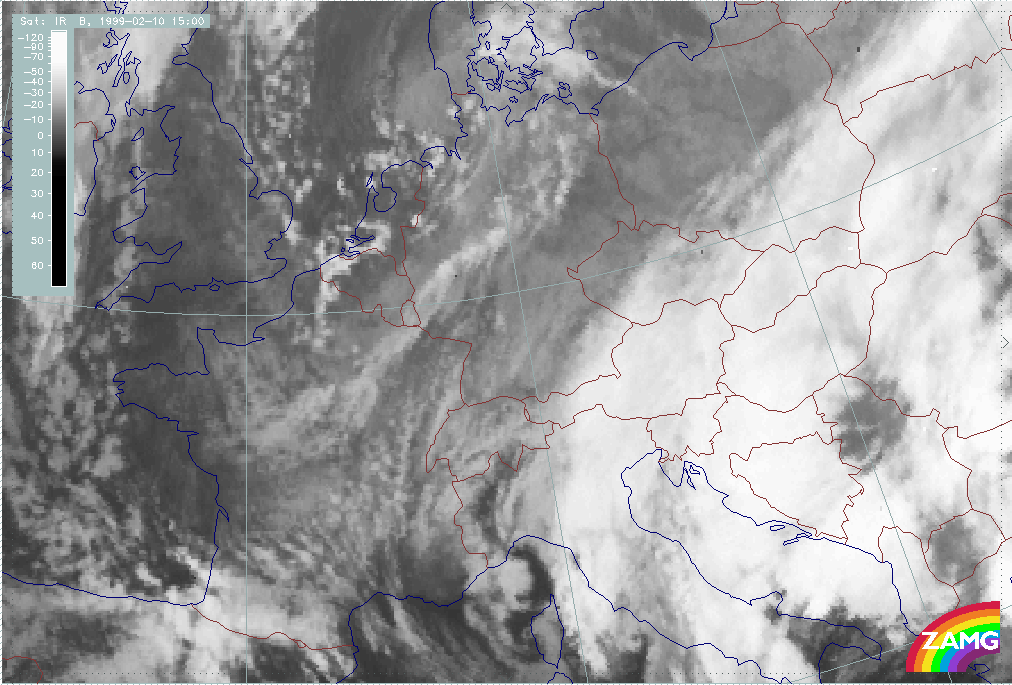
08 February 1999/15.00 UTC - Meteosat IR image; 08/15.00 - 10/18.00 UTC 3-hourly image loop
|
|
The complete phase can be divided in three sub-phases representing different synoptic conditions:
1. Warm Front passage (08/18.00 - 09/06.00 UTC)
In summary, the following can be noted:
- Between 08/15.00 UTC to 09/06.00 UTC, a Warm Front Band moves from France across the W. Alps further eastward until it covers the whole of Austria and even parts of W. Hungary; at the end of this phase the Warm Front cloud in Austria ends abruptly at the northern boundary of the Alps.
- Sub-structures within the Warm Front cloud can be observed, especially the parallel fibres oriented perpendicular to the Alps. For this phenomenon lee waves have been mentioned as a possible explanation. At 09/12.00 UTC (ph408), a single fibre extends from the highest tops in Austria ("Hohe Tauern") eastward into E. Hungary. As the upper level stream is westerly, Lee Clouds might be a reasonable explanation here as well.
- Cloudiness crosses the Alpine mountains and reaches quite far into Italy, especially at the eastern leading edge of the cloud shield - a cloud feature very similar to those observed with Detached Warm Fronts.
- Between 09/00.00 UTC and 09/06.00 UTC, intensive Stau develops at the W. Alps (France and Switzerland) which is a location to the rear of the Warm Front cloud but in front of the approaching Cold Front.
- At 09/09.00 UTC, Cold Front cloudiness has approached the W. Alps and Stau Cloud is hidden within a more extended cloud field.
2. Cold Front passage (09/12.00 - 09/18.00 UTC)
In summary, the following can be noted:
- At 09/12.00 UTC, the Cold Front cloud band has reached the W. Alps and later (between 12.00 and 15.00 UTC) propagates into N. Italy.
- At 09/18.00 UTC (ph410) some remarkable cloud configurations appear:
- The Cold Front cloud band which is south of the Alps over Italy
- A remarkable cloud free part in the lee of the W. Alps over N. Italy called "Lee clearing"
- An Occlusion - like cloud band extending from the E. Alps over Bavaria to the W. Alps
- The 1/2 hourly detailed image sequence (not shown here) shows that there is already some "Lee clearing" between 13.30 and 15.00 UTC and pronounced Lee clearing from 15.00 UTC on.
- The Occlusion - like cloud band is definitely not an Occlusion but a substructure in the Cold Front cloud band which is held back in the Alpine mountains and probably increased by Stau effects.
- In the 1/2 hourly detailed image sequence the remainder of this band moves eastward from 18.30 to Tyrol.
- There are very pronounced high Lee Clouds over the Apennine and the mountains in Bosnia and Yugoslavia at 09/12.00 UTC (ph408).
3. Wave development south of the Alps (10/00.00 - 18.00 UTC)
In summary, the following can be noted:
- There is an indication of a small Wave between 10/00.00 and 03.00 UTC over N. Italy and Tyrol; but instead of a further increase in cloud, at 06.00 UTC (ph414) dissipation takes place in this area.
- At 10/09.00 UTC, a new indication for a Wave formation can be observed close to Corsica.
- Rapid development of Wave formation and of a Cold Conveyor Belt (CCB) Occlusion takes place during the next hours.
- In the end the CCB Occlusion band is situated over Central and W. Austria while the Warm Front area affects E. Austria.
|
08 February 1999/15.00 UTC - Meteosat IR image; weather events (green: rain and showers, blue: drizzle, cyan: snow, red: thunderstorm with precipitation, purple: freezing rain, orange:
hail, black: no actual precipitation or thunderstorm with precipitation); 08/15.00 - 10/18.00 UTC 3-hourly image loop
|
|
The complete phase can be divided in three sub-phases representing different synoptic conditions:
1. Warm Front passage (08/18.00 - 09/06.00 UTC)
In summary, the following can be noted:
- Snow is approaching with the Warm Front cloud shield; rain appears only in the western and south-western parts over France.
- Until 09/00.00 UTC snowfall has covered the whole of Switzerland and moves very slowly eastward over Tyrol to Central Austria.
- The leading cloud shield over E. Austria remains precipitation free.
2. Cold Front passage (09/12.00 - 09/18.00 UTC)
In summary, the following can be noted:
- There is extended snowfall in the Alpine mountains and snowfall in the Cold Front cloud band to the south of the Alps.
- The Occlusion - like cloud band only consists of middle/high cloud without precipitation over the Czech Republic and Bavaria.
3. Wave development south of the Alps (10/00.00 - 18.00 UTC)
In summary, the following can be noted:
- There is intensive snow south-south-east and east of the Alps during the whole period.
- Snowfall becomes less over Switzerland, with even precipitation free periods, and also over the western parts of Austria.
|
08 February 1999/15.00 UTC - Meteosat VIS image;
|
|
The complete phase can be divided in three sub-phases representing different synoptic conditions:
1. Warm Front passage (08/18.00 - 09/06.00 UTC)
In summary, the following can be noted:
- The VIS image from 08/15.00 UTC (ph401v) shows the thick, well developed, Warm Front cloud band over France and the W. Alps.
- Very well developed small Lee Cloud bands can be observed over S. France in the lee of the French Central Massif range.
- Another Lee Cloud phenomenon over Carinthia and N. Italy is very interesting: parallel lines perpendicular to the Alpine mountain chain; those lines start at single high mountain and change somewhat in their width. This is very similar to ph111 over Slovenia - Croatia where the parallel lines perpendicular to the Alpine mountains also appear in advance of a Warm Front cloud band.
2. Cold Front passage (09/12.00 - 09/18.00 UTC)
In summary, the following can be noted:
- The VIS images from 09/12.00 and 15.00 UTC (ph408v - ph409v) show several areas of parallel Lee Cloud bands, especially over Italy and Bosnia. At 09/12.00 UTC VIS and IR images (ph408, ph408v) show Lee Cloud at two levels: parallel lines with warm tops are much clearer in the VIS image and high Lee Cloud fields with cold tops much clearer in the IR image.
- Parallel lines superimposed upon the Stau cloud in the W. Alps south of Switzerland can be identified more easily in the VIS image. There may be similarities to the situation over the French Central Massif (high lee fibres at single mountain massifs) and therefore a similar situation as already mentioned twice for an area south of the Alps (N. Italy, Slovenia, Croatia).
- Stau at the W. Alps and an increasing cloud free area to the lee of the W. Alps can also be observed.
3. Wave development south of the Alps (10/00.00 - 18.00 UTC)
In summary, the following can be noted:
- The VIS image shows the intensive thick cloud mass south and east of the Alps with a dense white cloud area.
- Snow structures in the W. Alps; lakes and valleys are visible and the snowline seems to be very low.
For a detailed example see: Comma feature (Cold Air Development CAD) and Detached Warm Front and subtypes
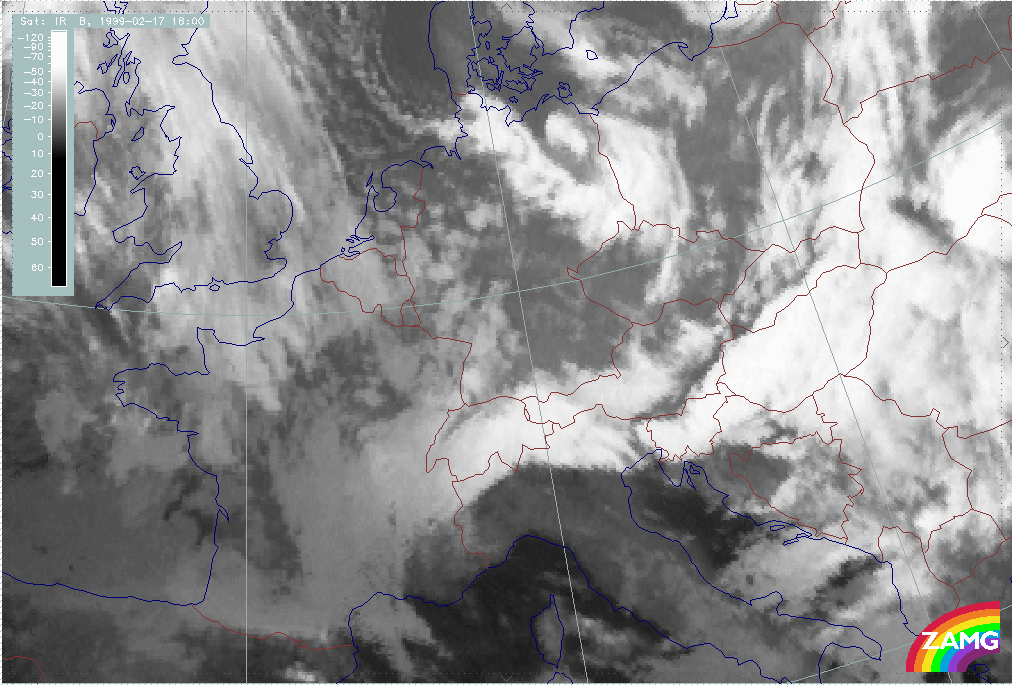
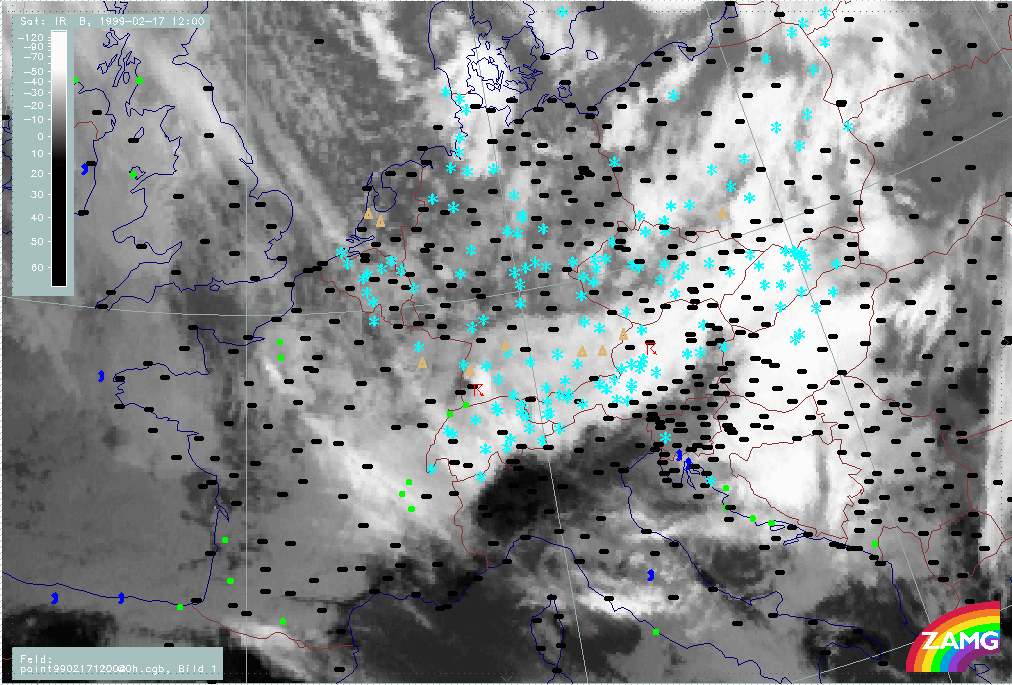
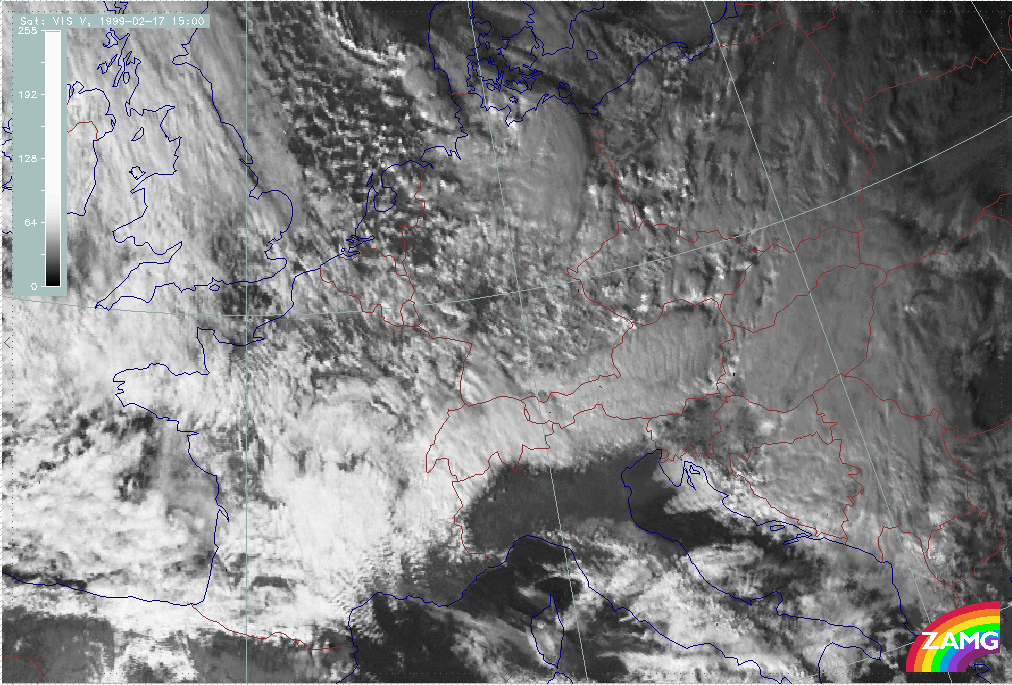
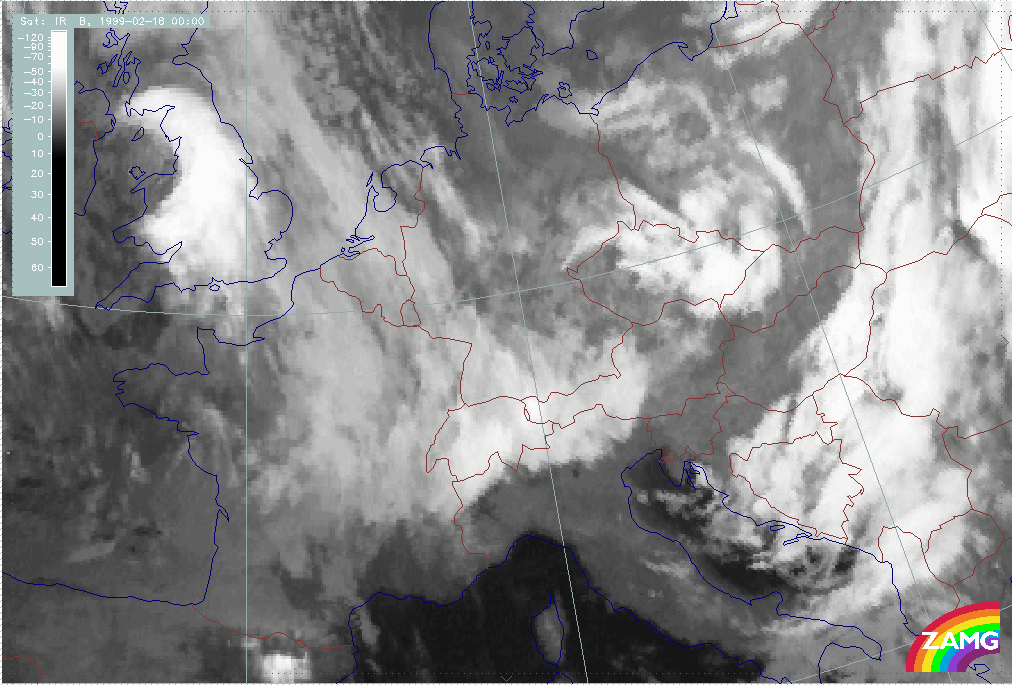
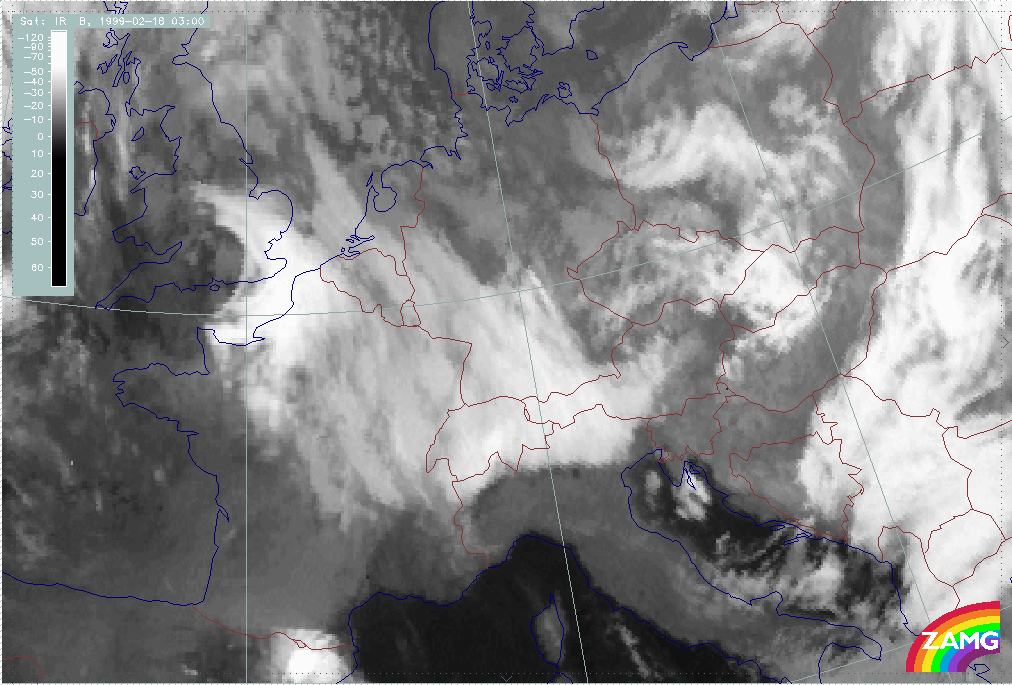
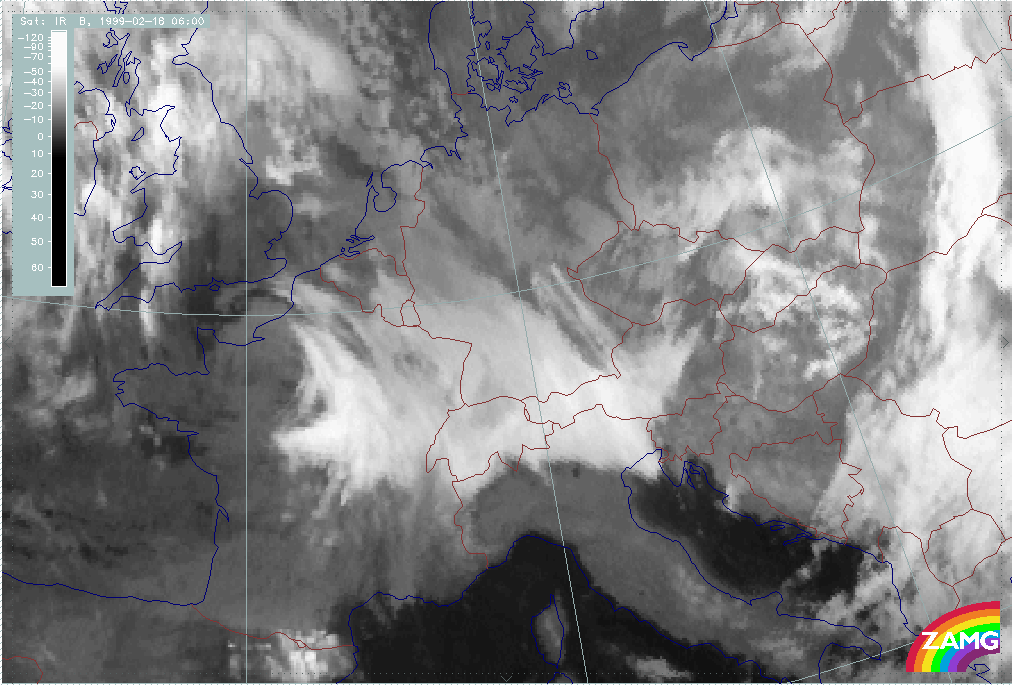
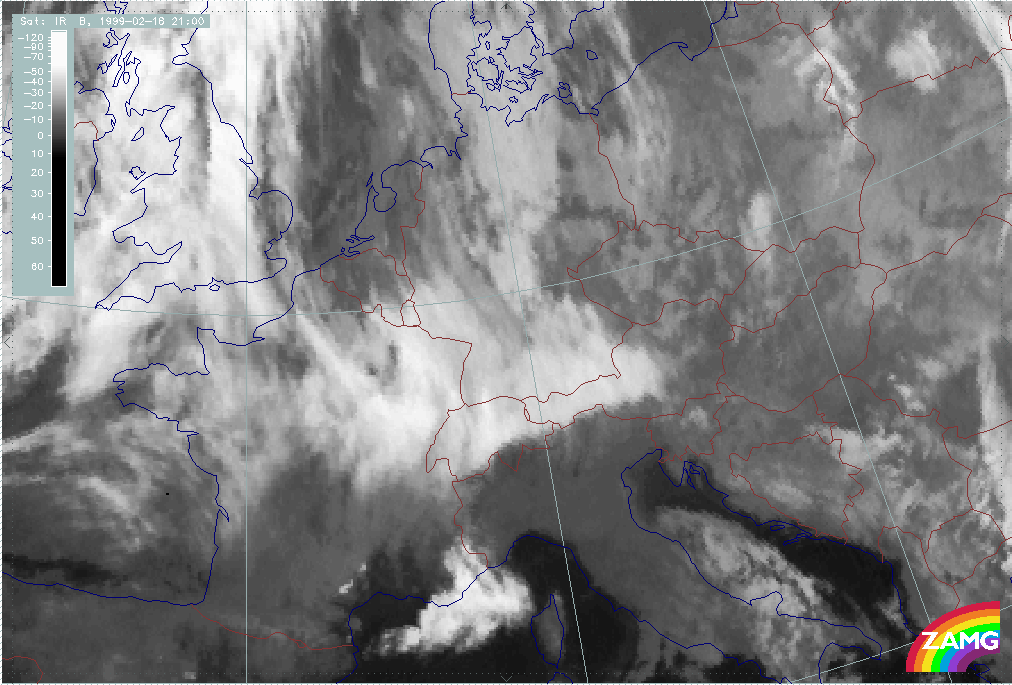
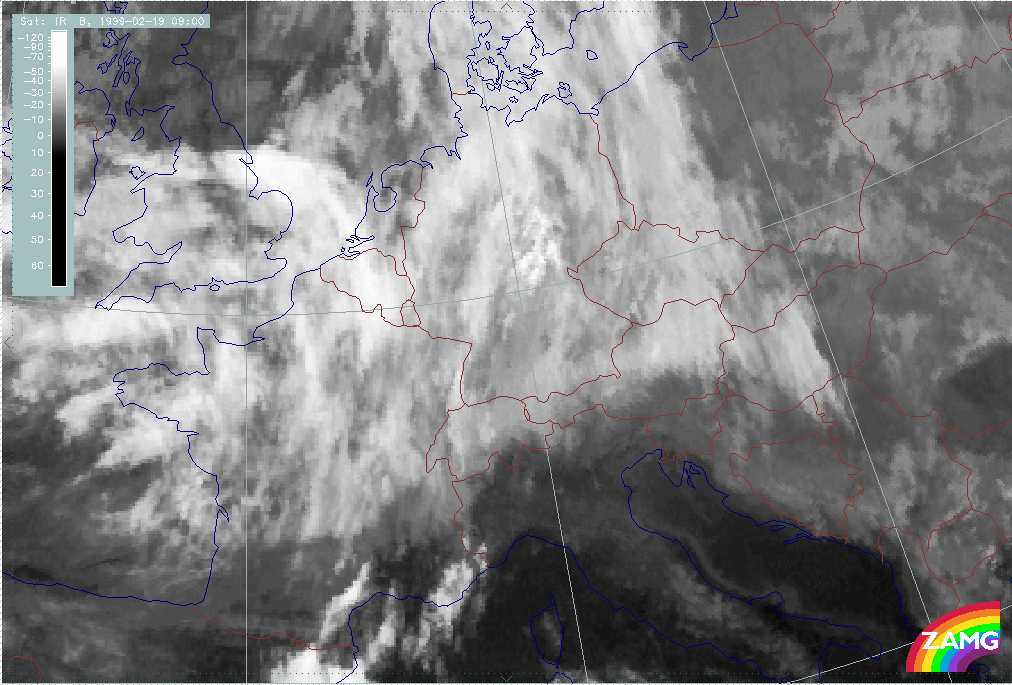
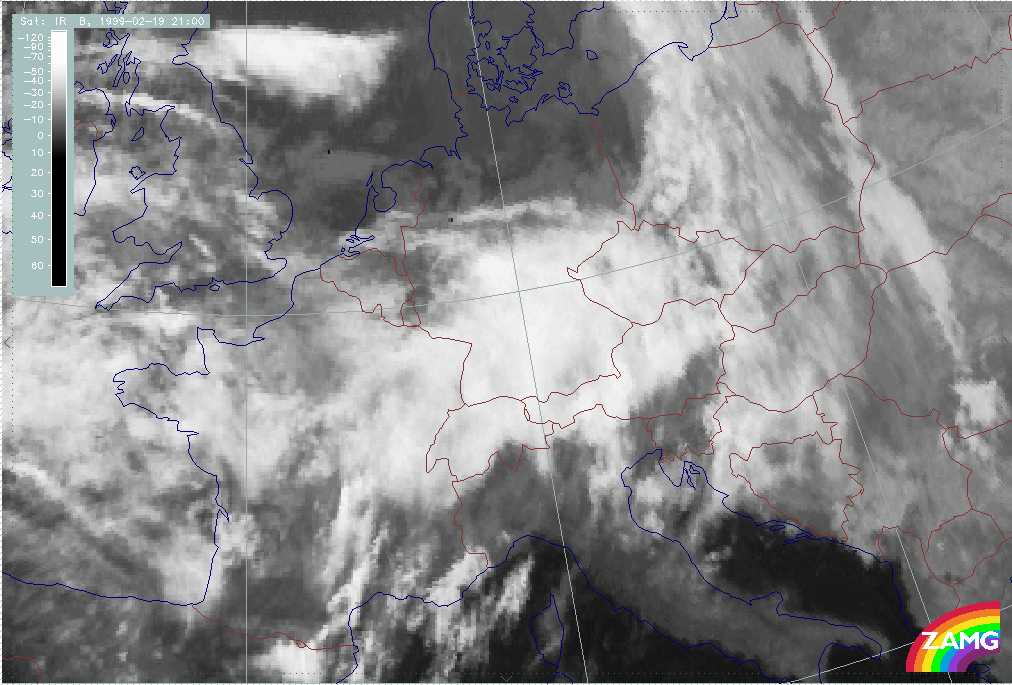
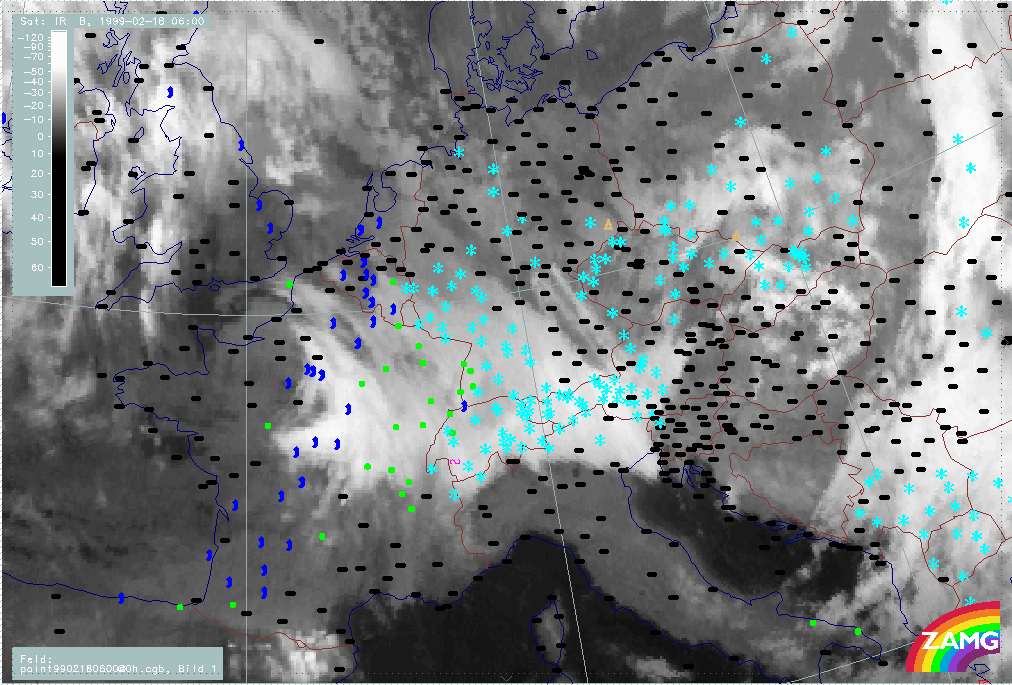
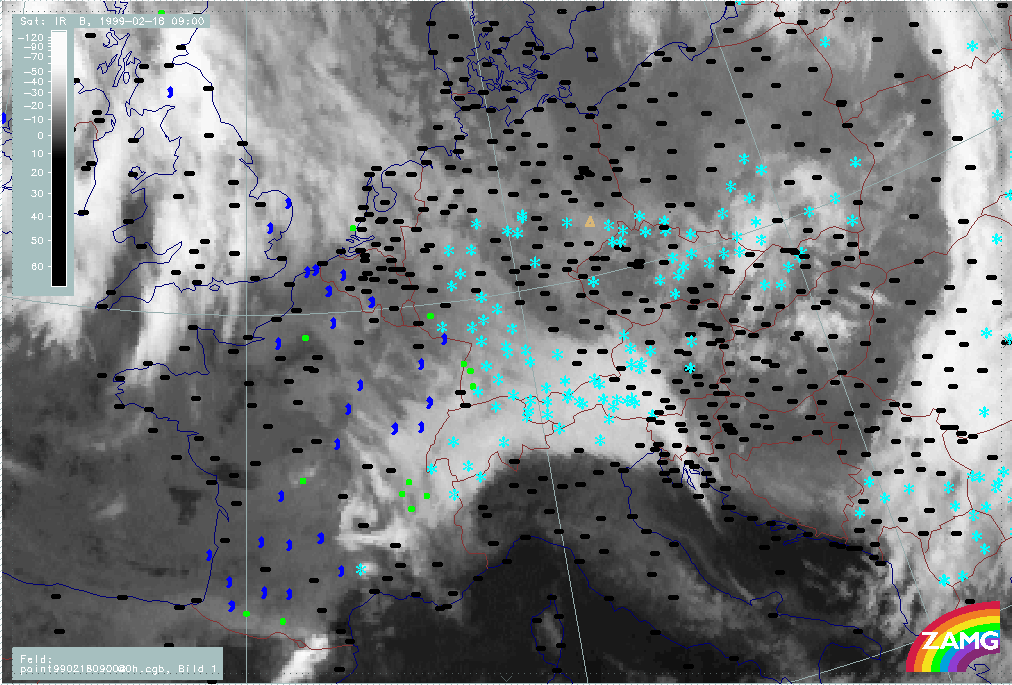
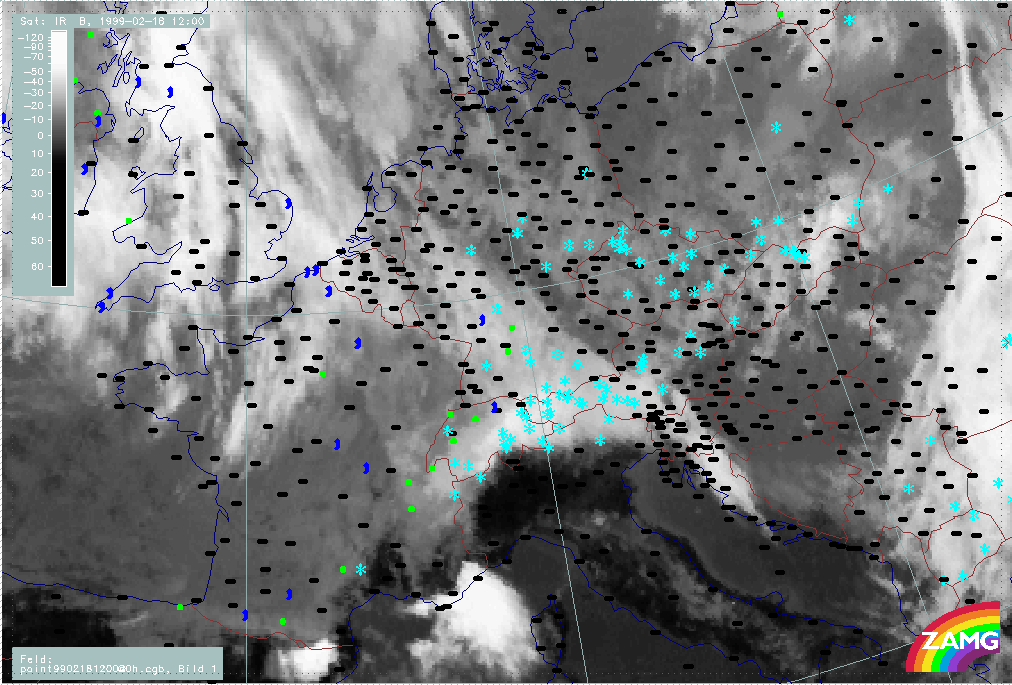
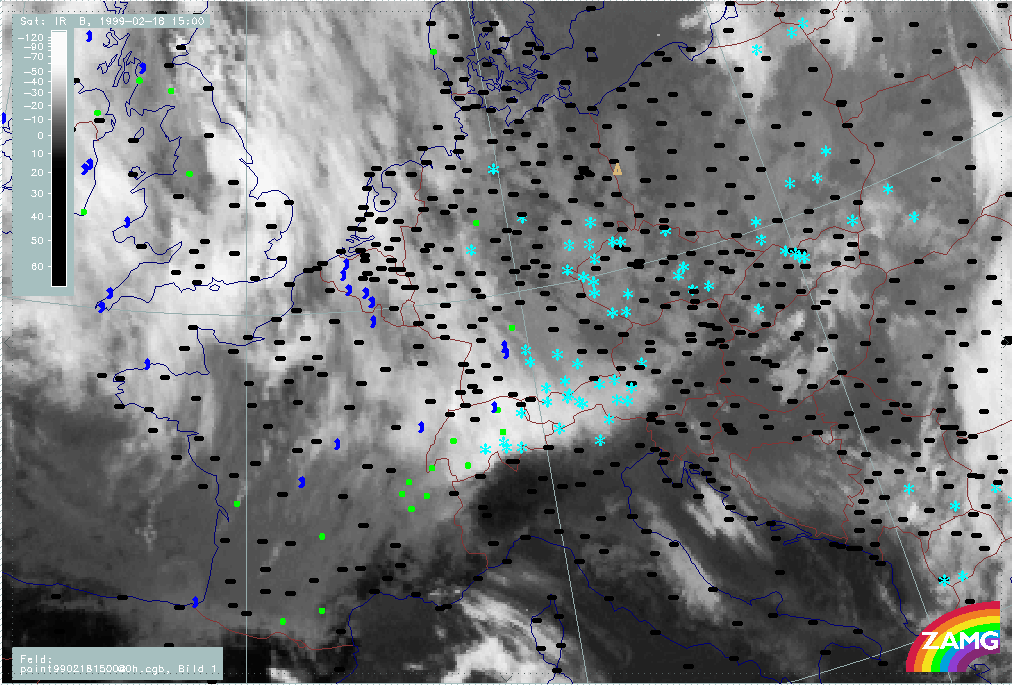
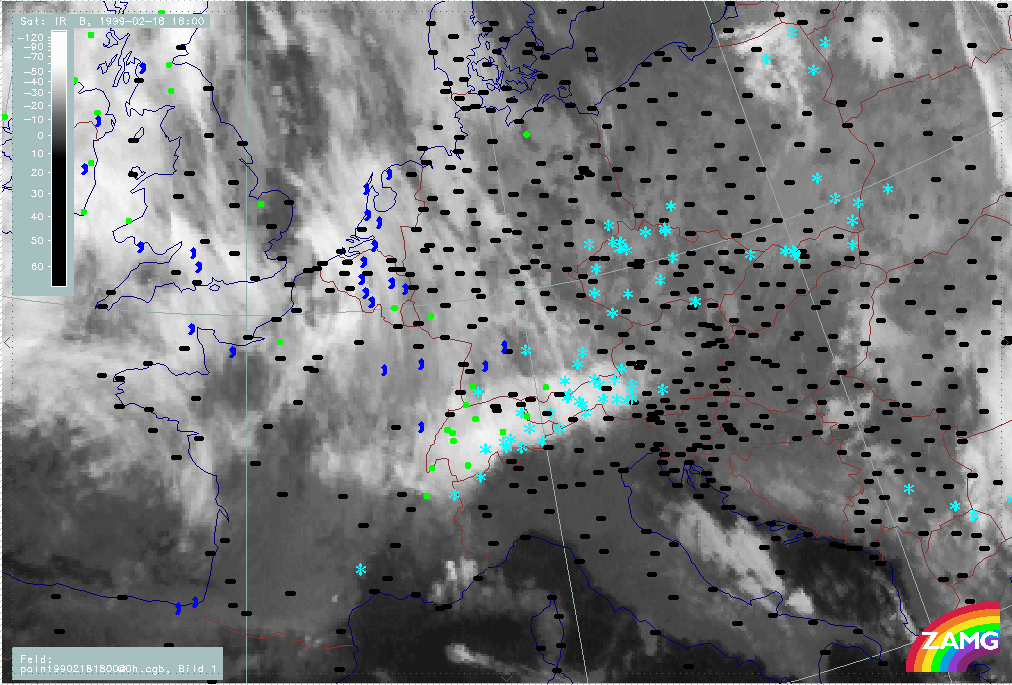
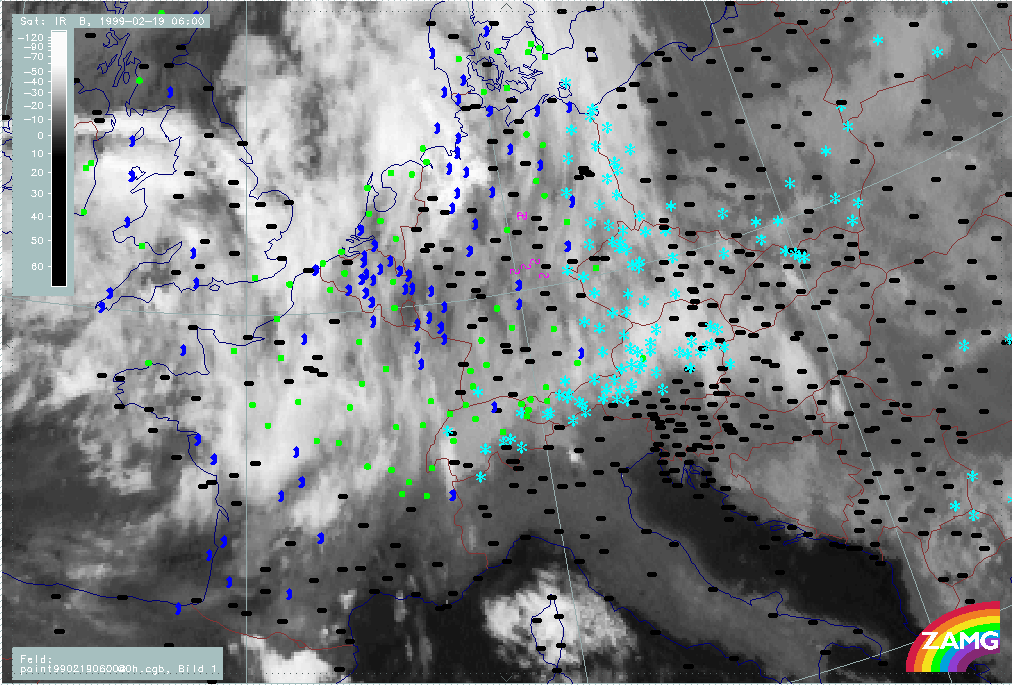
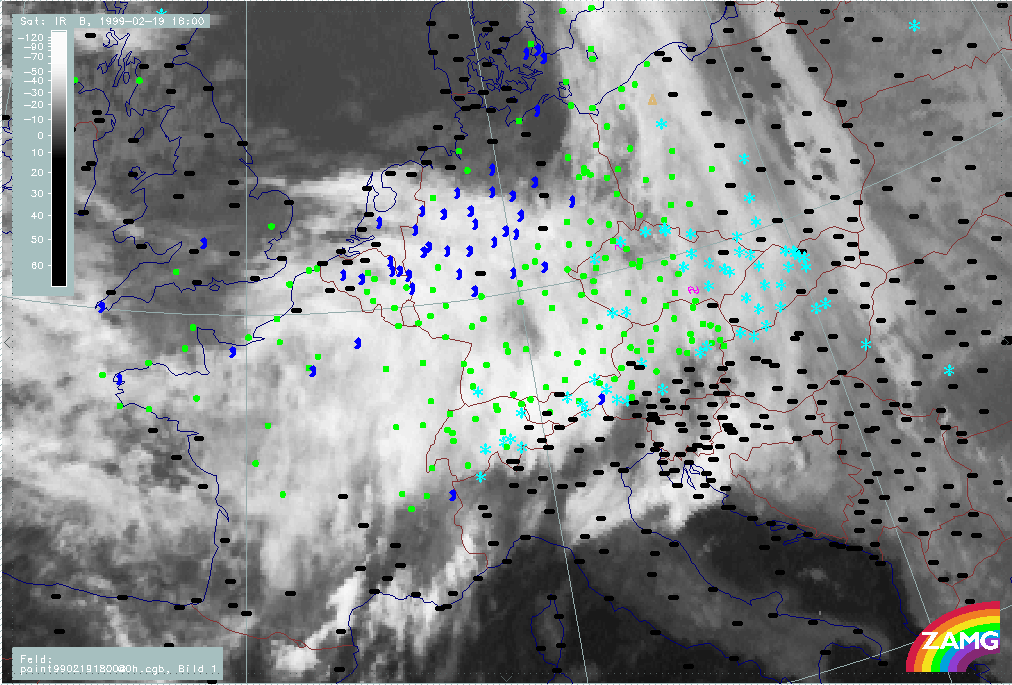
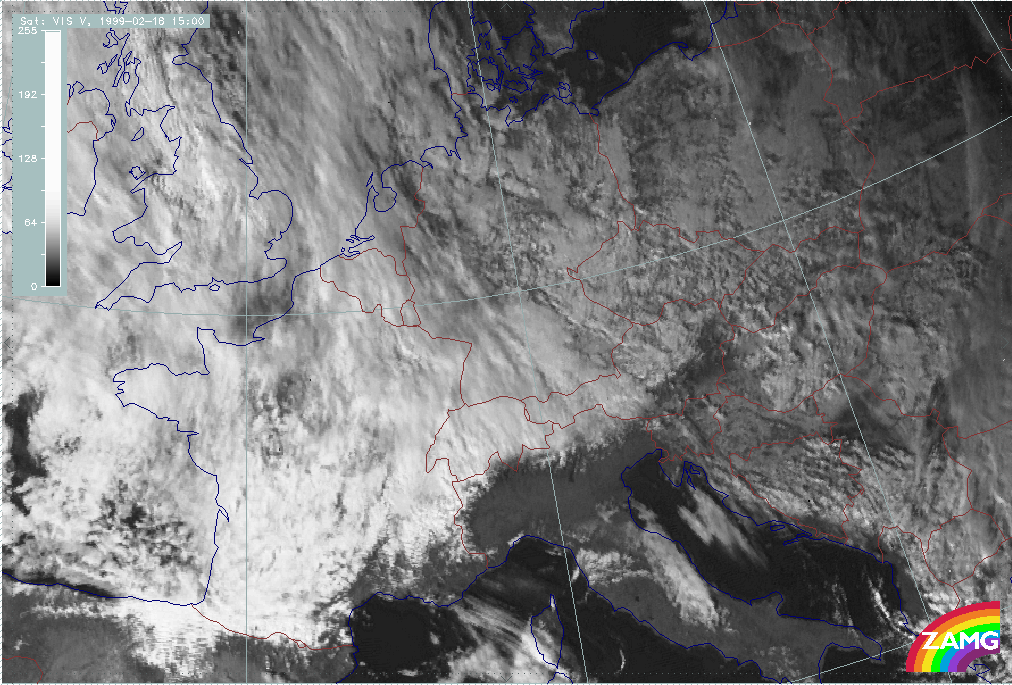
Phase 5: 17 February/00.00 - 17 February/18.00 UTC
This phase is characterised by:
- Crossing of Comma system
- Thickness gradient forming a trough
- Non frontal conditions
- CA dominating
- PVA plays additional role especially with Comma feature
- Main cloud features: Stau features, Comma
|
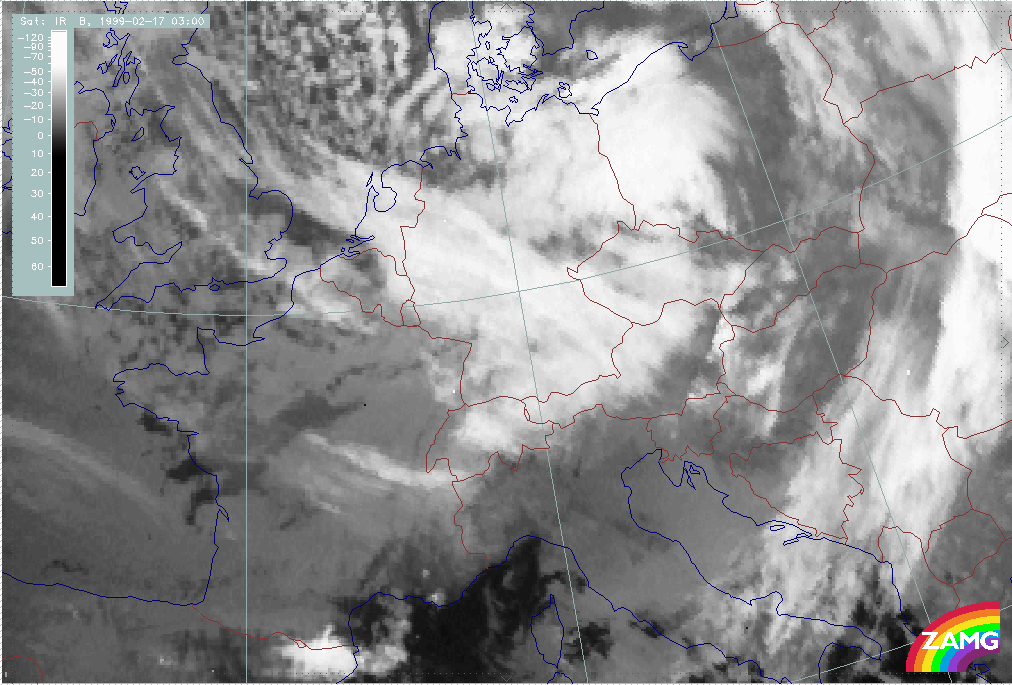
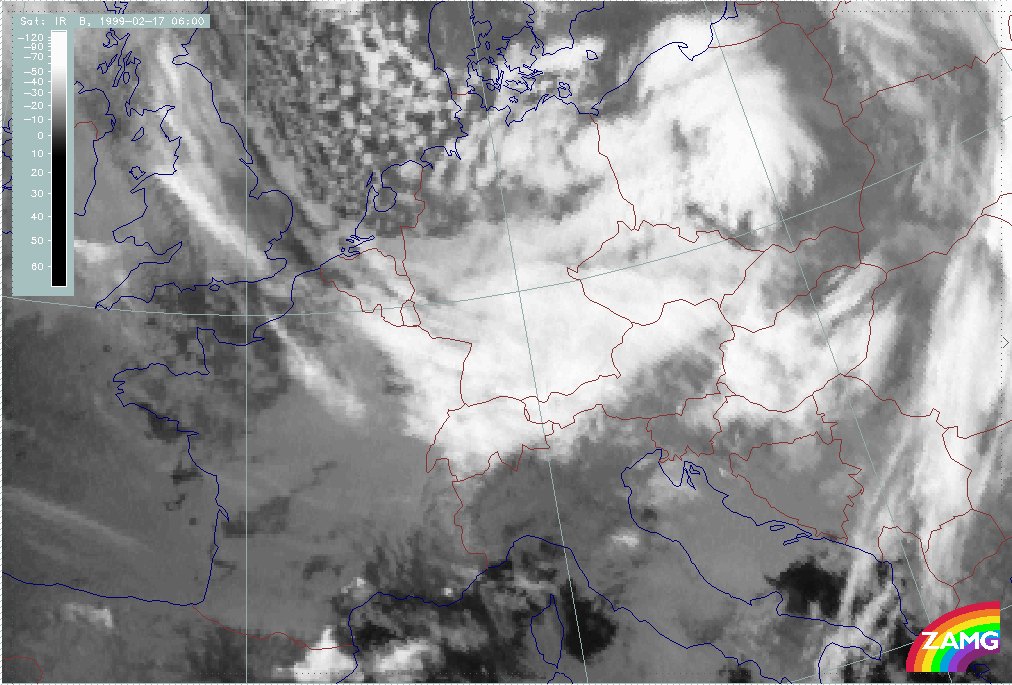
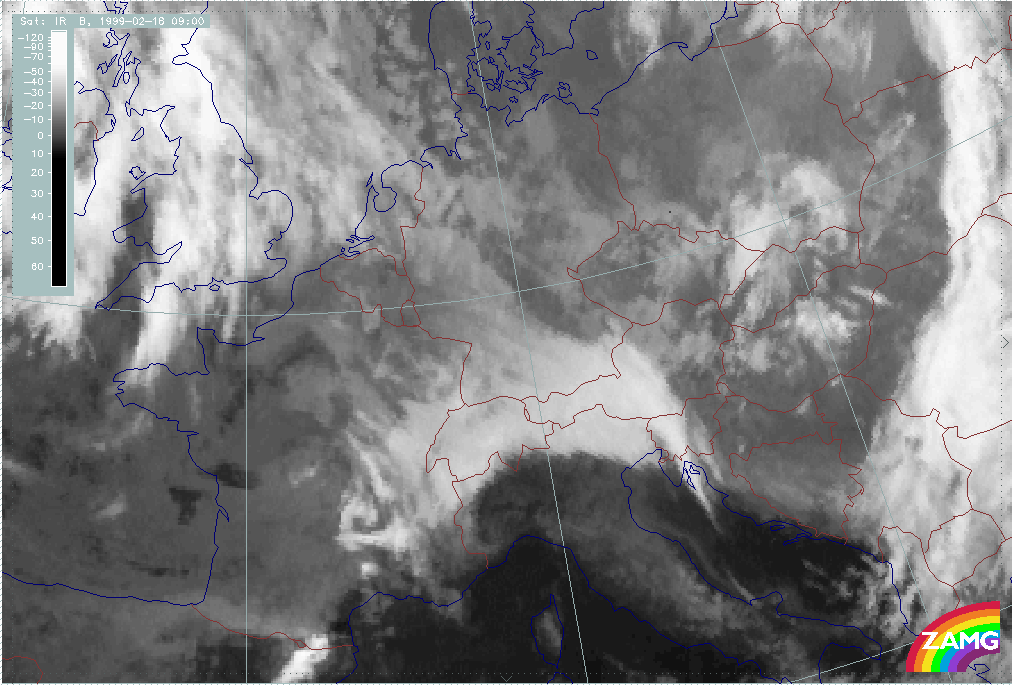
17 February 1999/00.00 UTC - Meteosat IR image; 00.00 - 18.00 UTC 3-hourly image loop
|
|
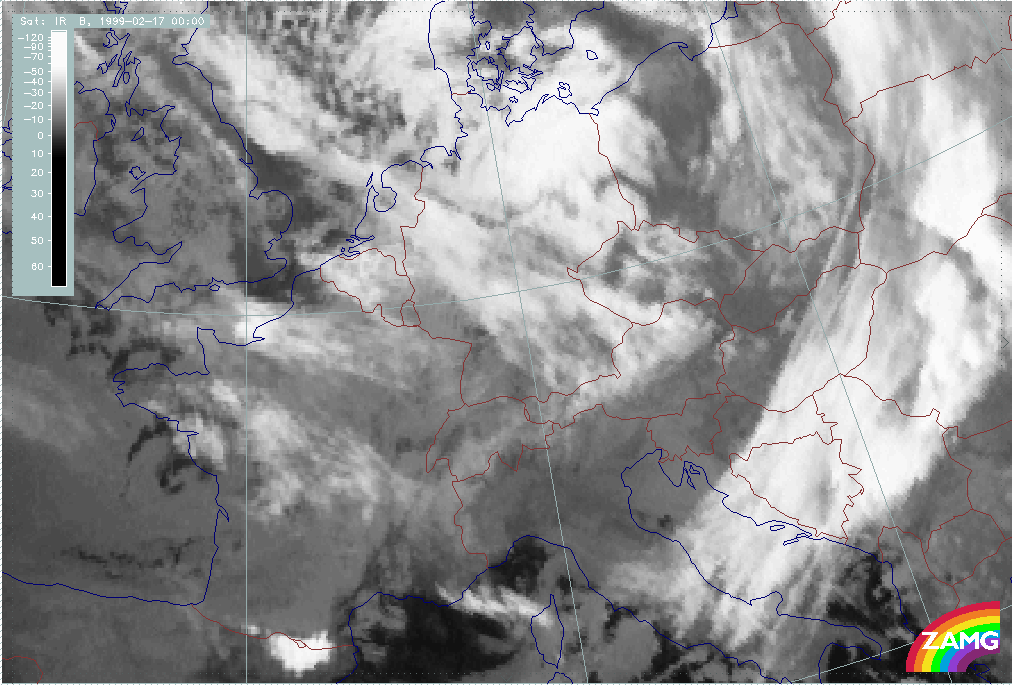
In summary, the following can be noted:
- Between 17/00.00 and 06.00 UTC (ph501 - ph503), the cloud fibres of a Warm Front Band extend from the NW (North Sea initially) to the highest mountain chain of the Alps in Austria and, later, also in Switzerland.
- North of this Warm Front Band, several cold air features develop; of special importance is a Comma feature which moves from the North Sea to a location over Germany to Poland.
- During this sub-phase between 17/03.00 - 06.00 UTC, very distinct high Lee Cloud fibres develop at the E. Alps and extend from E.-SE. Austria and the E. Czech Republic into Slovakia and Hungary.
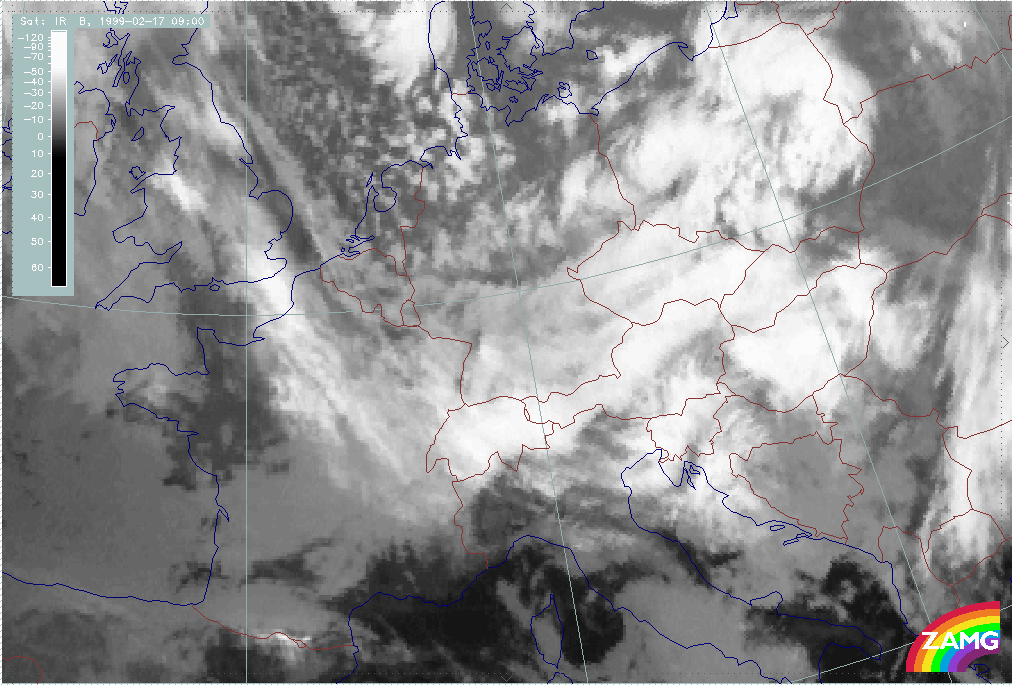
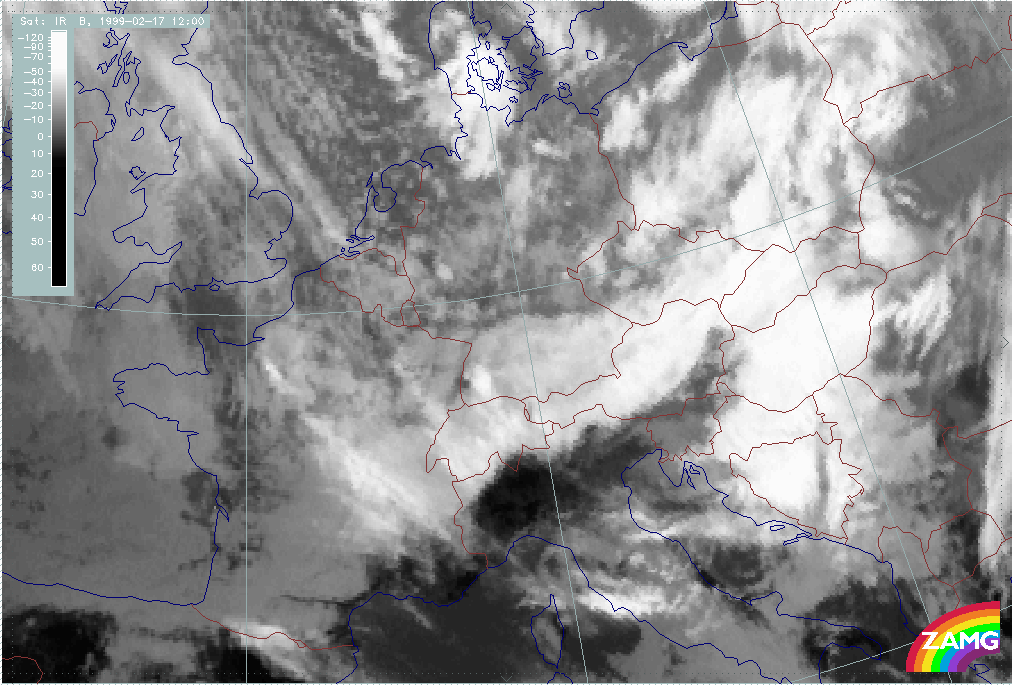
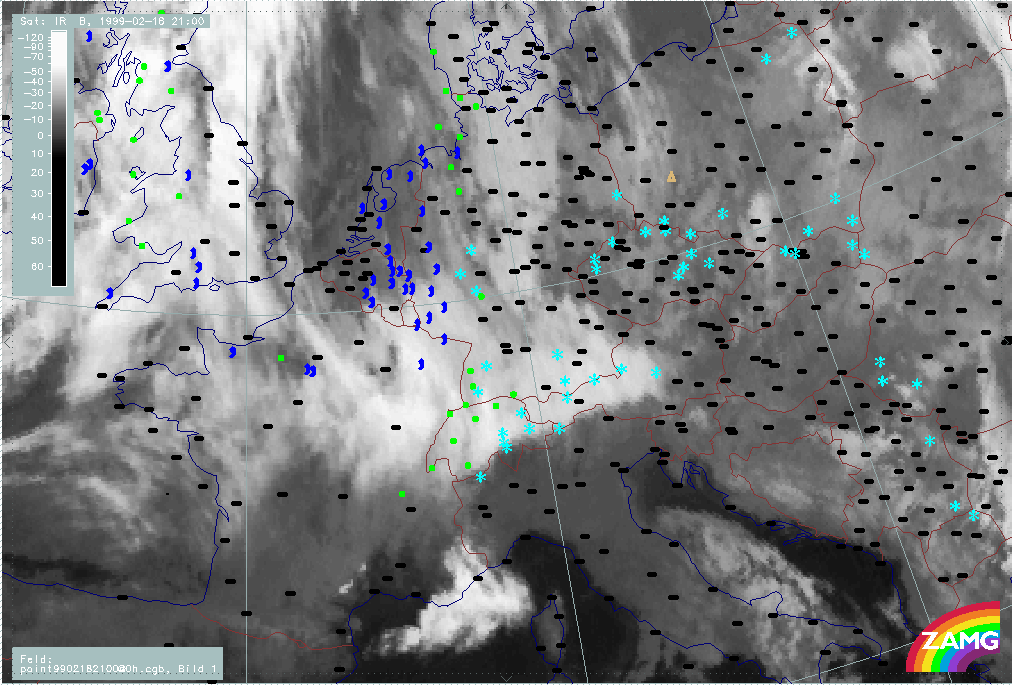
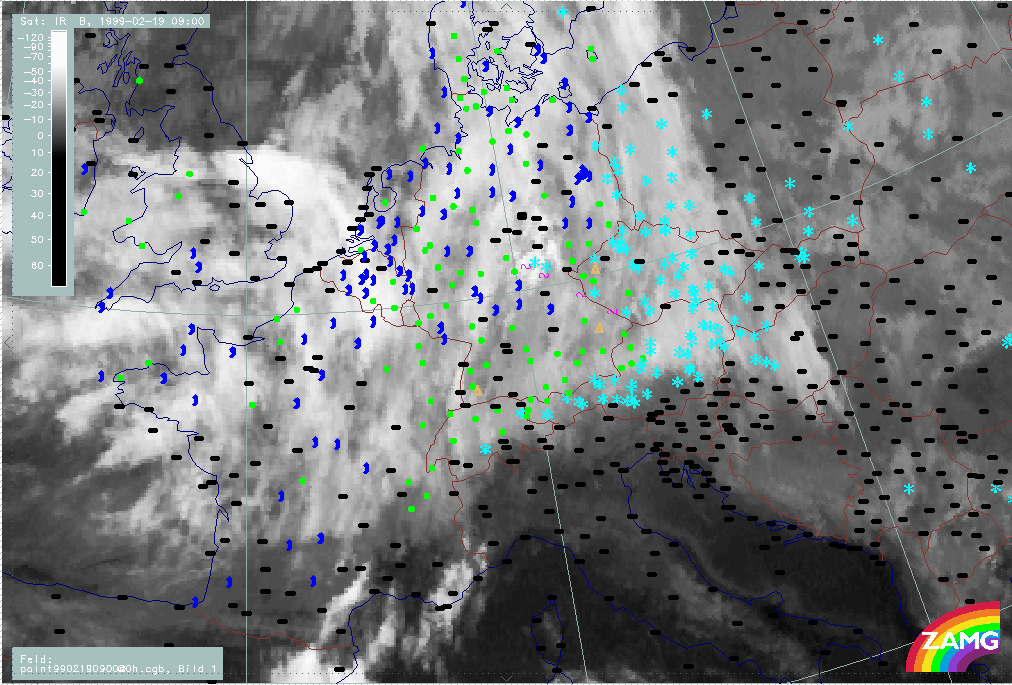
- At 17/09.00 UTC (ph504), the Comma is already so close to the Alps that a new area of cloudiness appears: there is Stau north of the Alps, especially over Central and E. Austria with the Comma cloud tail immediately north of it.
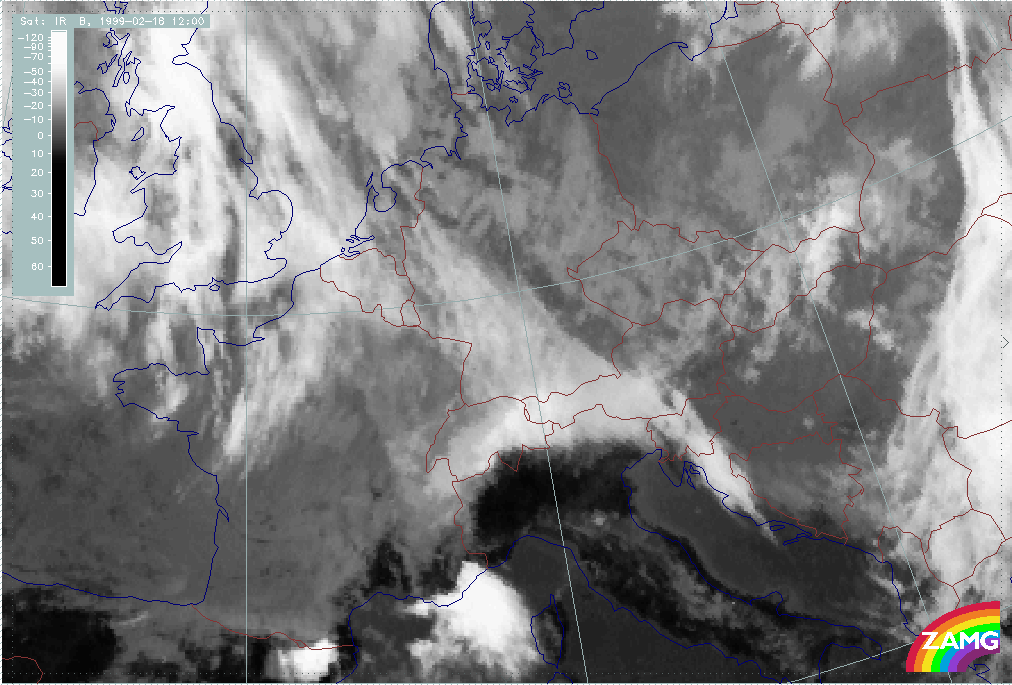
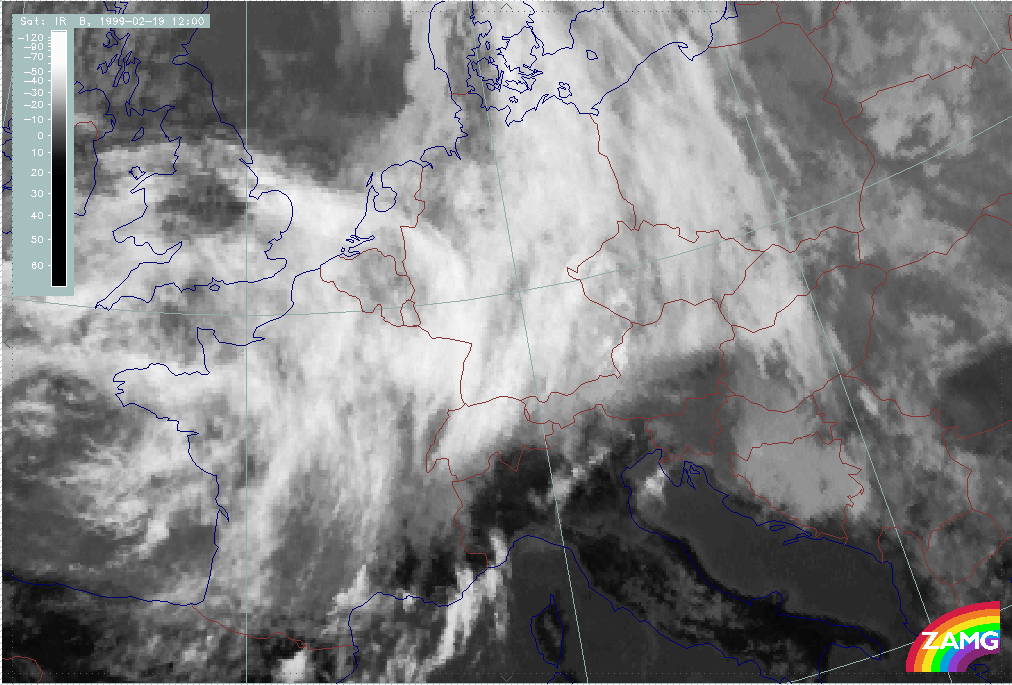
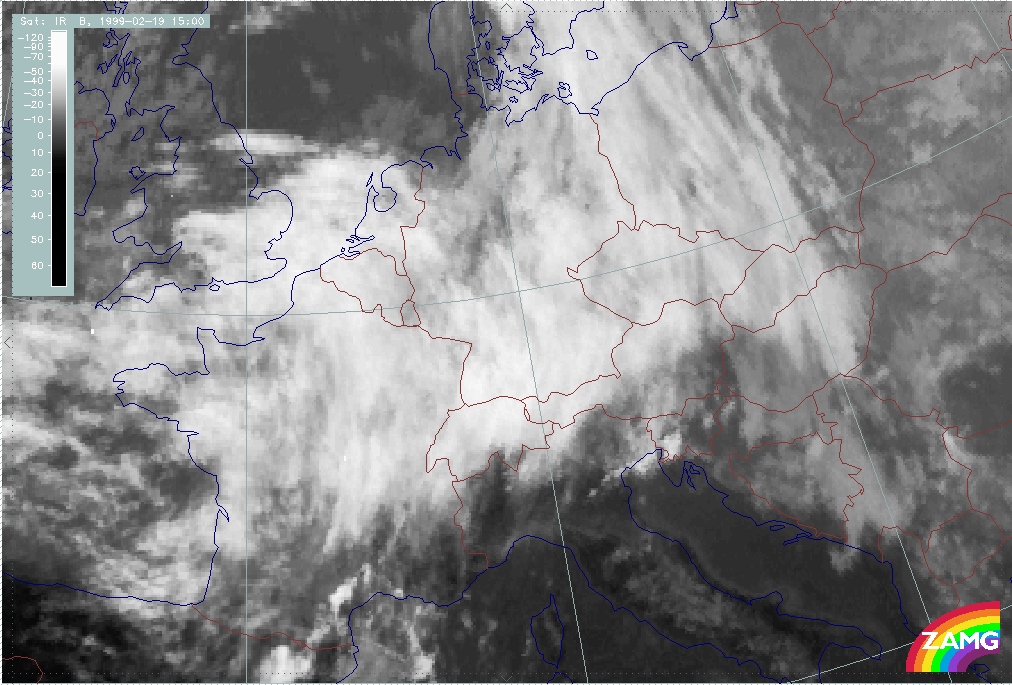
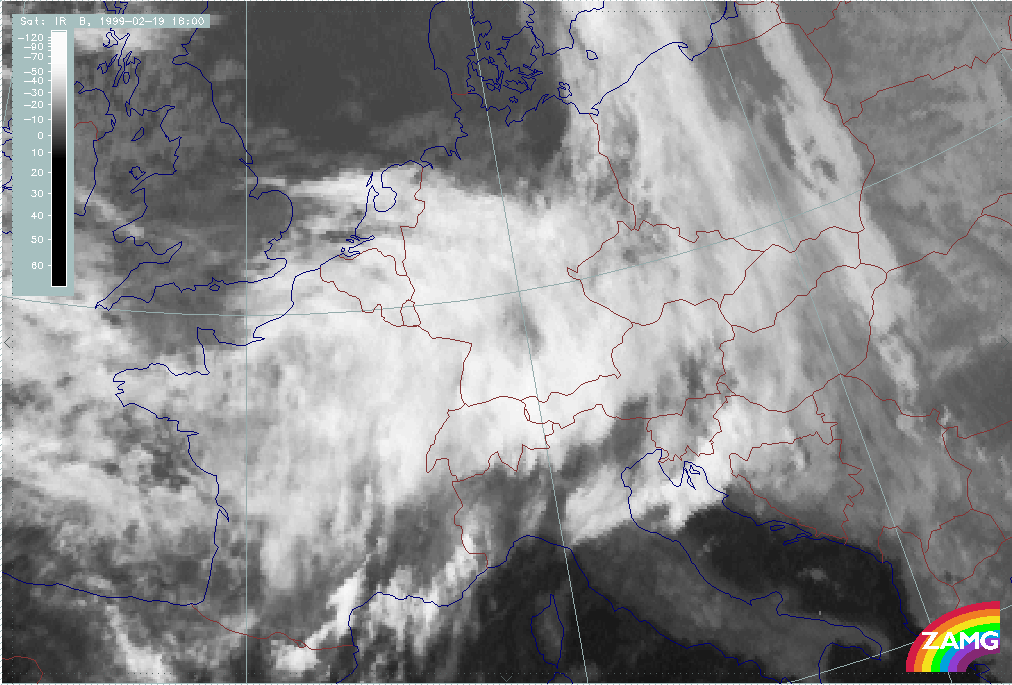
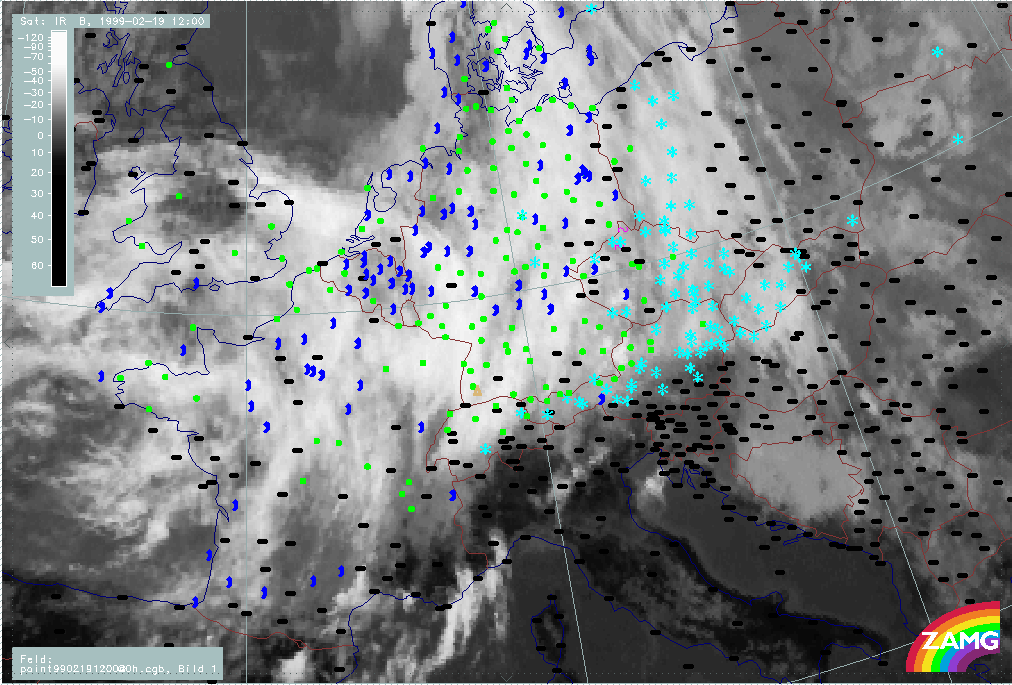
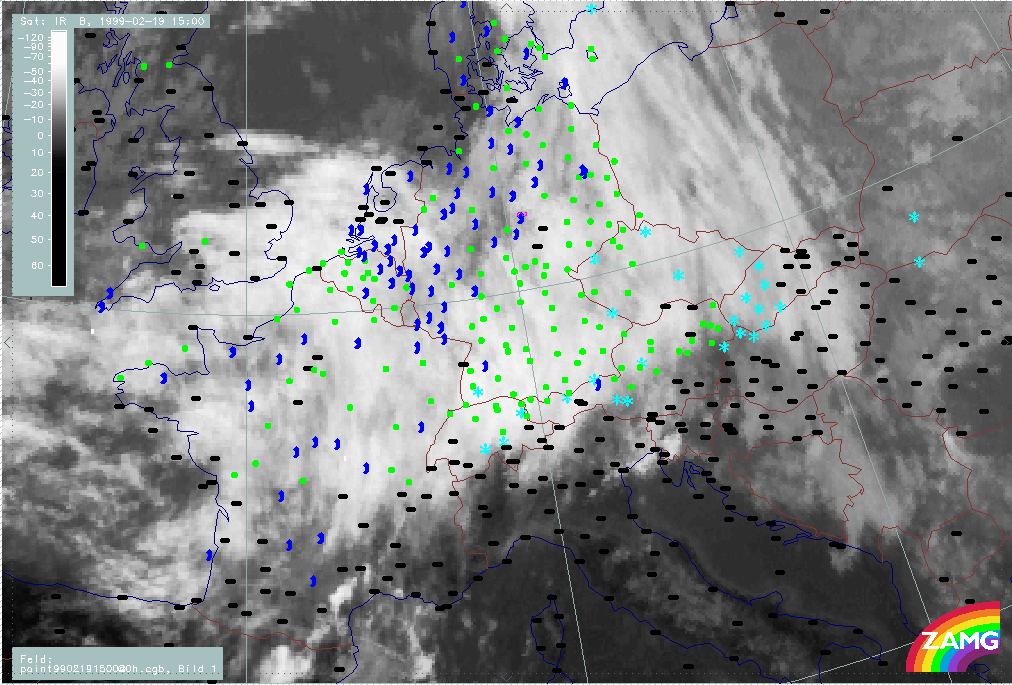
- The crossing of the Comma itself occurs between 17/12.00 and 18.00 UTC (ph505 - ph507) with the following cloud configurations:
- A merging between Stau and Comma tail cloud forming the typical bow-like Stau structure in Central and E. Austria.
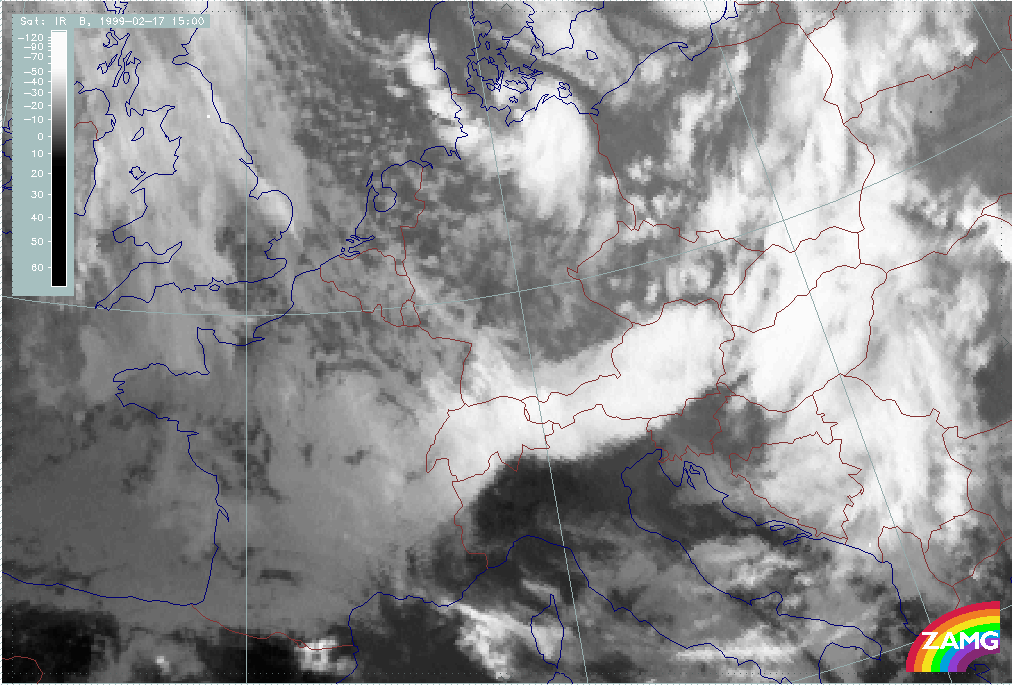
- Comma tail cloudiness including Stau Cloud moves southward ending at the southern mountain chains of the Alps at 17/15.00 UTC
- New Comma tail cloud forms south of the Alps over Slovenia and Hungary with a distinct cloud-free stripe in between some remnants of Stau Cloud in the Alpine region and the Comma cloud tail.
- The latter phenomenon is a very nice example of synoptic and mesoscale systems, and their associated cloudiness and physical featurs crossing the Alps more or less unchanged. Changes in the cloud structure appear only during the Alpine passage itself.
|
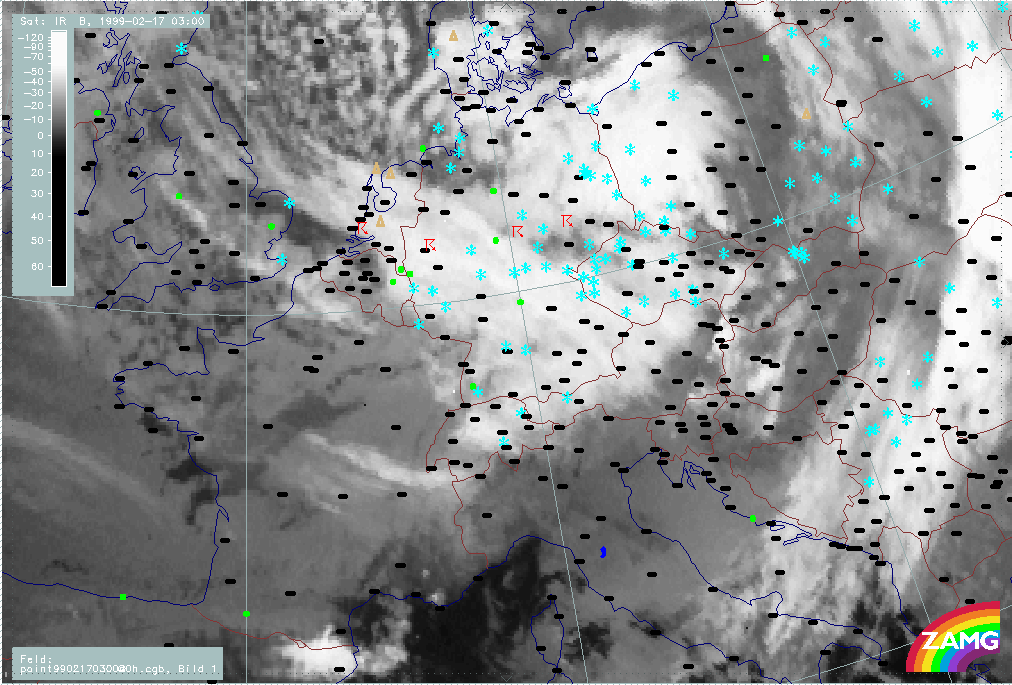
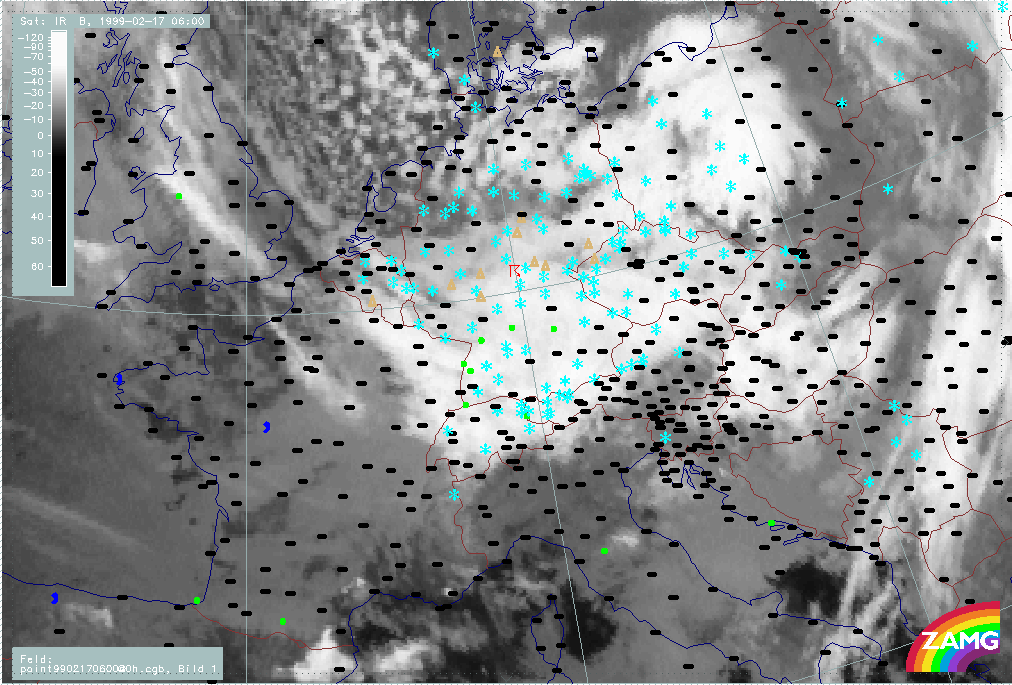
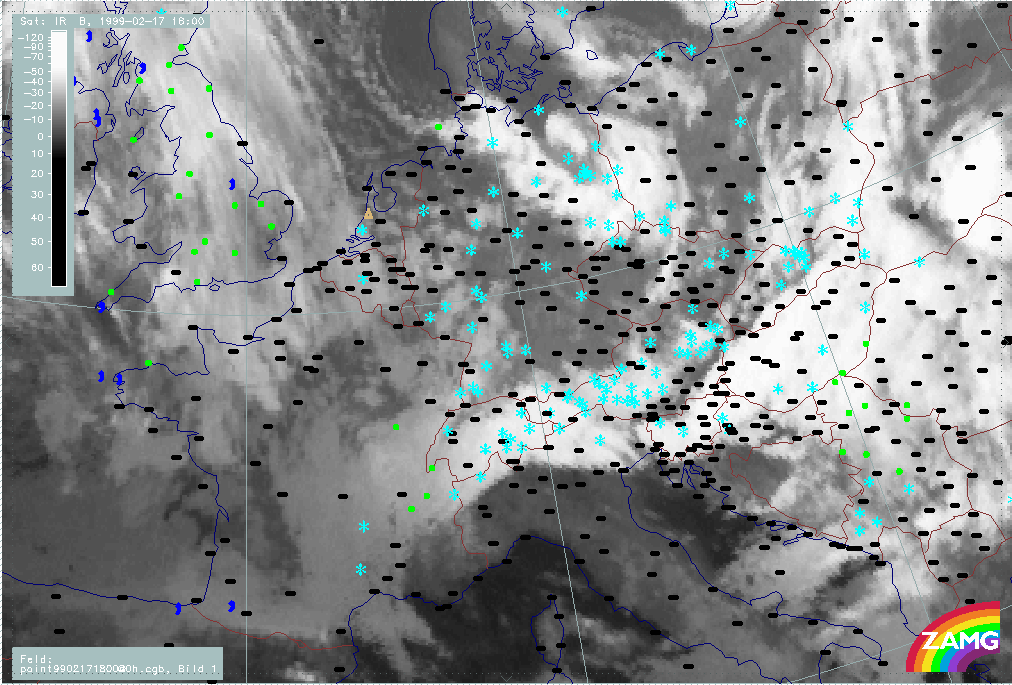
17 February 1999/00.00 UTC - Meteosat IR image; weather events (green: rain and showers, blue: drizzle, cyan: snow, red: thunderstorm with precipitation, purple: freezing rain, orange:
hail, black: no actual precipitation or thunderstorm with precipitation); 00.00 - 18.00 UTC 3-hourly image loop
|
|
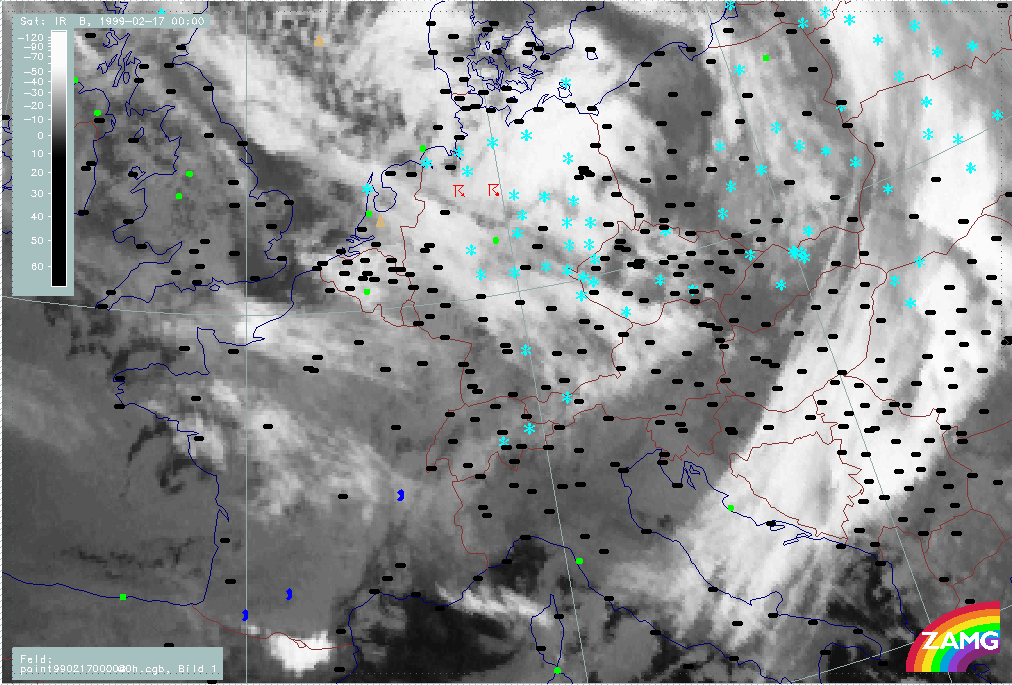
In summary, the following can be noted:
- There are reports of thunderstorms within the Comma tail during the whole phase from its formation over the North Sea and Germany to its arrival at the Alpine mountains.
- At the beginning of this phase there are only some reports of snow in the Alpine region.
- Snow events in the Alps increase first in the Stau area north of the Alps during the approach of the Comma, and then within the Alps during the crossing of the Comma.
- The newly formed Comma cloud south of the Alps at 17/18.00 UTC is no longer accompanied by widespread precipitation but only by some reports of snow.
|
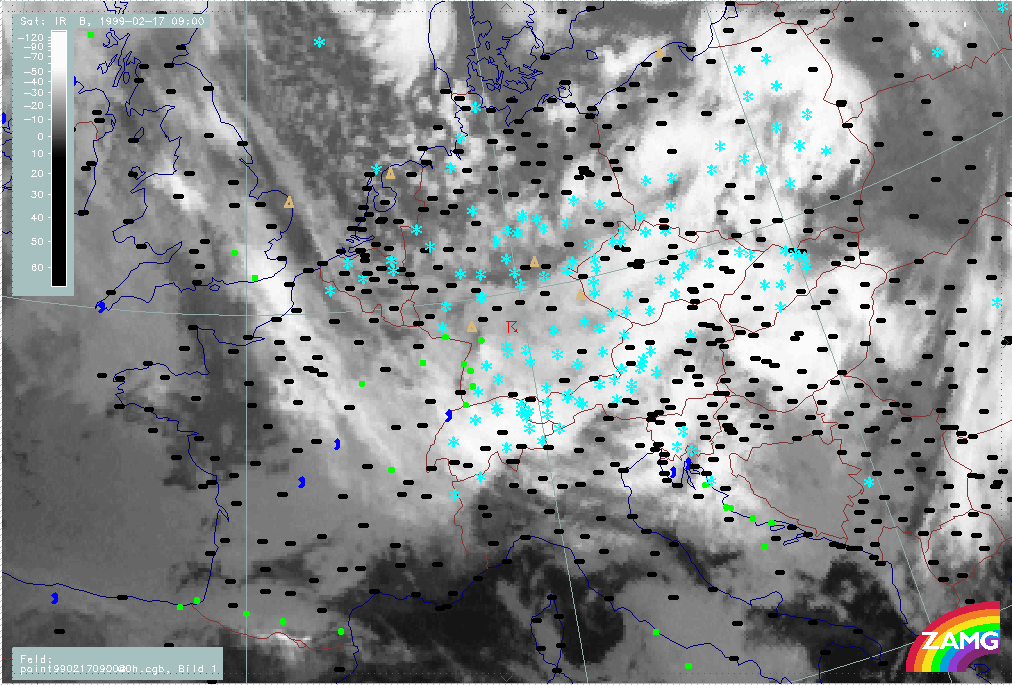
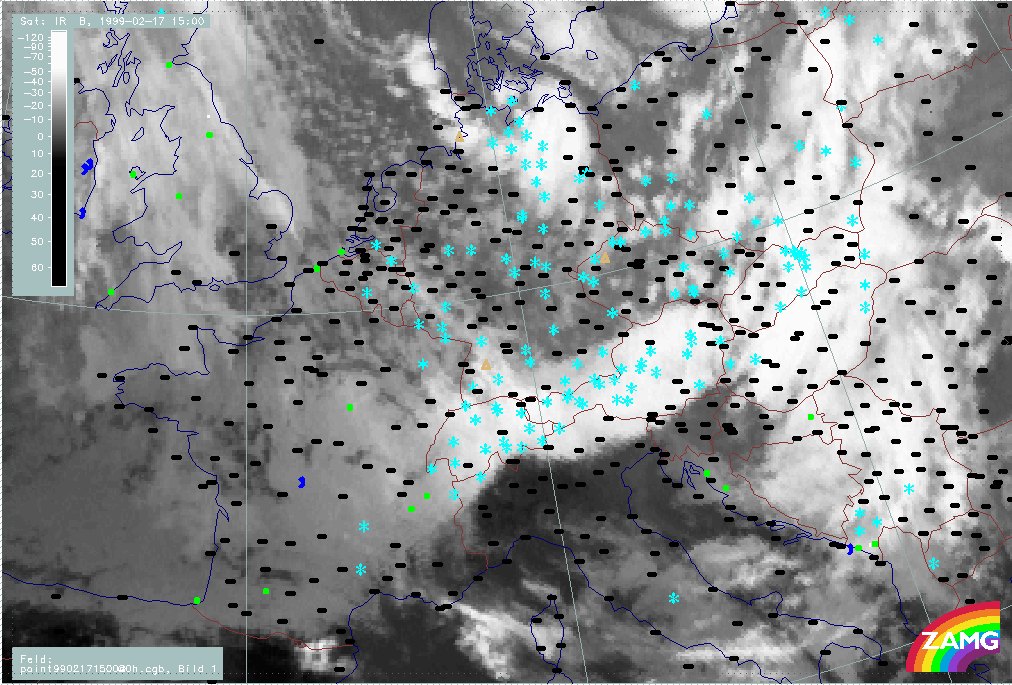
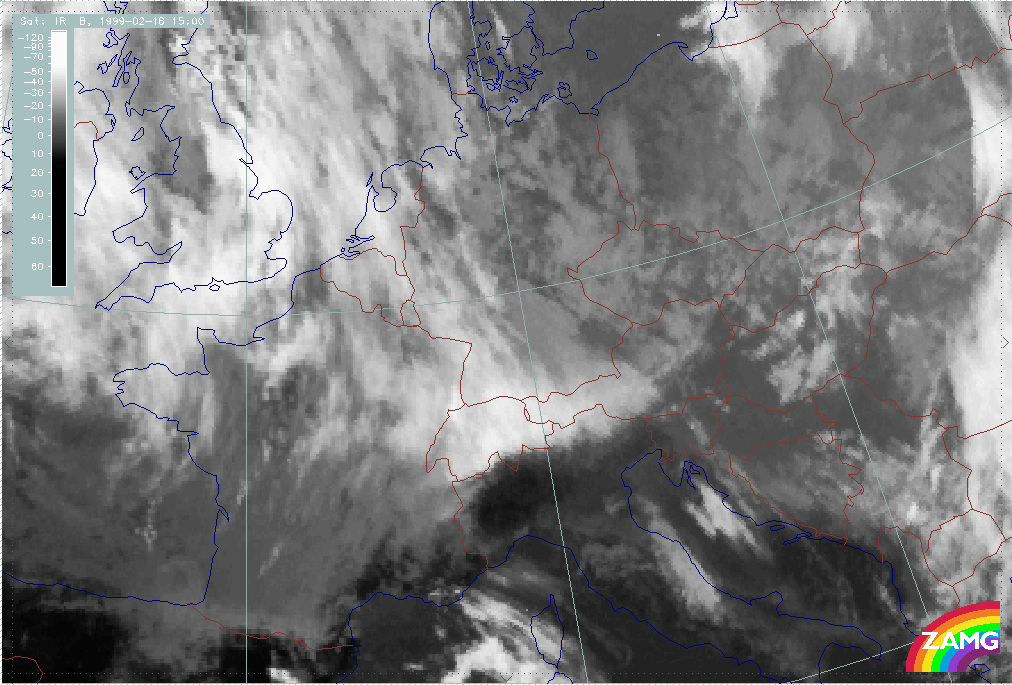
17 February 1999/09.00 UTC - Meteosat VIS image; 09.00 - 15.00 UTC 3-hourly image loop
|
|
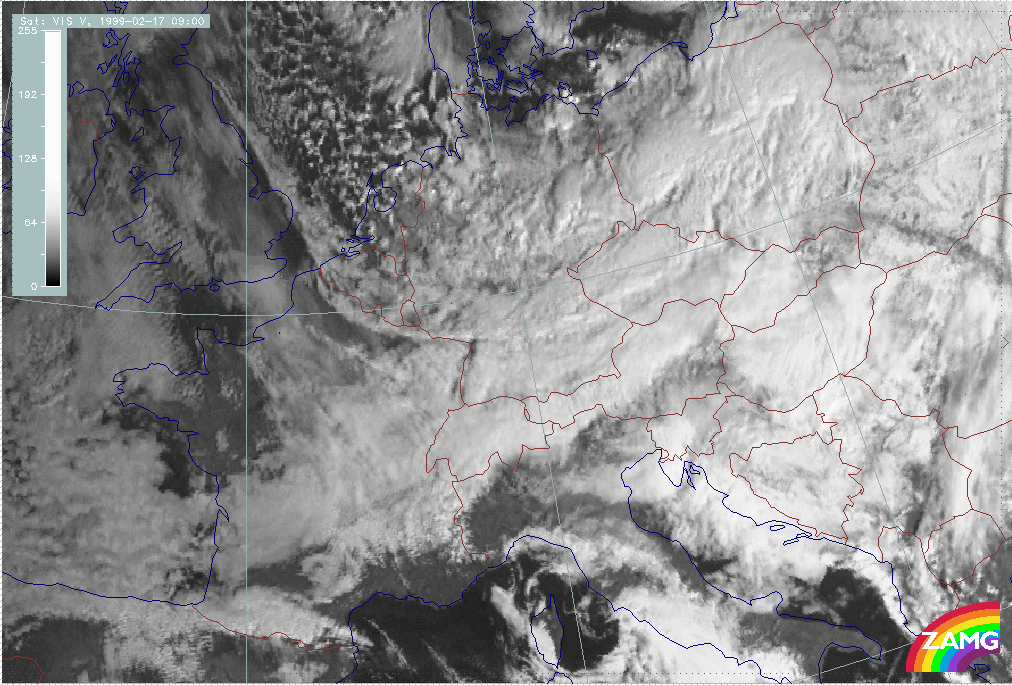
The following fact can be summarized:
- During the phase 17/9.00 - 15.00 UTC the merging of the two separate cloud systems "Stau" and "Comma tail" is easily recognisable in the VIS images.
For a detailed example see: Comma feature (Cold Air Development CAD)
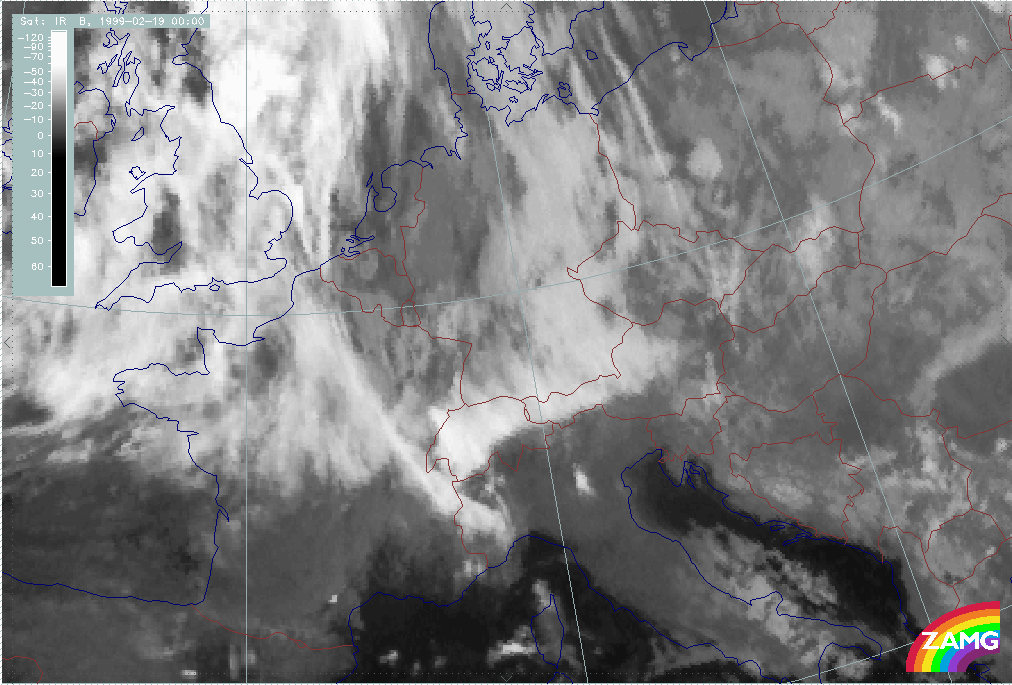
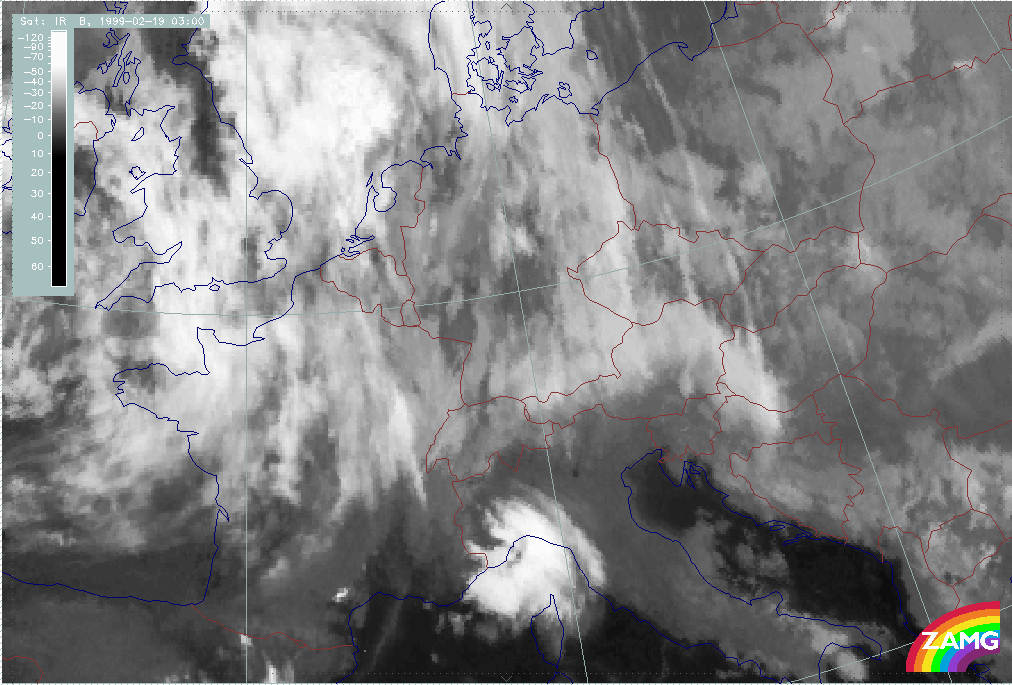
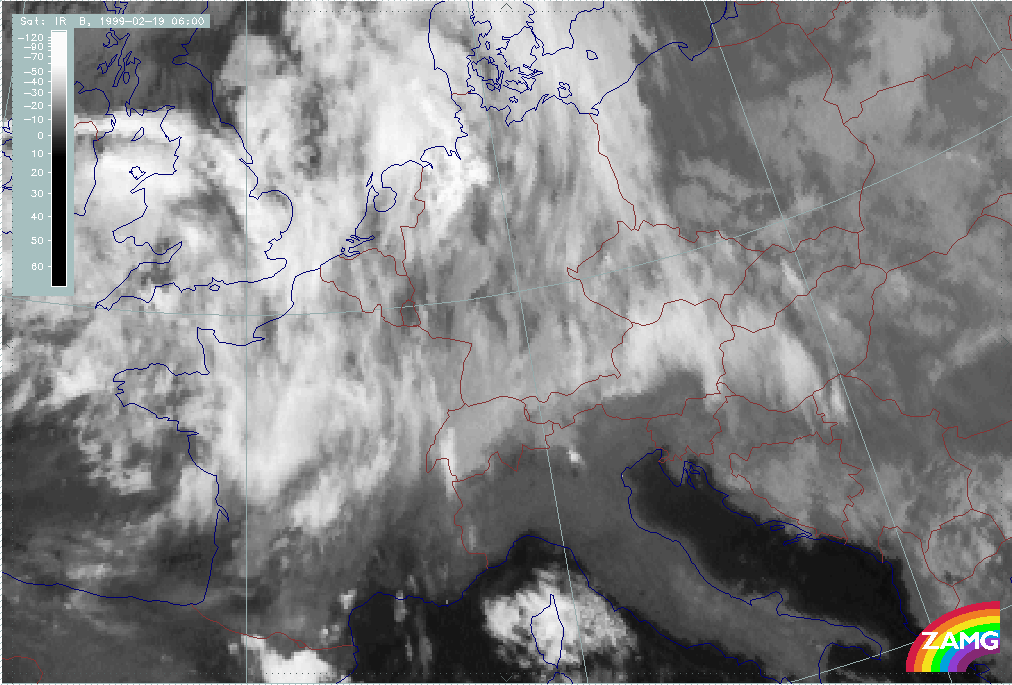
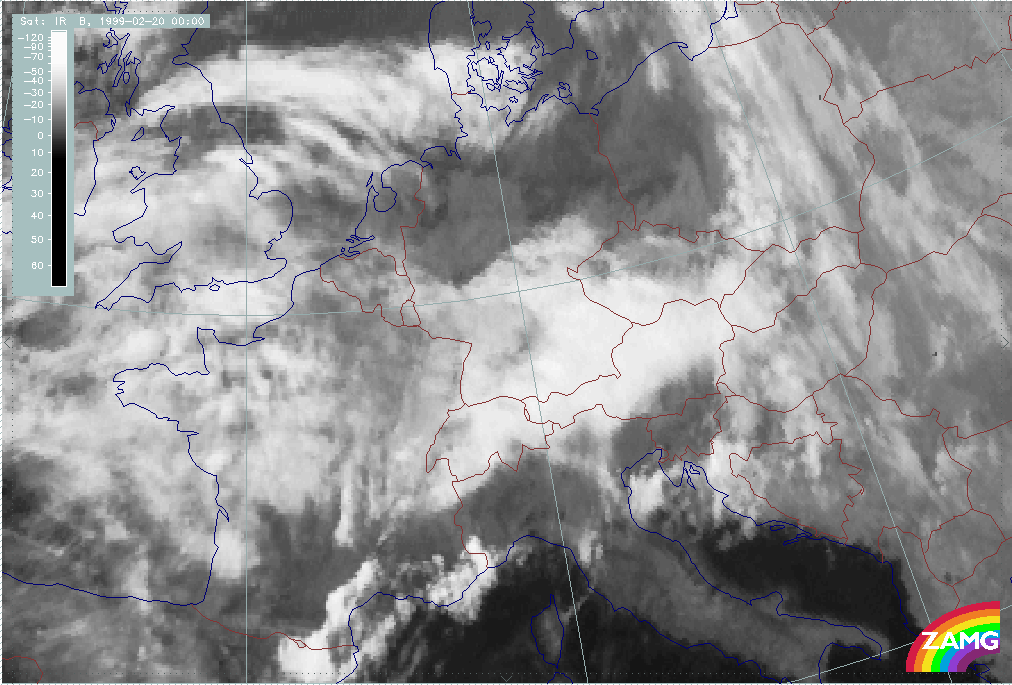
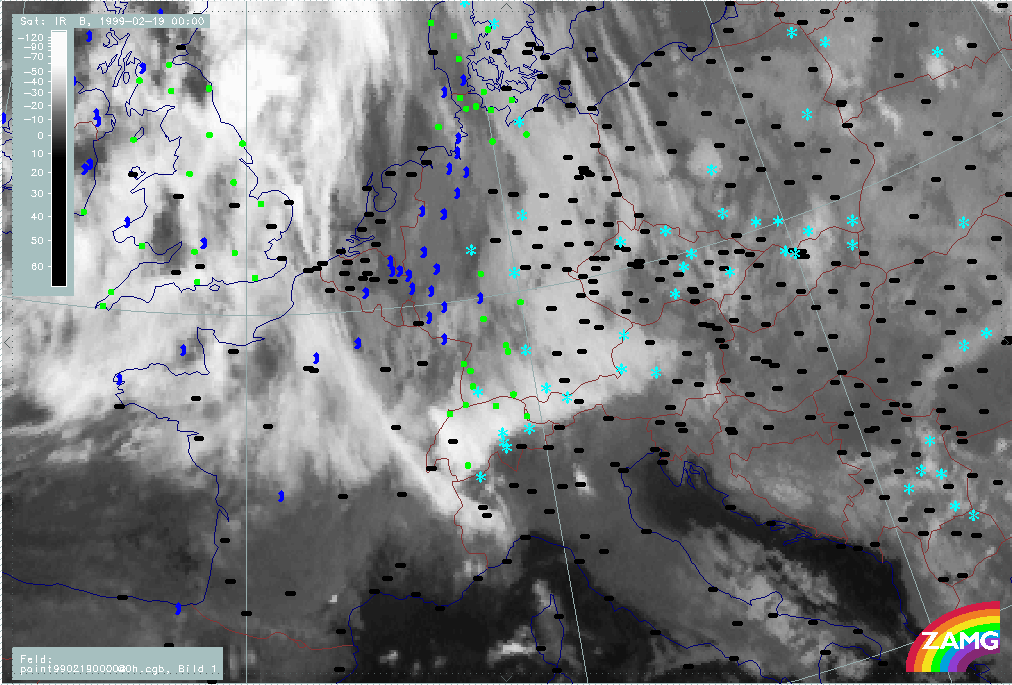
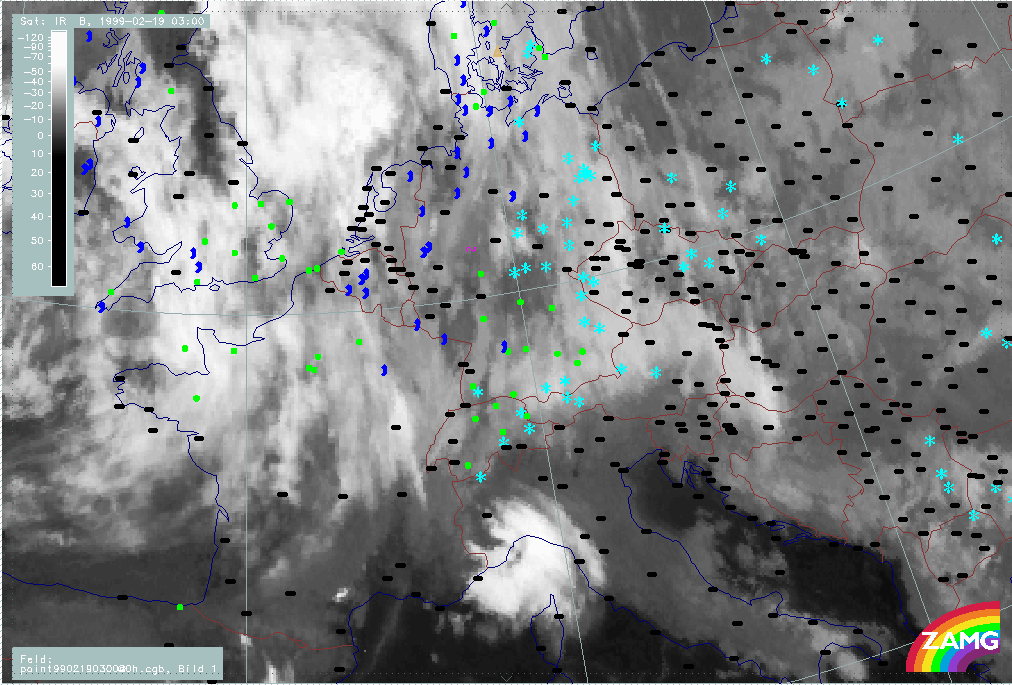
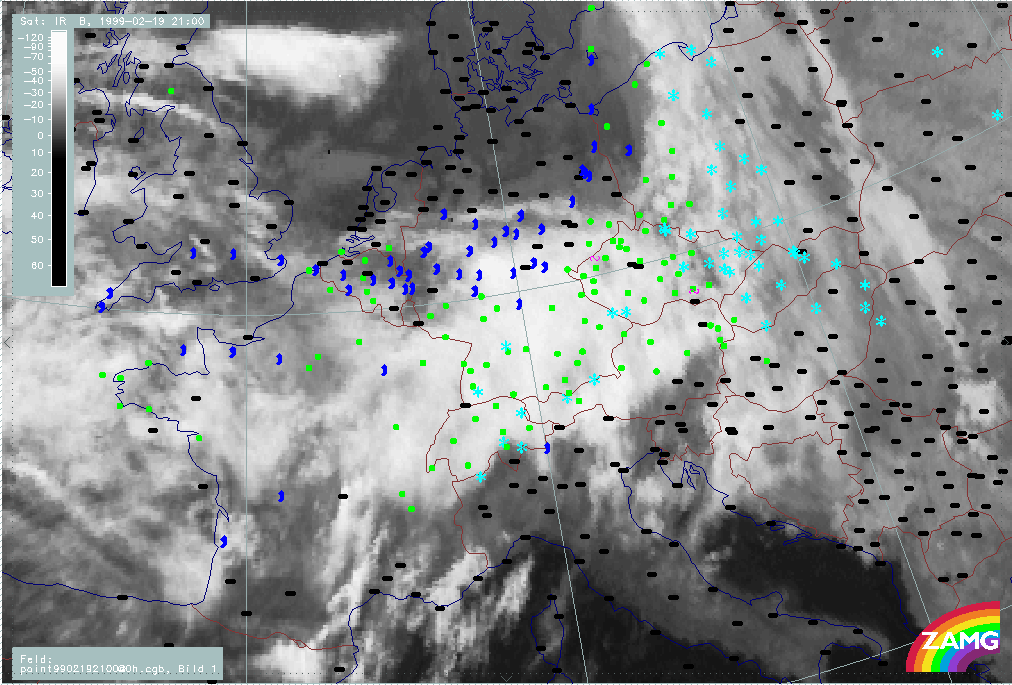
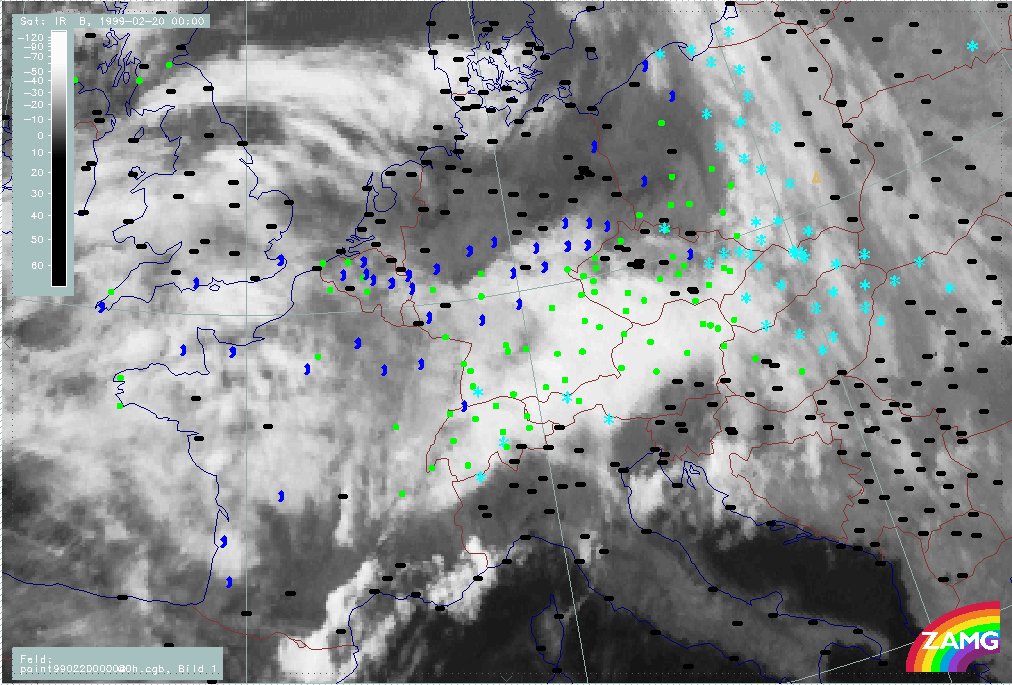
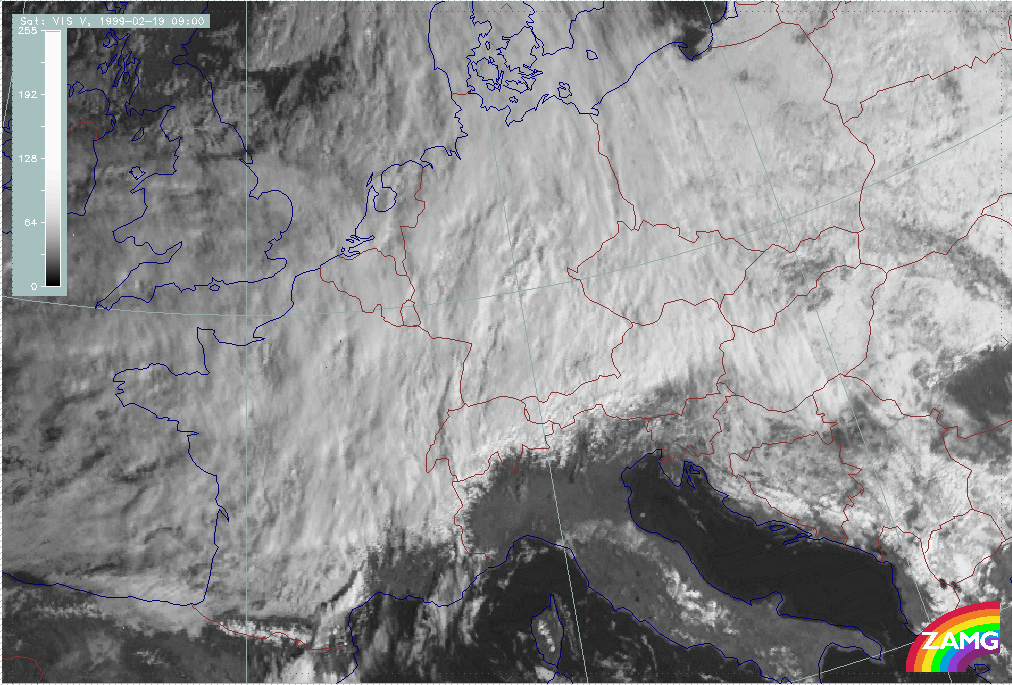
Phase 6: 18 February/00.00 - 20 February/06.00 UTC
This phase is characterised by:
- The crossing of two WF/WA systems with thickness gradients:
- Detached Warm Front
- Warm Front Shield
- Transition at the end of the period
- WA dominates
- Main cloud features are: Stau features, fibrous Warm Front cloud
|
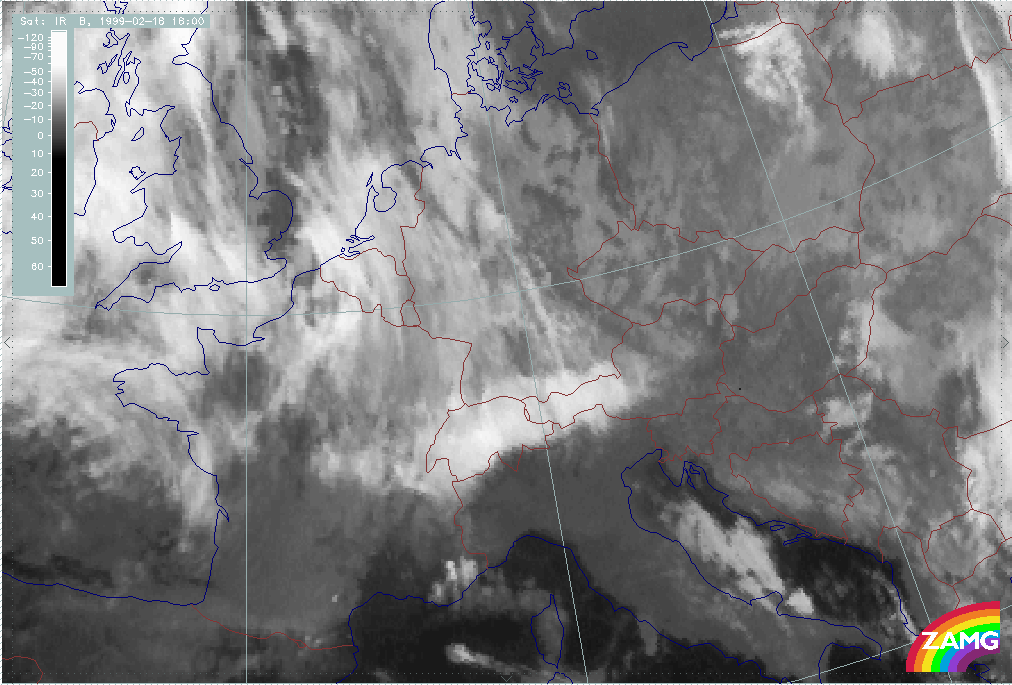
17 February 1999/21.00 UTC - Meteosat IR image; 17/21.00 - 20/00.00 UTC 3-hourly image loop
|
|
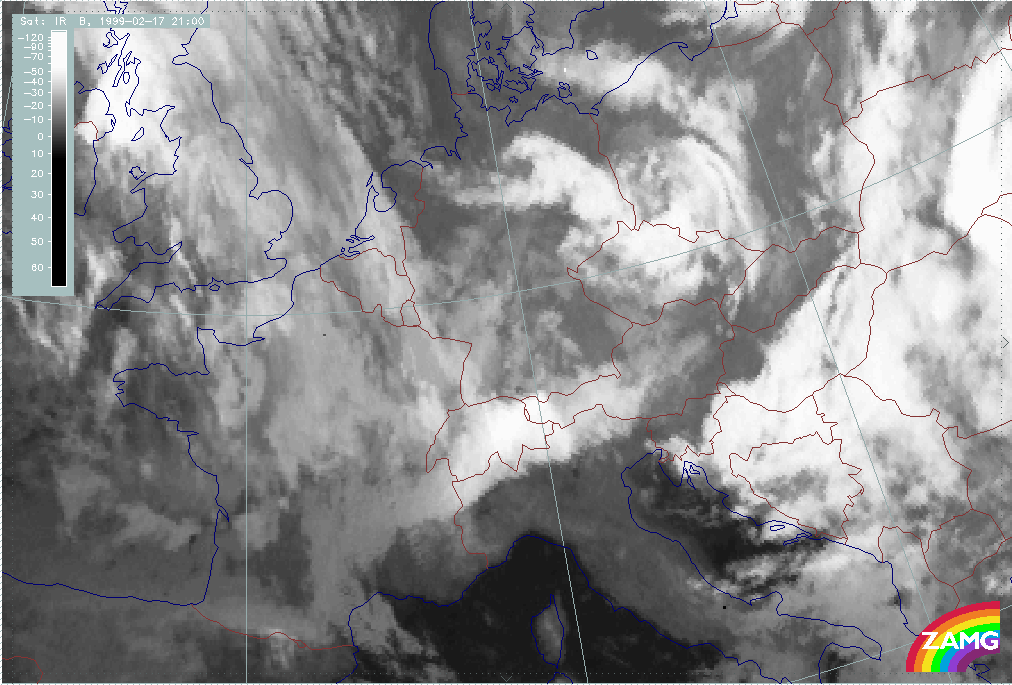
In summary, the following can be noted:
- At the beginning of this phase, 17/21.00 - 18/00.00 UTC (ph601 - ph602), the cloudiness of a Warm Front band is extending from France to the W. Alps and there is Stau Cloud over Switzerland, extending from there eastward to Tyrol; the Stau Cloud reaches the southernmost mountain chains over N. Italy.
- Between 18/03.00 - 12.00 UTC (ph603 - ph606), cloudiness associated with this Warm Front separates from the north-western systems and develops the typical cloud configuration of a Detached Warm Front. A main characteristic is the clouds at the leading side of the Detached Warm Front crossing the Alps in southward direction to South Tyrol and moving from there eastward and at the same time, with high upper level wind, southward across Slovenia and the Croatian coast. At the same time the leading edge of the Detached Warm Front cloud north of the Alps has only reached Salzburg (Central Austria).
- From 18/15.00 UTC (ph607) onwards, the Warm Front cloud band north of the Alps is fed by a new system propagating eastward from France across Switzerland. The two different cloud heights can easily be discriminated.
- Between 18/15.00 - 19/00.00 UTC (ph607 - ph610), the most interesting phenomena are intensive Stau Cloud from Switzerland to Central Austria. But this Stau reaches only to the highest mountain chains or slightly further to the south. But SE Switzerland, N. Italy and Carinthia are cloud free.
- From 19/00.00 UTC (ph610) on, the leading edge of this cloud propagates very quickly and extends south-eastward over Hungary and Croatia.
- At the same time, but especially from 19/09.00 - 20/00.00 UTC (ph613 - ph618), fibrous clouds from a new Warm Front Shield propagate from France westward first to the W. Alps (Switzerland) but later also to E. Austria.
- This new Warm Front cloud merges with the old Warm Front cloud and moves eastward quite quickly to E. Austria. The southern cloud boundary is at the highest mountain chain.
- From 19/00.00 UTC on, cloud features become more diffuse and indicate a change in the synoptic situation.
|
17 February 1999/21.00 UTC - Meteosat IR image; weather events (green: rain and showers, blue: drizzle, cyan: snow, red: thunderstorm with precipitation, purple: freezing rain, orange:
hail, black: no actual precipitation or thunderstorm with precipitation); 17/21.00 - 20/00.00 UTC 3-hourly image loop
|
|
In summary, the following can be noted:
- There is a lot of precipitation within this phase, in and north of the Alpine region.
- Some additional facts worth mentioning concerning the first detached Warm Front phase 17/21.00 - 18/12.00 UTC (ph601p - ph606p):
- The Detached Warm Front in the first phase generates snow.
- The fibrous cloud parts south of the Alps are middle and high cloud and not accompanied by any precipitation.
- The second Warm Front band, merging with the first, approaches with rain from 18/18.00 - 21.00 UTC (ph607p - ph609p) only in the westernmost parts, especially over W. to SW. Switzerland. By 19/00.00 UTC (ph610), the rain area extends eastward to W. Austria (Vorarlberg) and Bavaria. Tyrol still reports snowfall.
- The main rain event approaches with the Warm Front cloud shield between 19/09.00 - 20/00.00 UTC (ph613p - ph618p) and ultimately covers the whole Alpine region (except for the highest mountains where, of course, snow prevails).
- It was this warm air outbreak, together with rain, that was a primary cause for the later avalanches. Snow melted during this warmer phase but froze again during the subsequent phases so that the new snow lying on top of this frozen layer was not bonded to it and was accelerated while sliding downhill.
|
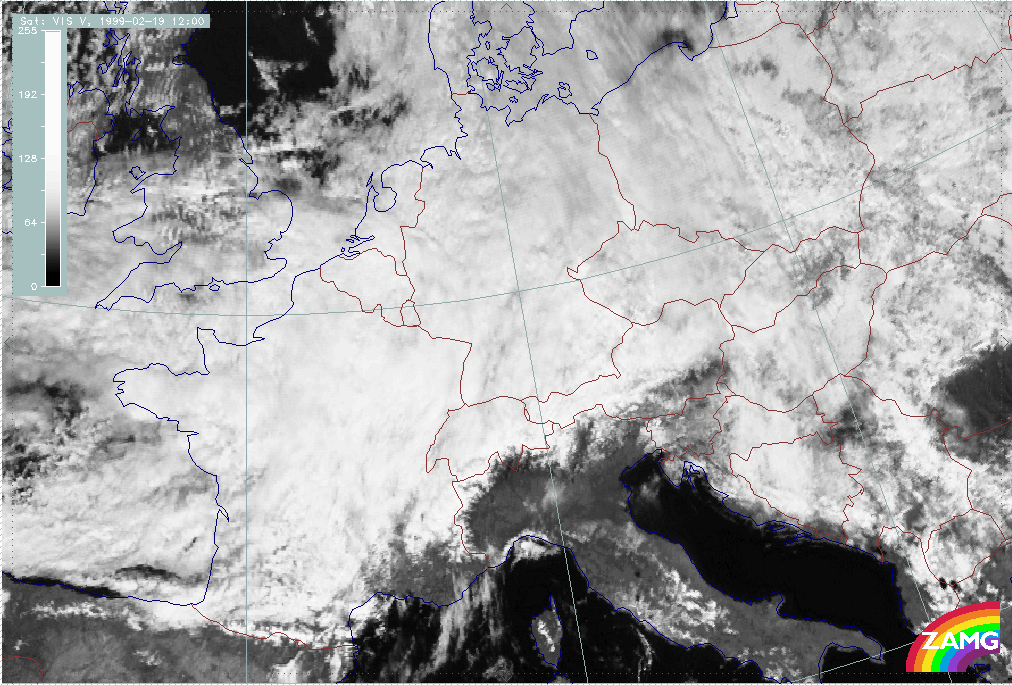
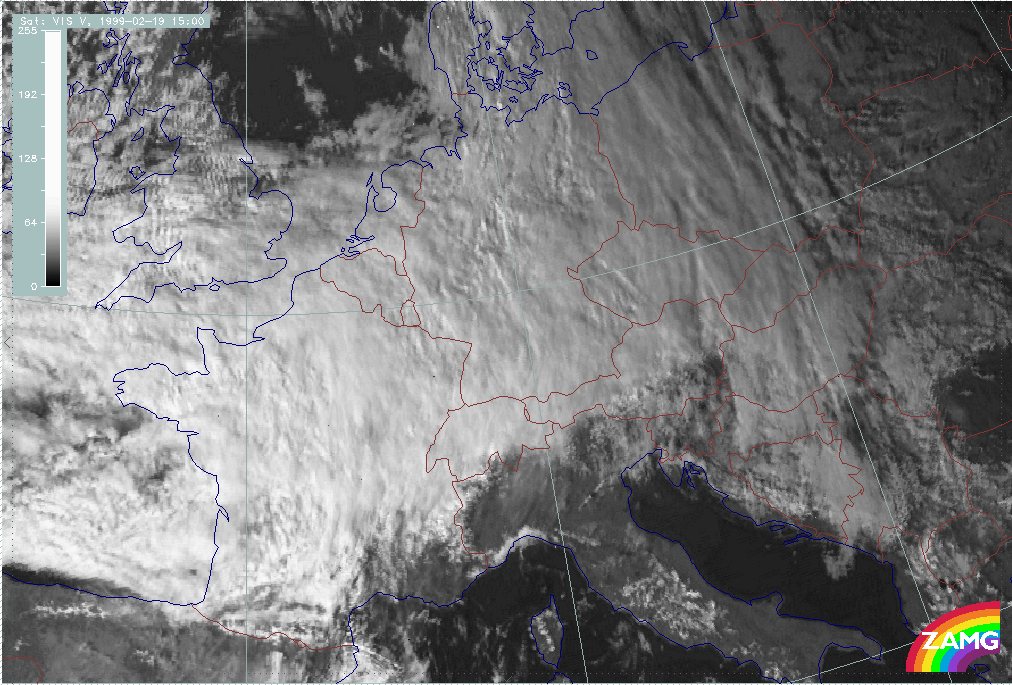
18 February 1999/09.00 UTC - Meteosat VIS image; 18/09.00 - 19/15.00 UTC 3-hourly image loop
|
|
In summary, the following can be noted:
- The first phase covered by VIS images shows the Detached Warm Front cloud and the fibre crossing the Alps at the leading edge. Only the southernmost mountain chains over N. Italy are cloud free; but cloudiness covering the mountains over N. Italy is translucent and therefore only high Lee Cloudiness.
- The second phase covered by VIS images shows the approach and eastward movement of the Warm Front Shield. Here, Stau cloud do not cross over the main mountain chain.
For a detailed example see: Detached Warm Front and subtypes and Classical Warm Front shields
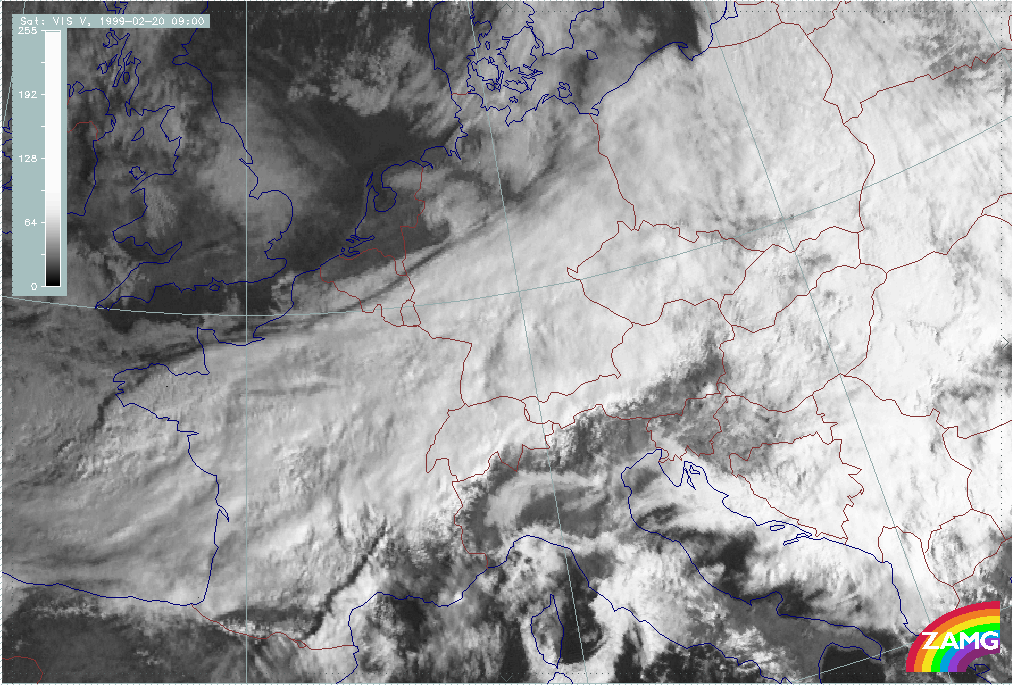
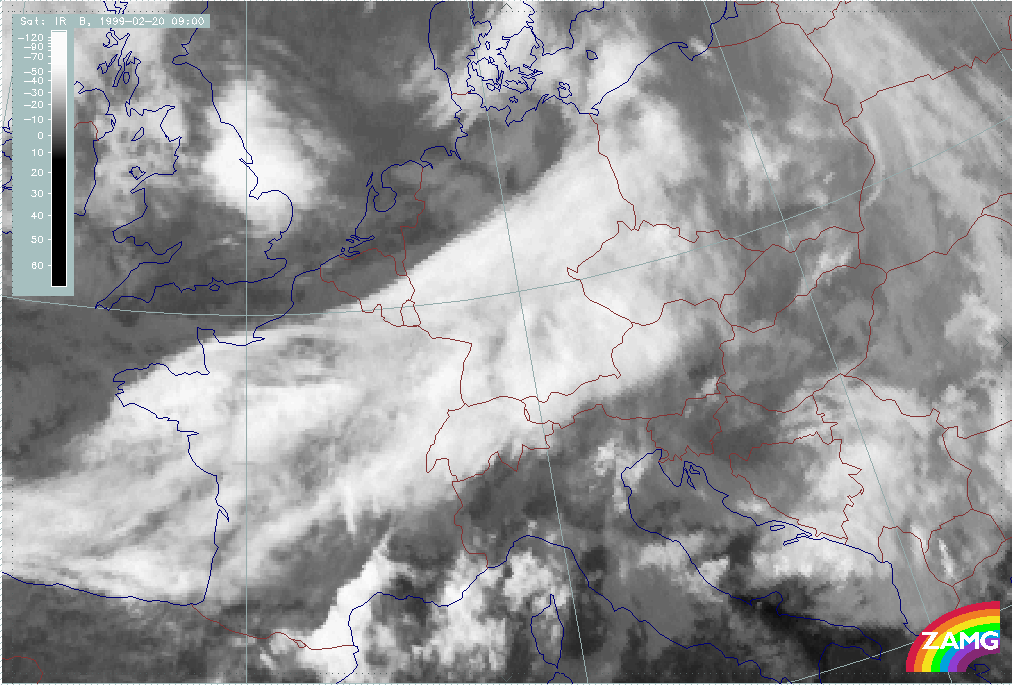
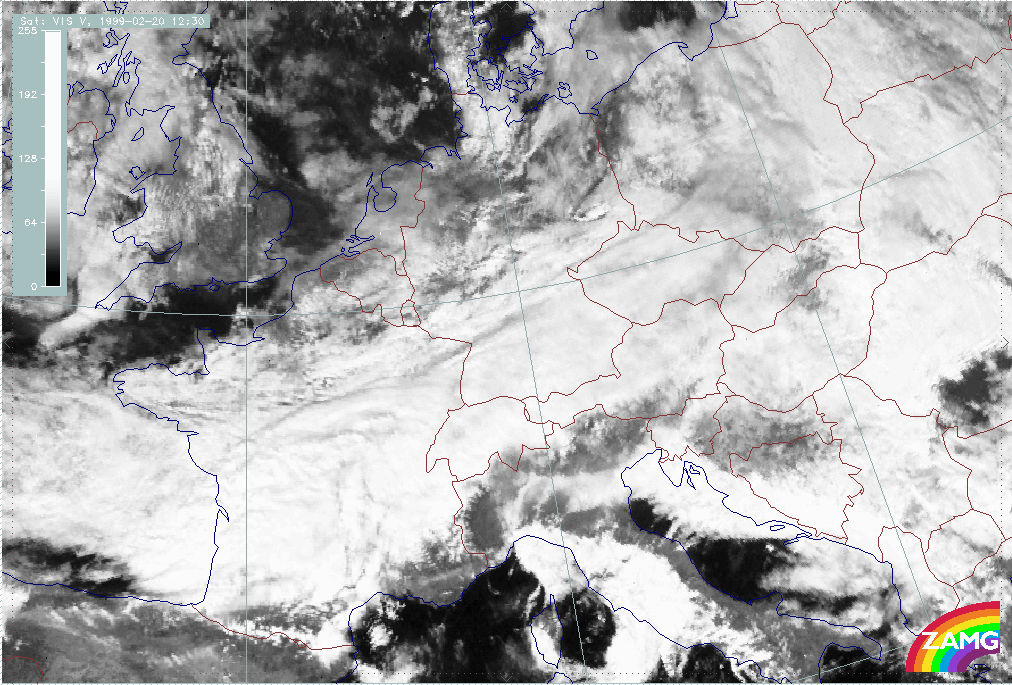
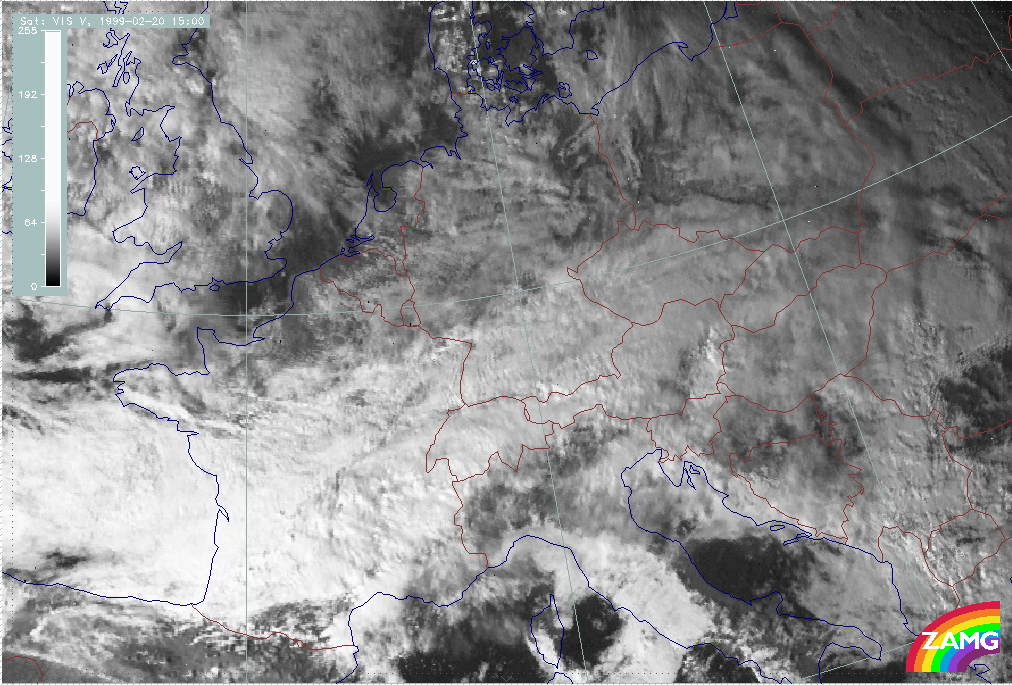
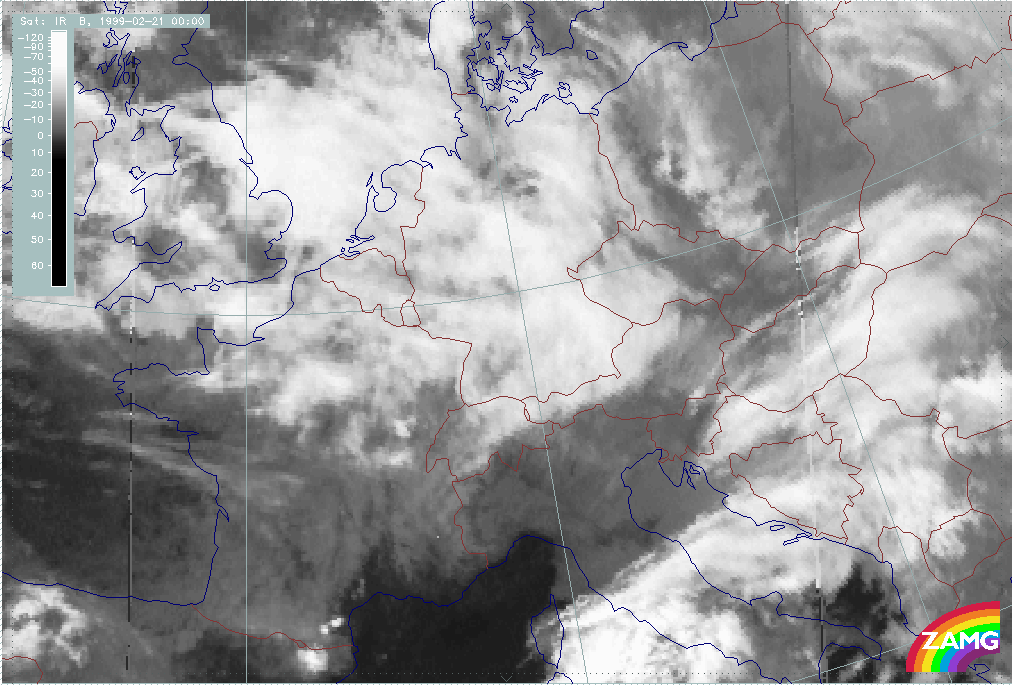
Phase 7: 20 February/12.00 - 20 February/18.00 UTC
This phase is characterised by:
- Cold Front crossing
- Development of Stau Cloud having features similar to an Occlusion
- CA dominates
- Main cloud features: Stau features, CF, Lee clearing after Cold Front passage
|
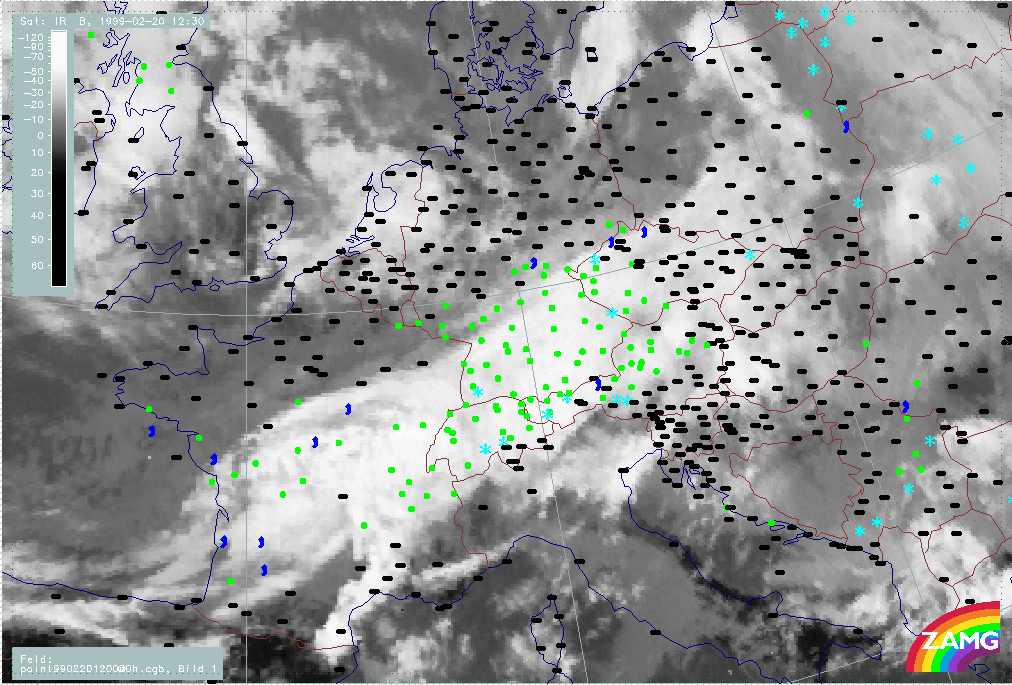
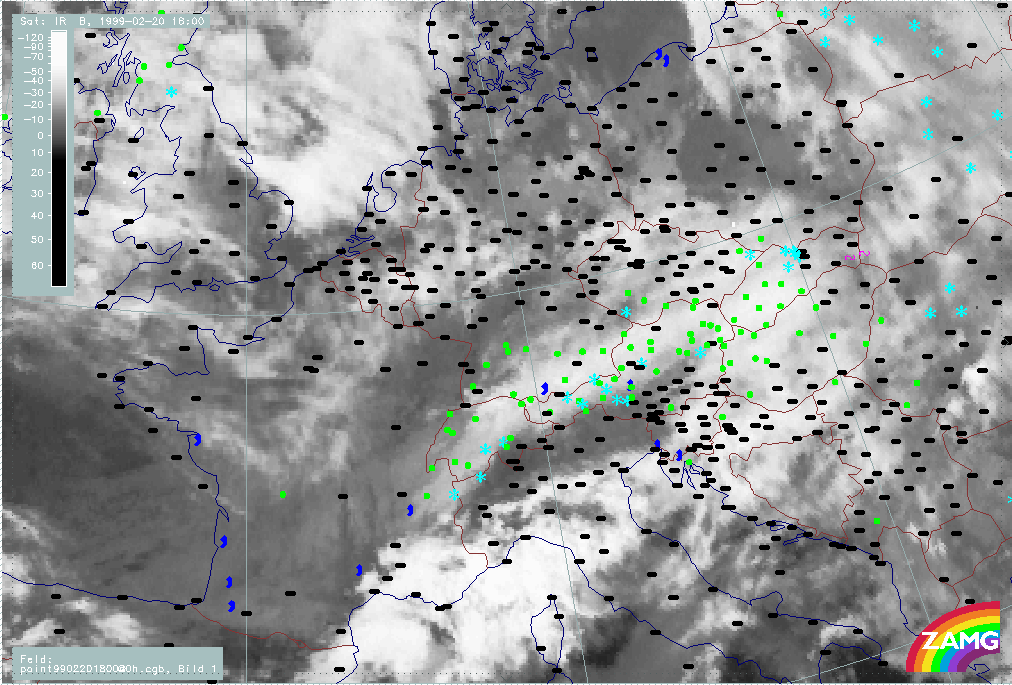
20 February 1999/06.00 UTC - Meteosat IR image; 20/06.00 - 20/18.00 UTC 3-hourly image loop
|
|
In summary, the following can be noted:
- At the beginning of this phase, 20/06.00 UTC (ph701), Stau Cloud exists at the Alps (W. Austria) and a broad Cold Front cloud band extends from the European NW coast to the Alps.
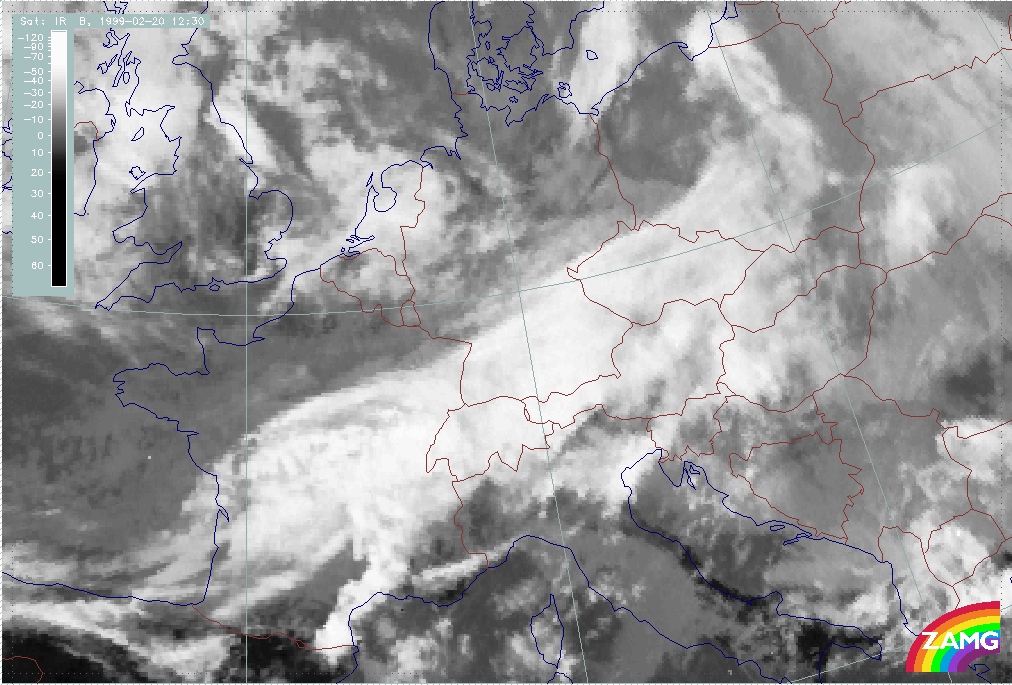
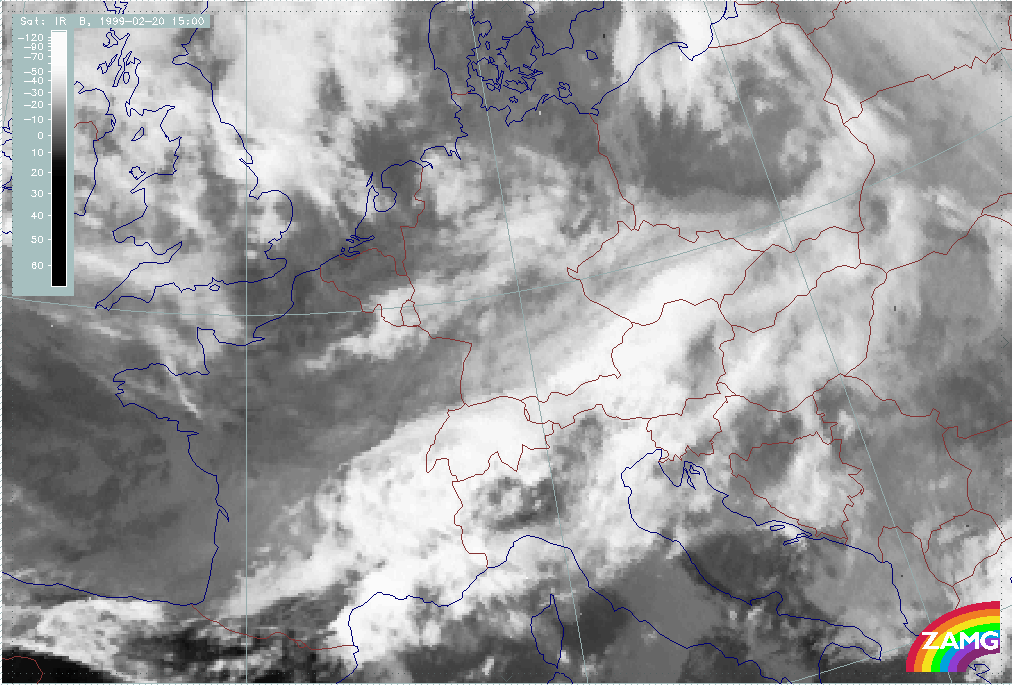
- Between 20/09.00 - 12.00 UTC (ph702, ph703) this frontal cloud band quickly approaches towards the Alps; Stau Cloud features are still recognisable over W. Austria and Switzerland.
- At 20/15.00 UTC (ph704), the cloud band lies partly over and partly south of the Alps. Over NW Italy in the lee of the W. Alps, holes develop in the cloud band. There is a lower cloud band across Germany and the W. Czech Republic immediately north of the high Cold Front band. Such a situation might indicate a Split Front character. (Compare VIS image loop.)
- The 1/2 hourly image sequence (not presented here) shows distinct "Lee clearing" from 16.30 onwards; at 17.30 the frontal cloud band has completely passed the mountains; some remnants of cloud remain in the Alpine mountain area.
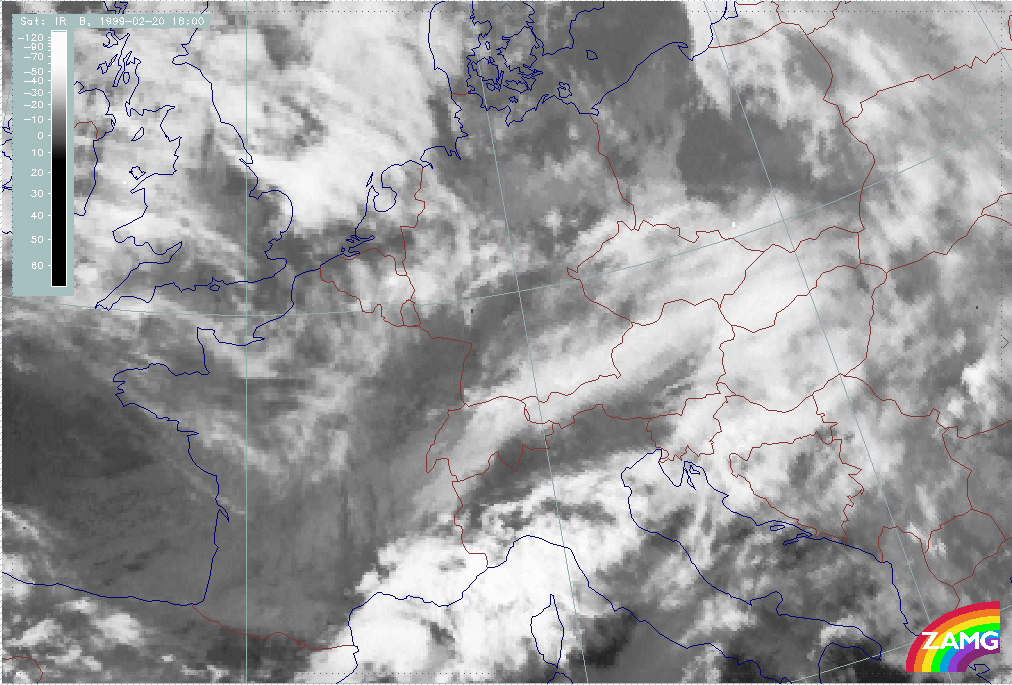
- This leads to a configuration at 20/18.00 UTC (ph705) that is very similar to the one discussed in phase 4, where an Occlusion - like cloud structure appears over the Alps which, in reality, is an effect of remnant cloudiness, Stau Cloudiness and deformation in a area of a secondary frontal zone.
- If the idea of a Split Front can be supported, the southern cloud band corresponds to the thick, multi-layered leading part of the Split Front, whereas the low band in the Alps corresponds to its rearward low cloud part. This can therefore directly be compared with the situation discussed in phase 4 as well as Cold Front crossing - Distinct Lee clearing.
|
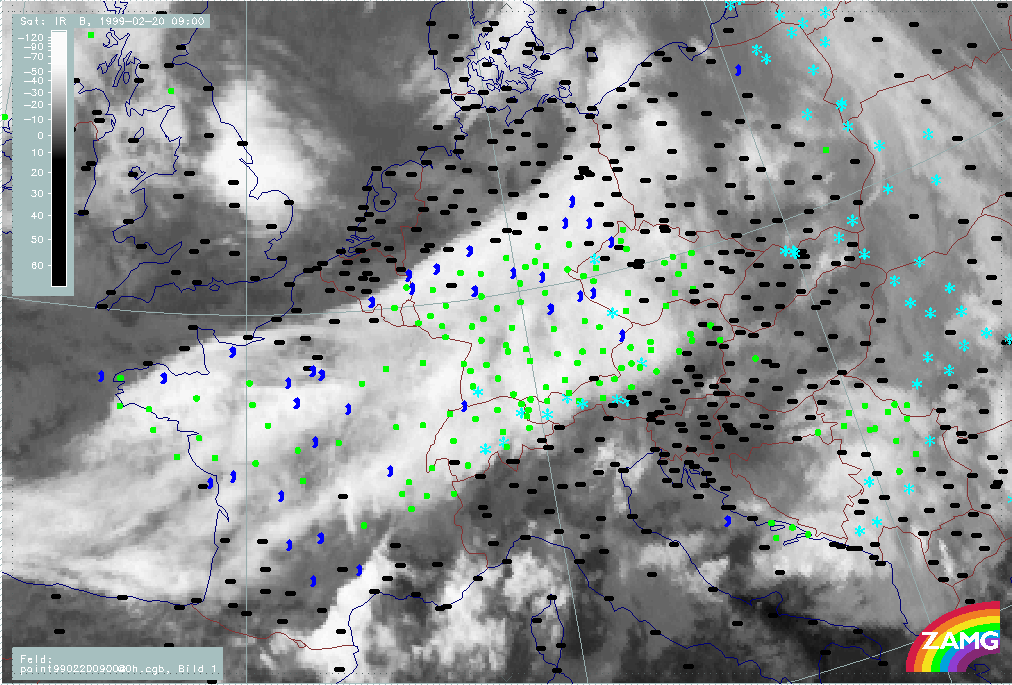
20 February 1999/06.00 UTC - Meteosat IR image; weather events (green: rain and showers, blue: drizzle, cyan: snow, red: thunderstorm with precipitation, purple: freezing rain, orange:
hail, black: no actual precipitation or thunderstorm with precipitation); 20/06.00 - 20/18.00 UTC 3-hourly image loop
|
|
In summary, the following can be noted:
- The rain phase, which already started with the Warm Front passage in the previous phase, continues throughout the whole Cold Front passage.
- Snow events occur only in the highest mountain regions.
|
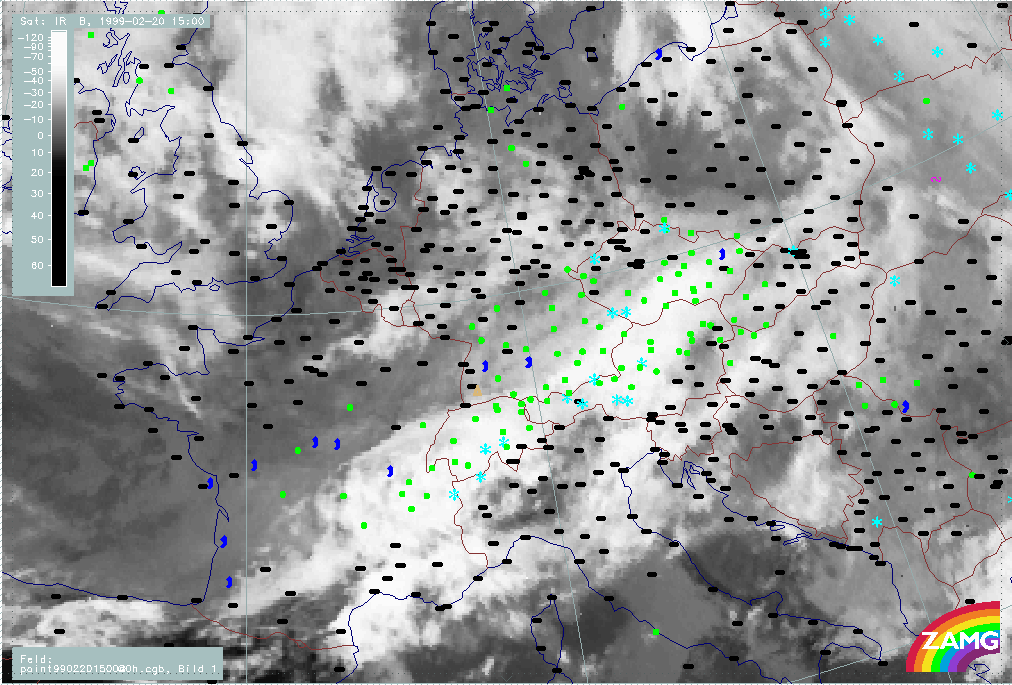
20 February 1999/09.00 UTC - Meteosat VIS image; 20/09.00 - 20/18.00 UTC 3-hourly image loop
|
|
In summary, the following can be noted:
- The 20/12.30 UTC image (ph703v), in particular, indicates that there are two cloud layers in the frontal cloud band; since this is not indicated in the 20/9.00 UTC (ph702v) image, a Split Front process which has already been idemtified from the IR sequence, is also supported by the VIS images.
- At 20/15.00 (ph704v), the transition between the two cloud layers is not so easy to detect as before but there are some indications of a higher cloud border at the northern boundary of Switzerland and through Bavaria. This position agrees well with the corresponding IR image.
For a detailed example see: Cold front crossing
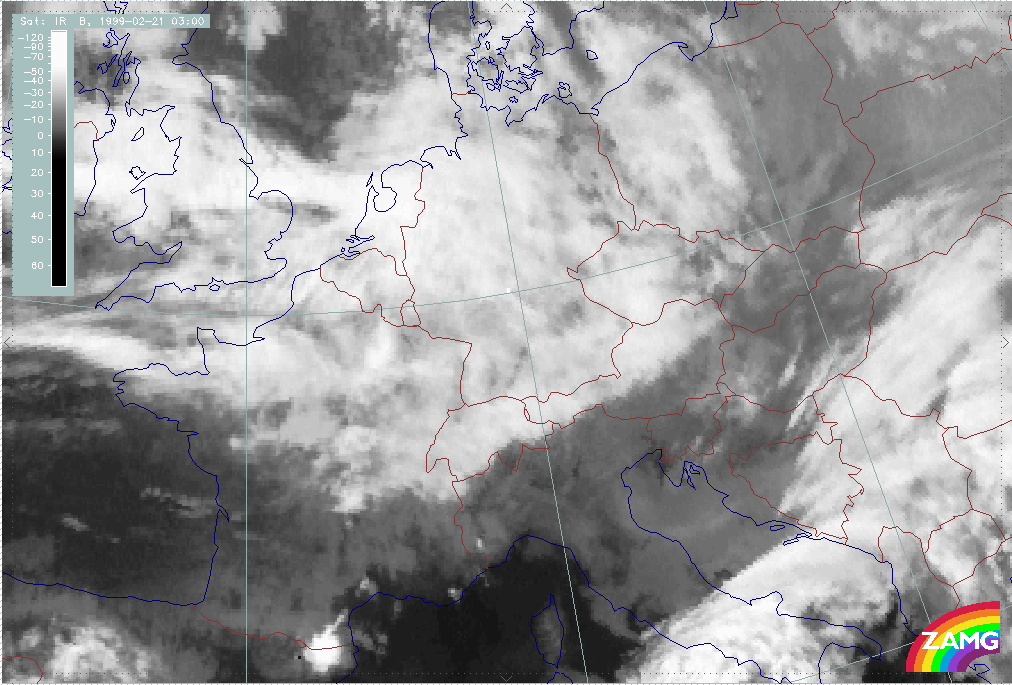
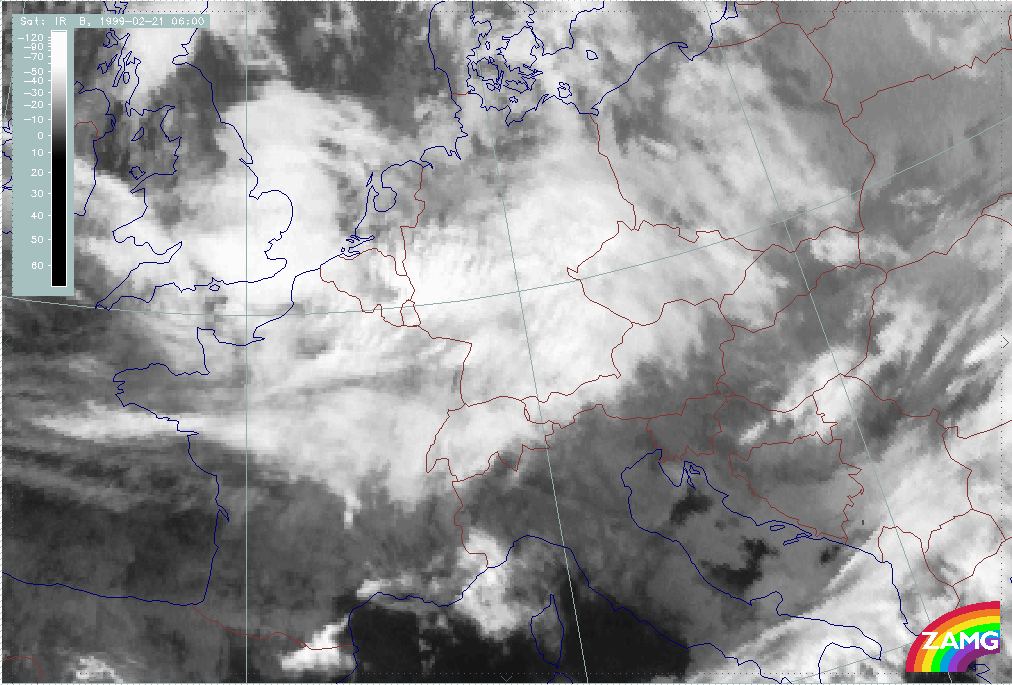
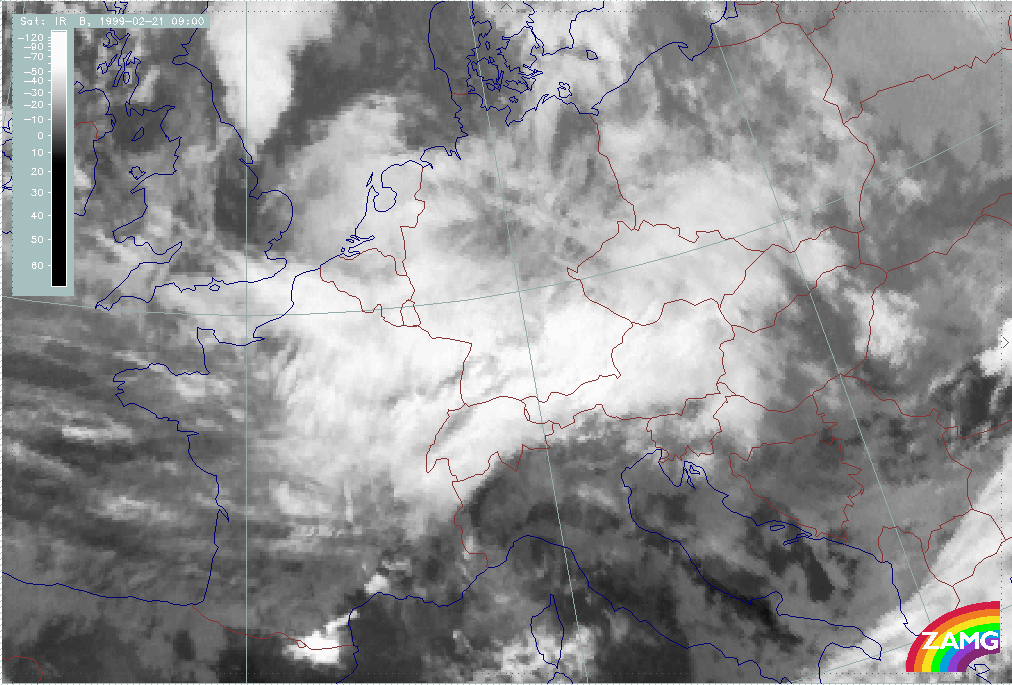
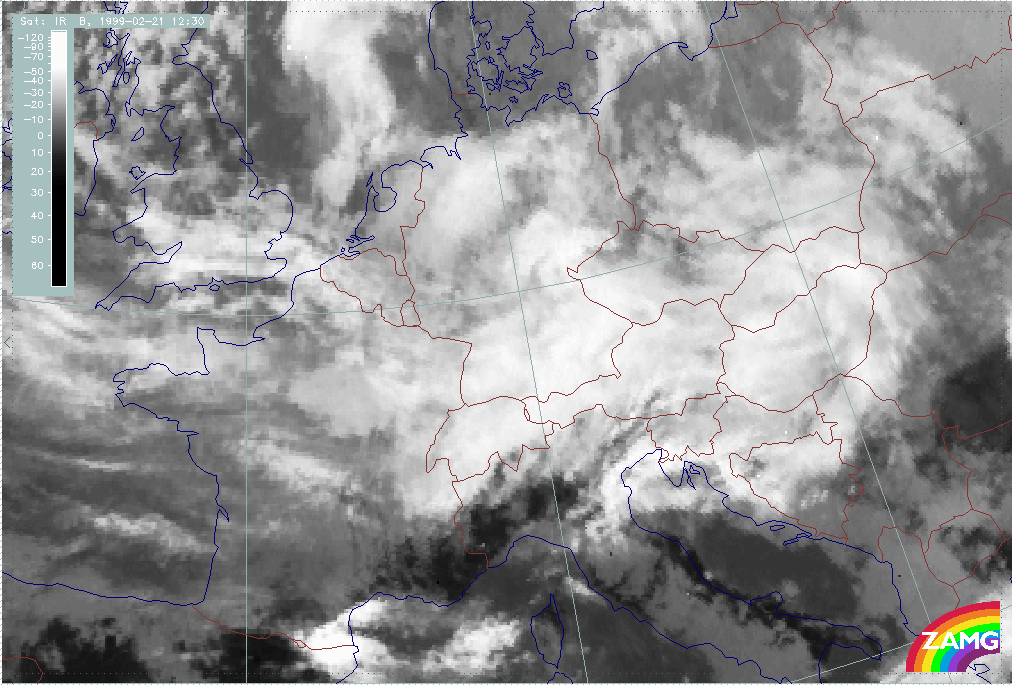
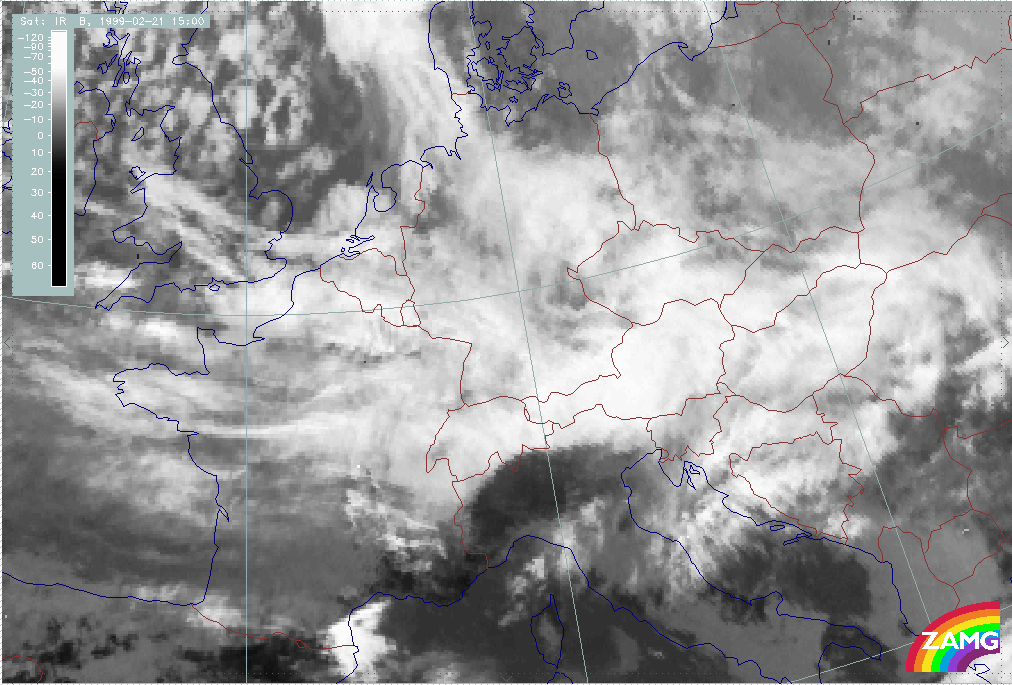
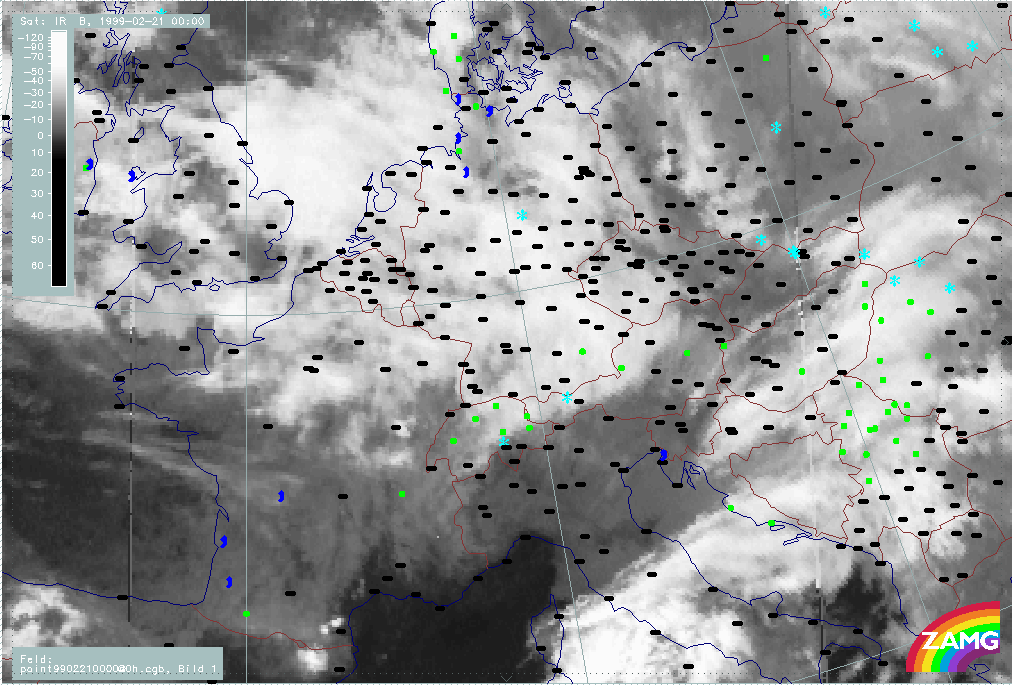
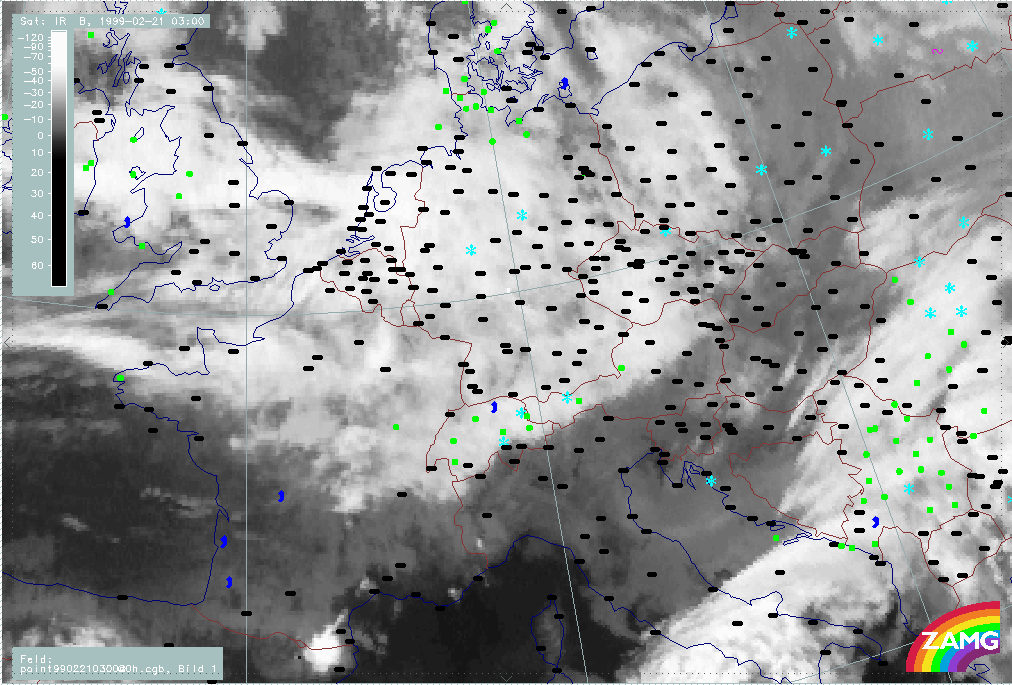
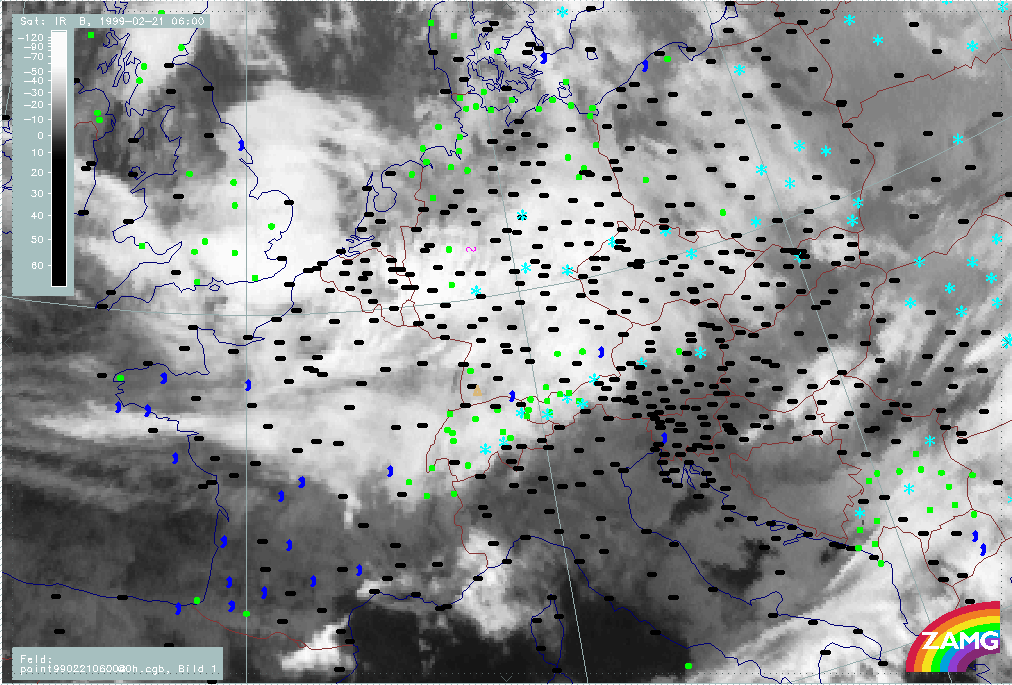
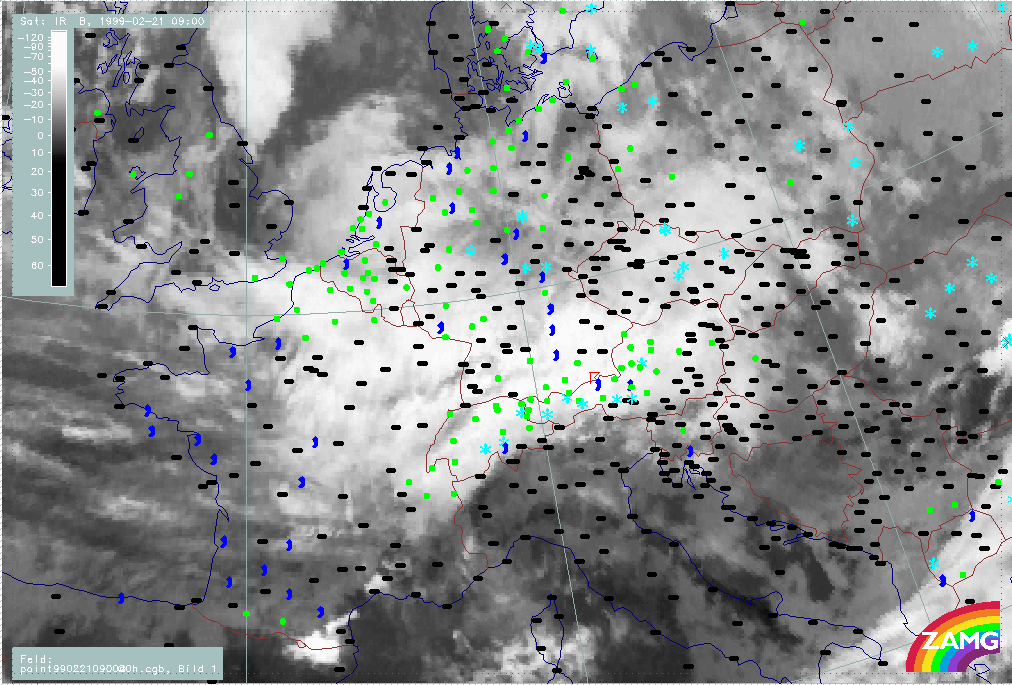
Phase 8: 21 February/00.00 - 21 February/12.00 UTC
This phase is characterised by:
- Two Warm Front Shields crossing
- Probably no frontal conditions
- WA dominates
- Main cloud features: Stau features, Warm Front Shield cloud
|
20 February 1999/21.00 UTC - Meteosat IR image; 20/21.00 - 21/15.00 UTC 3-hourly image loop
|
|
In summary, the following can be noted:
- At 20/21.00 UTC (ph801), a Warm Front cloud band extends from the North Sea to Bavaria.
- Between 21/00.00 and 03.00 UTC (ph802 - ph803), the Warm Front clouds have intensified north of and over the Alps; the southern Stau Cloud edge corresponds to the highest mountain chains.
- Between 21/06.00 and 12.00 UTC (ph804 - ph806), clouds undergo several changes and are not always typical of a Warm Front Shield; there might also be a Cold Front - like boundary to the north. The identification as Warm Front cloudiness was made using TA in the numerical model.
- There is a better indication for a warm Front Shield in cloudiness extending from France and Germany over the Alpine region at 21/15.00 UTC (ph807). The southern edge of the Stau cloud is more to the south than at the beginning of this phase, namely over S. Tyrol (N. Italy).
|
20 February 1999/21.00 UTC - Meteosat IR image; weather events (green: rain and showers, blue: drizzle, cyan: snow, red: thunderstorm with precipitation, purple: freezing rain, orange:
hail, black: no actual precipitation or thunderstorm with precipitation); 20/21.00 - 21/15.00 UTC 3-hourly image loop
|
|
In summary, the following can be noted:
- From the beginning of this phase till 21/03.00 UTC (ph801p - ph803p) there are only some isolated reports of precipitation within and north of the Alps, mostly of rain.
- Also almost no precipitation is reported further north over Germany.
- From 21/06.00 UTC (ph804p) on, precipitation is much more frequent and extends from the whole Alpine mountain range northward to Germany.
- At 21/09.00 UTC (ph805p), a thunderstorm report near the Tyrolean - Bavarian border is rather surprising and does not fit well with the idea of a Warm Front passage.
- More snow events appear again only during the last phase.
|
20 February 1999/09.00 UTC - Meteosat VIS image; 21/09.00 - 21/15.00 UTC 3-hourly image loop
|
|
In summary, the following can be noted:
- VIS images do not add information about additional features.
- Stau Cloud is quite distinct.
For a detailed example see: Classical Warm Front shields
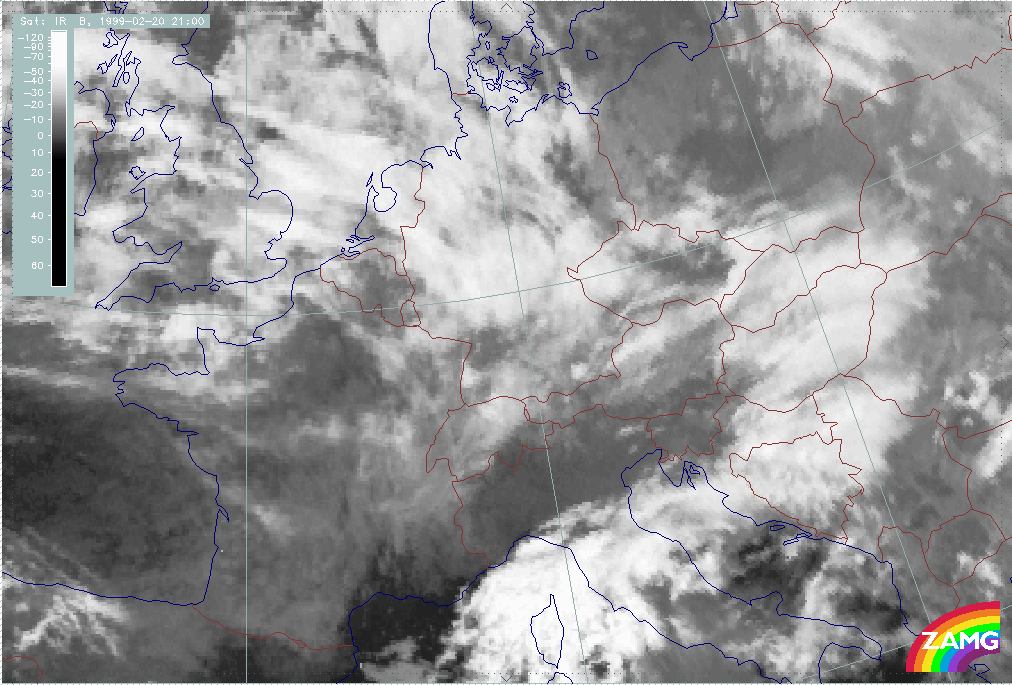
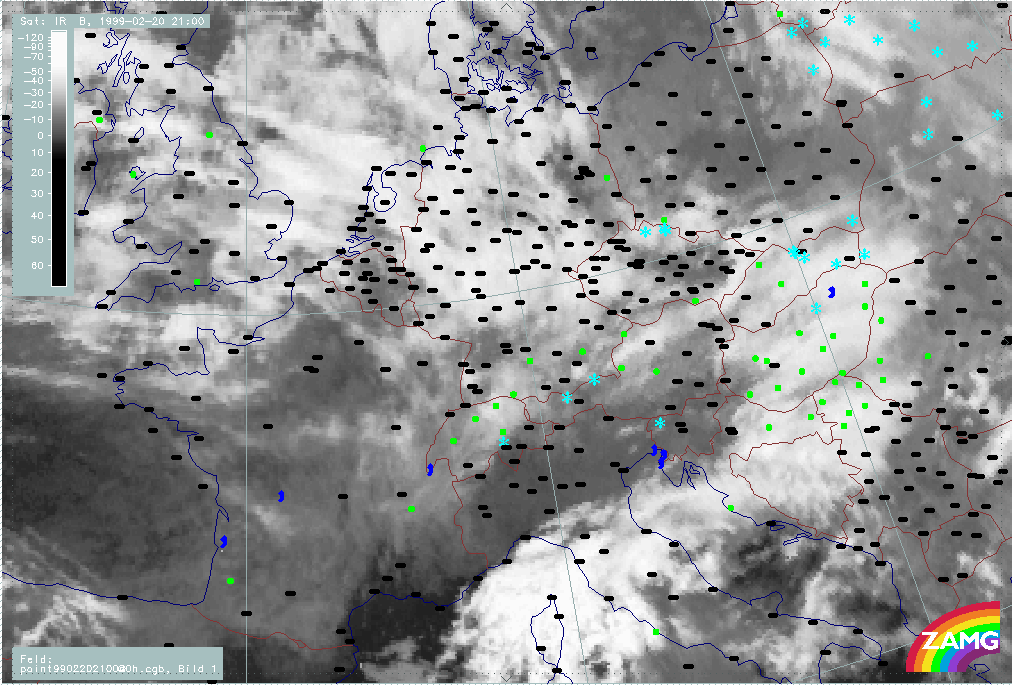
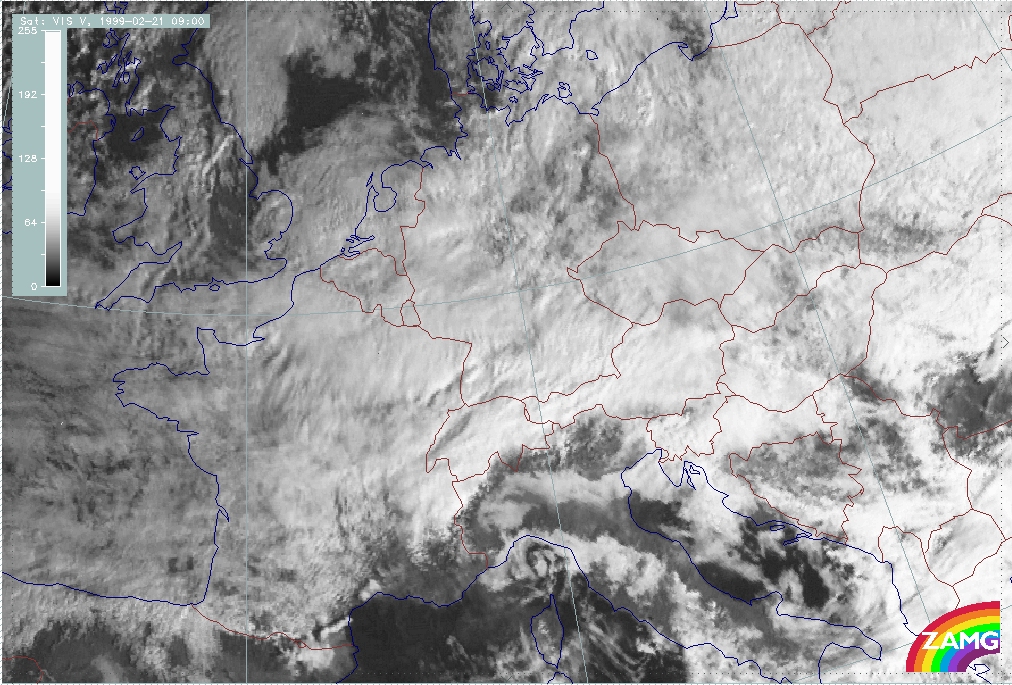
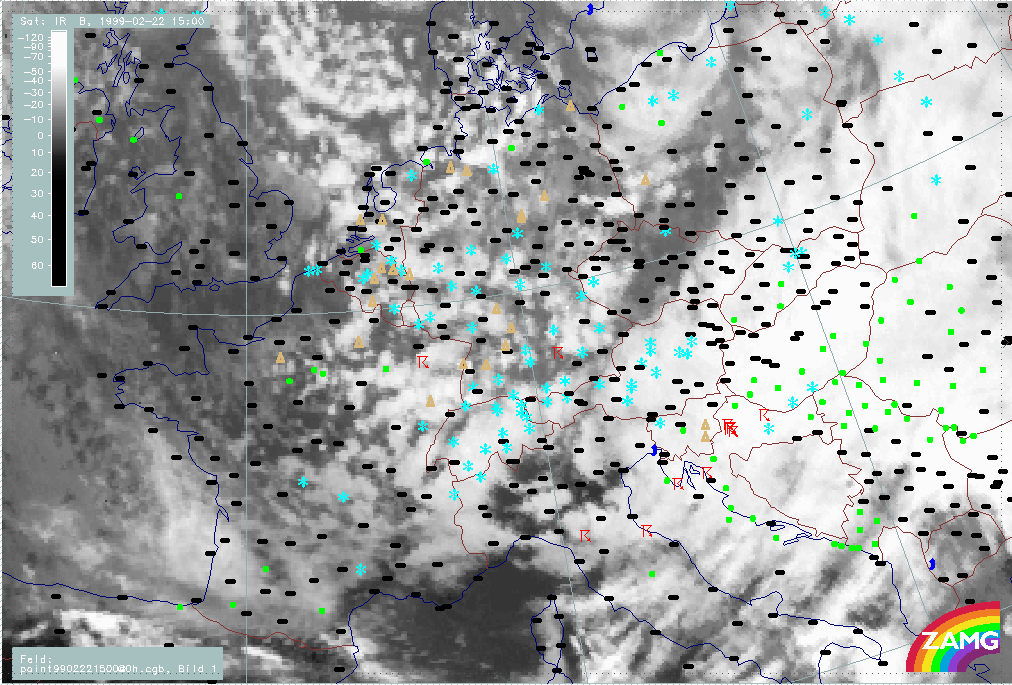
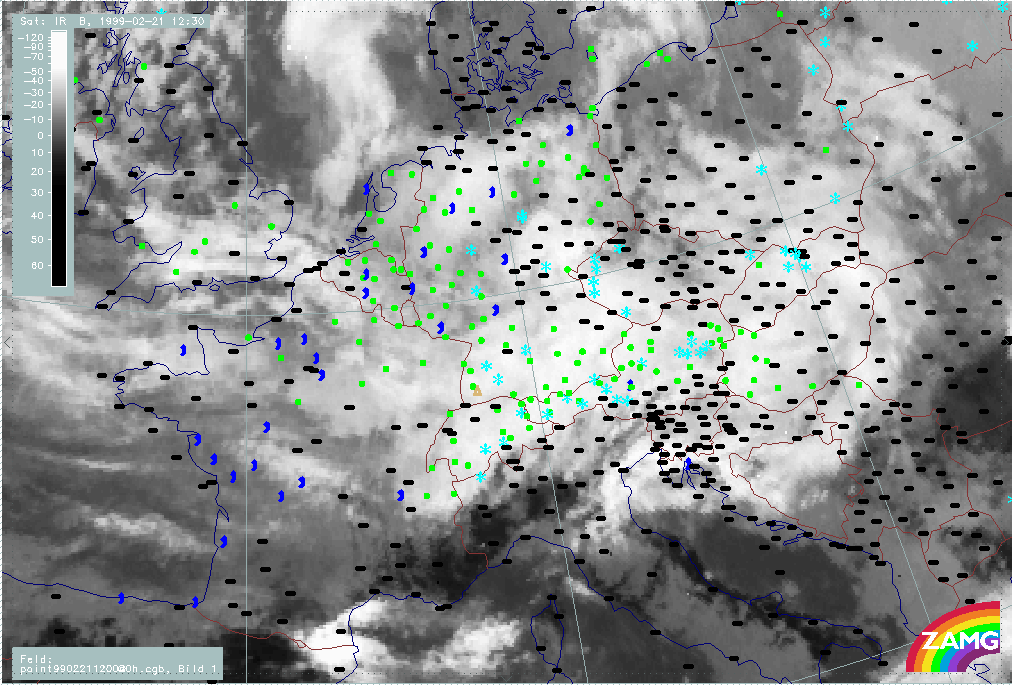
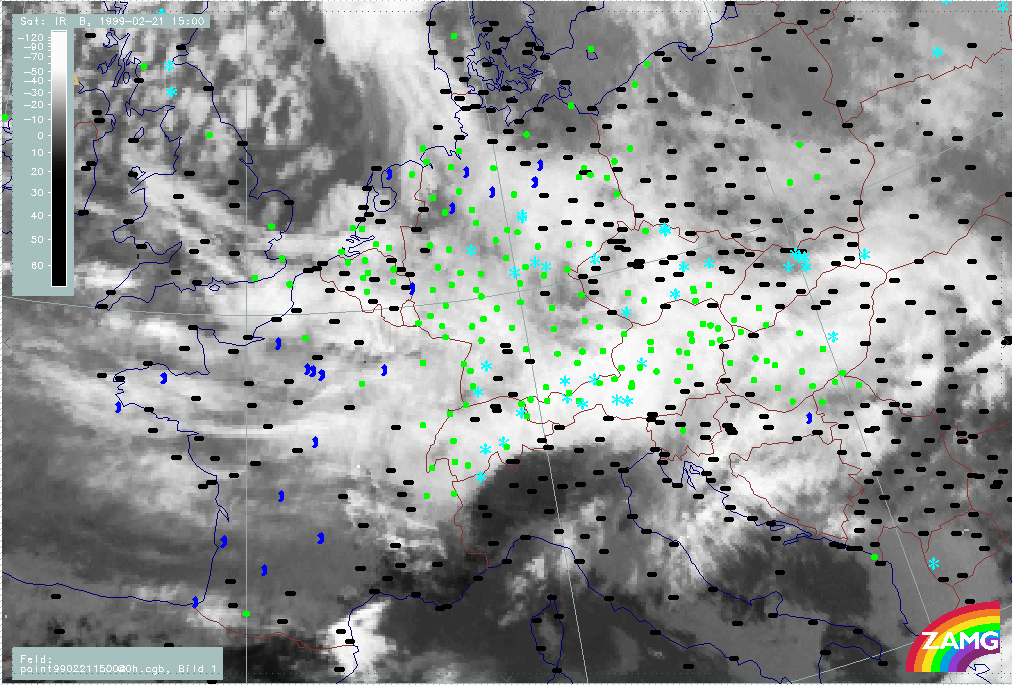
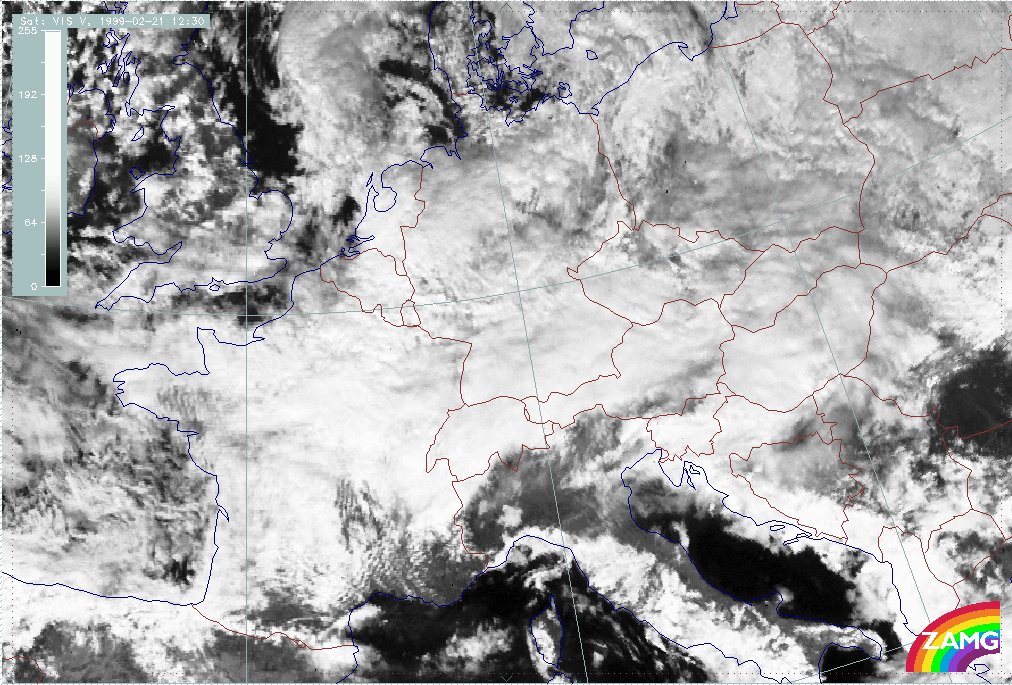
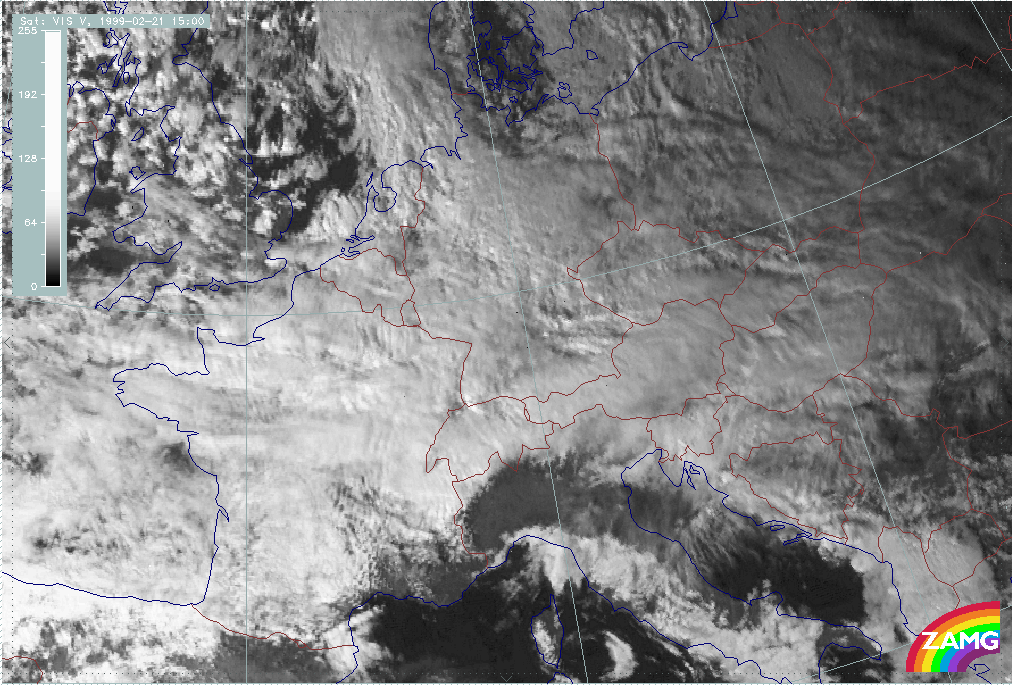
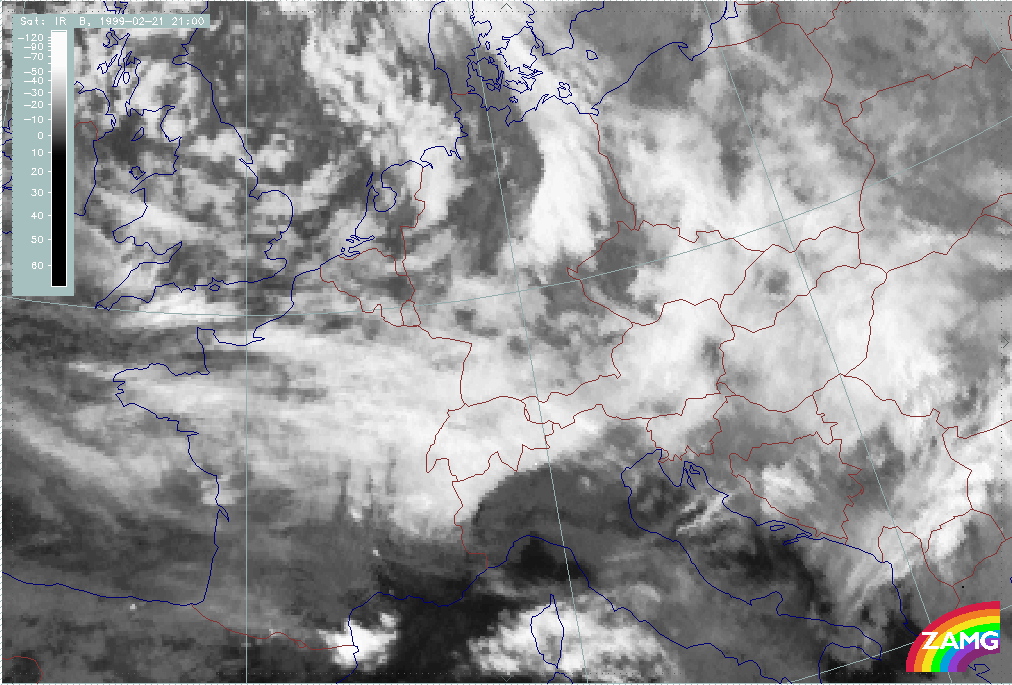
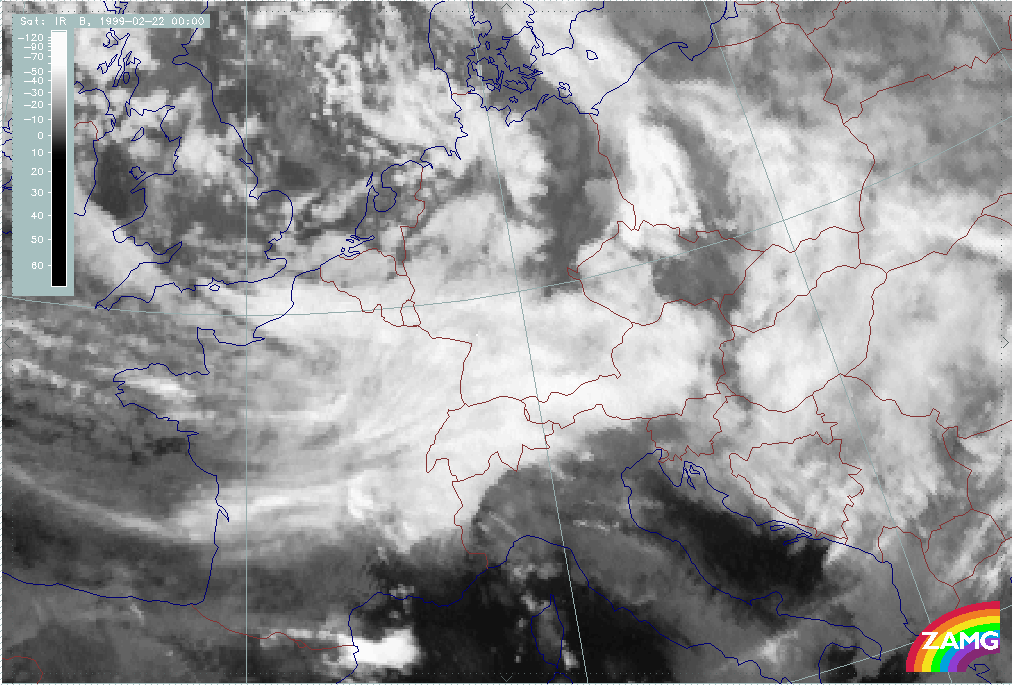
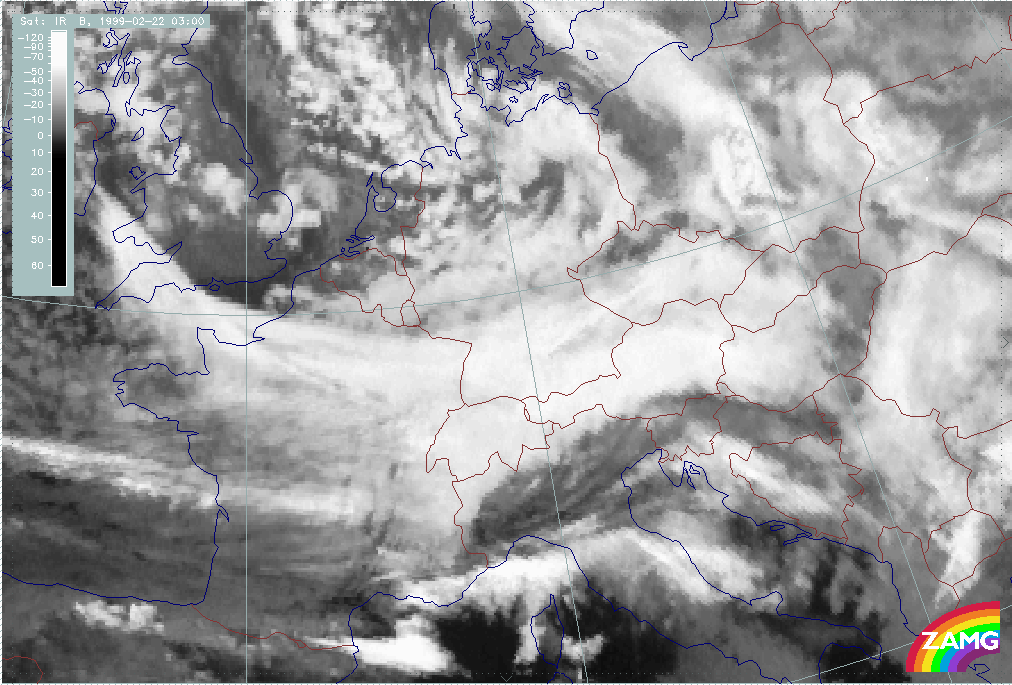
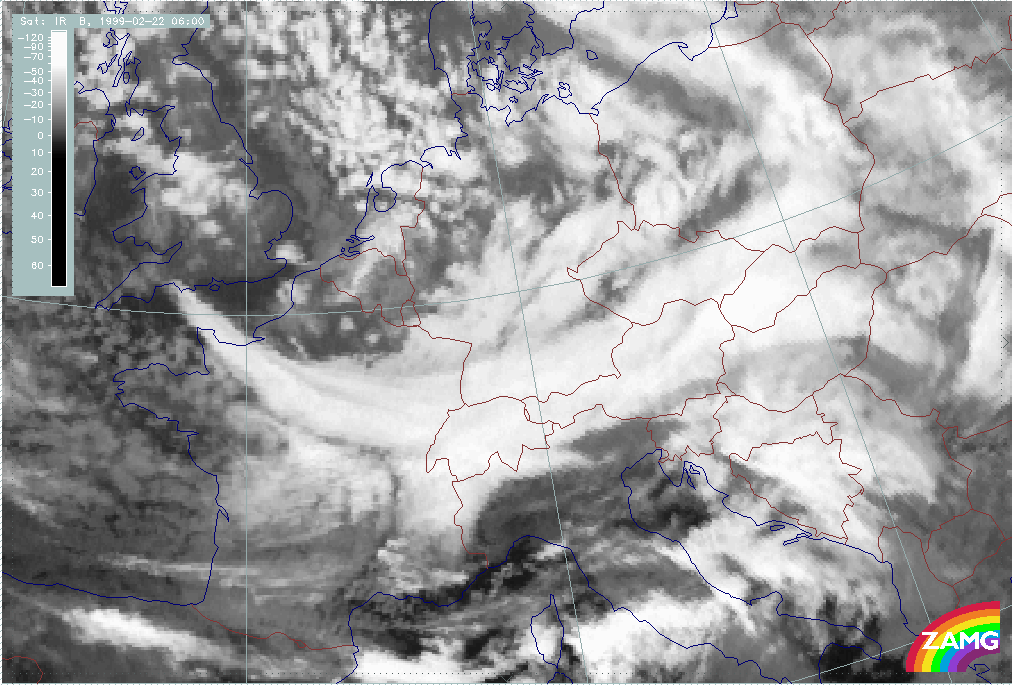
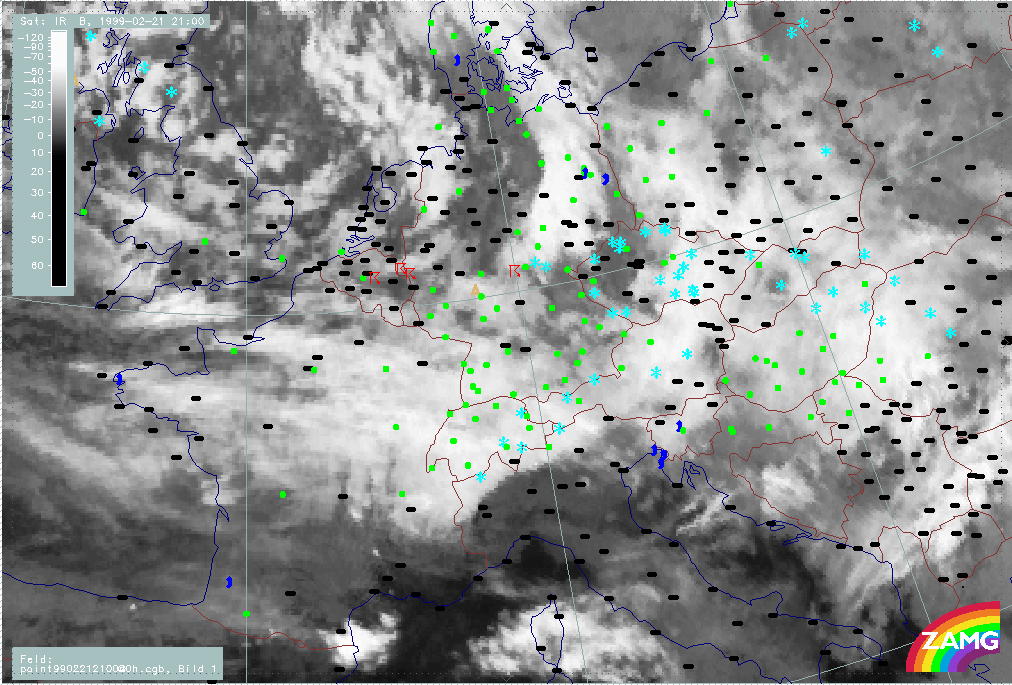
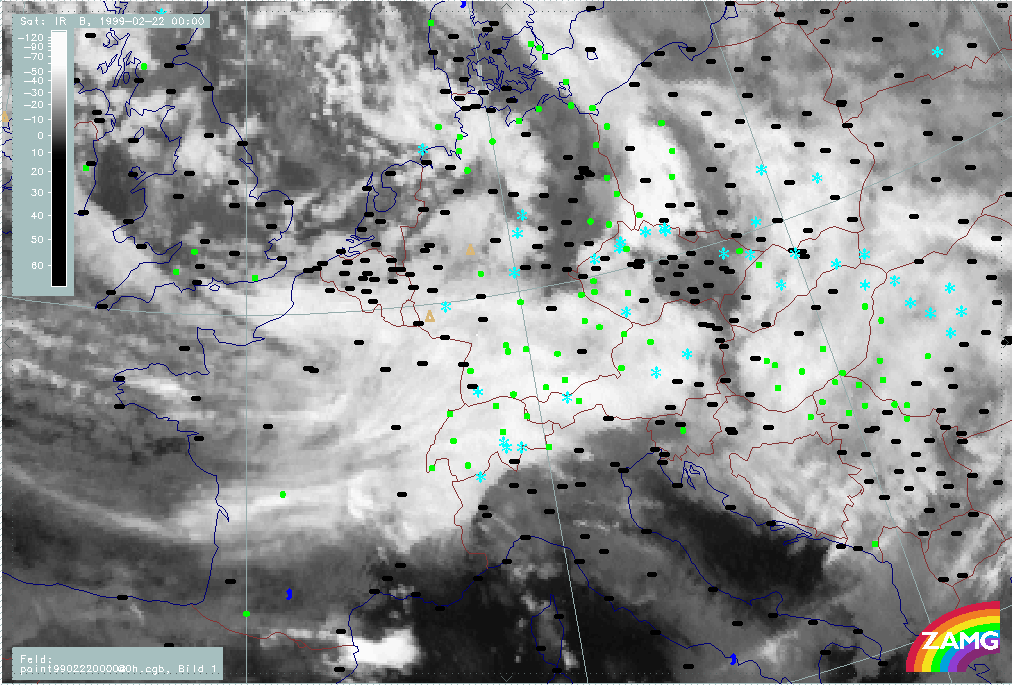
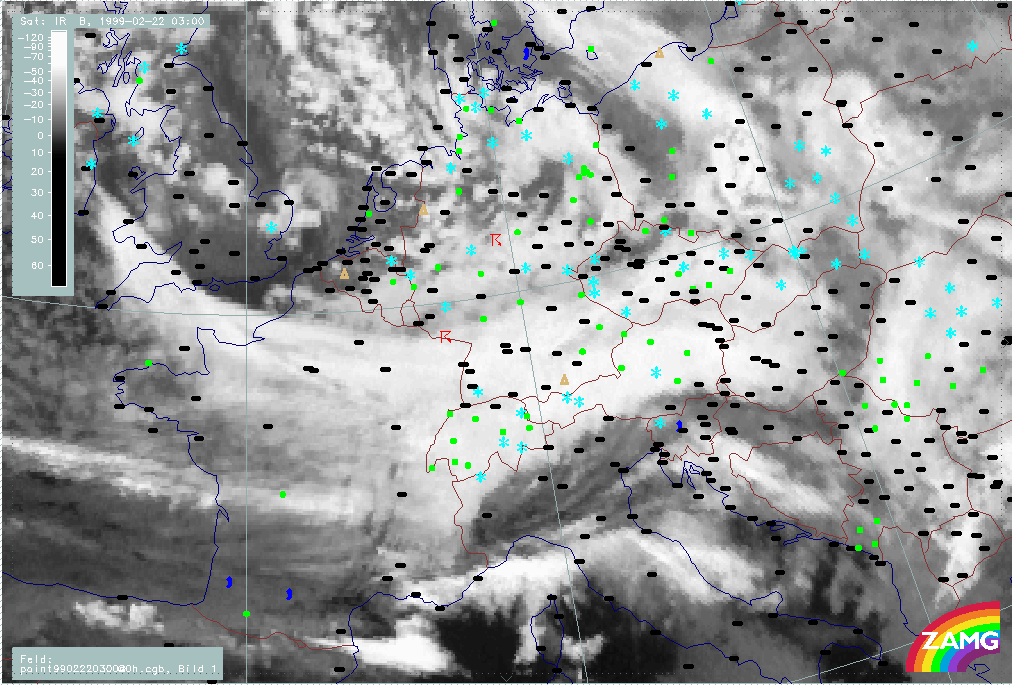
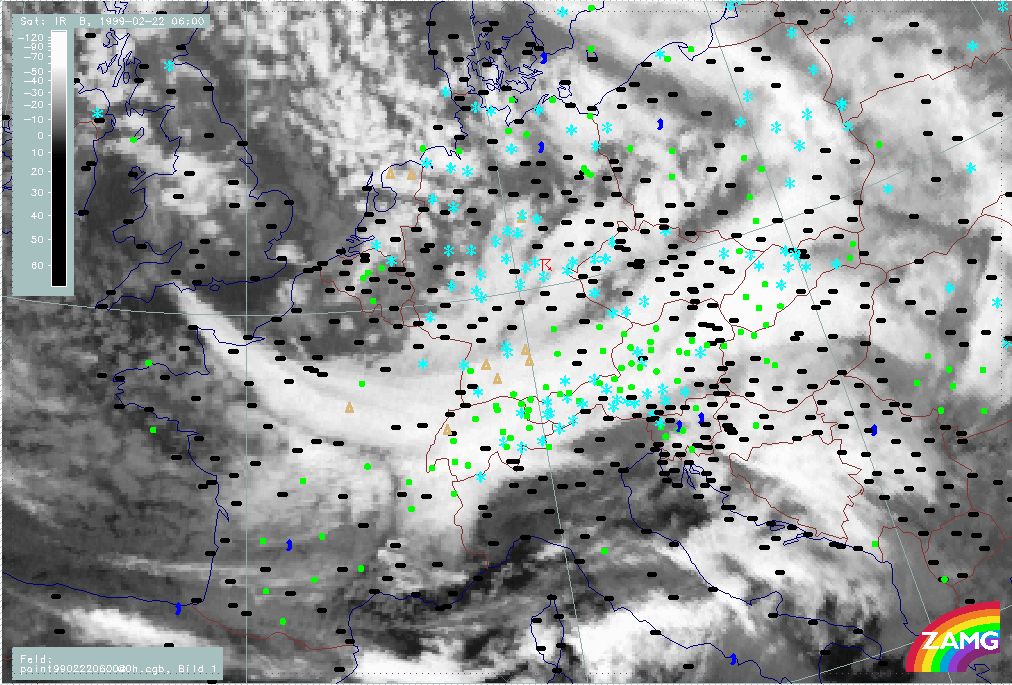
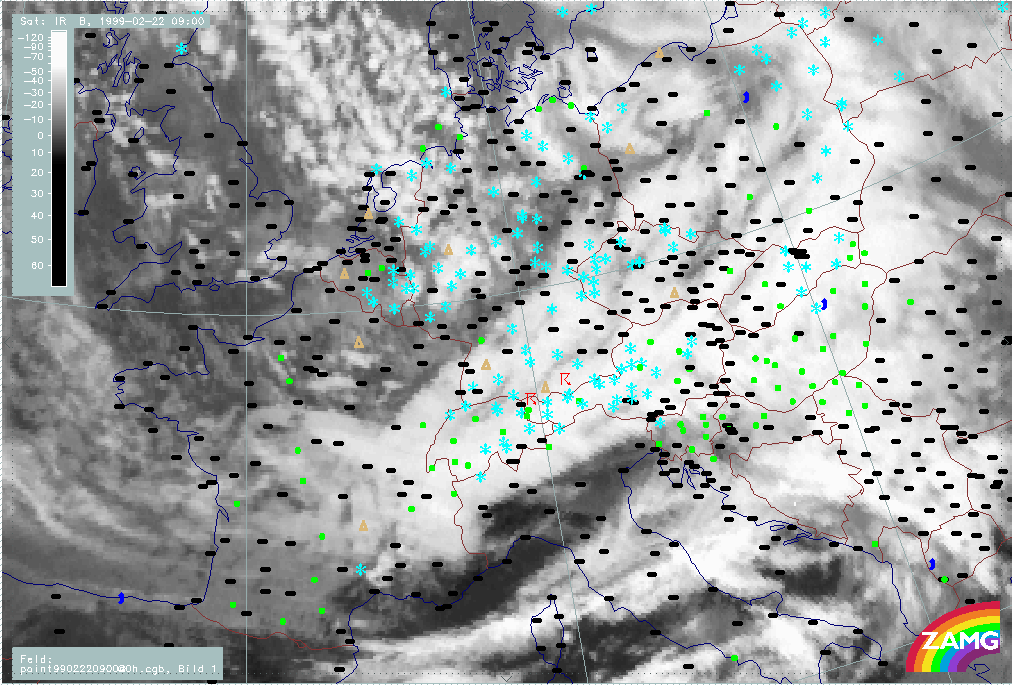
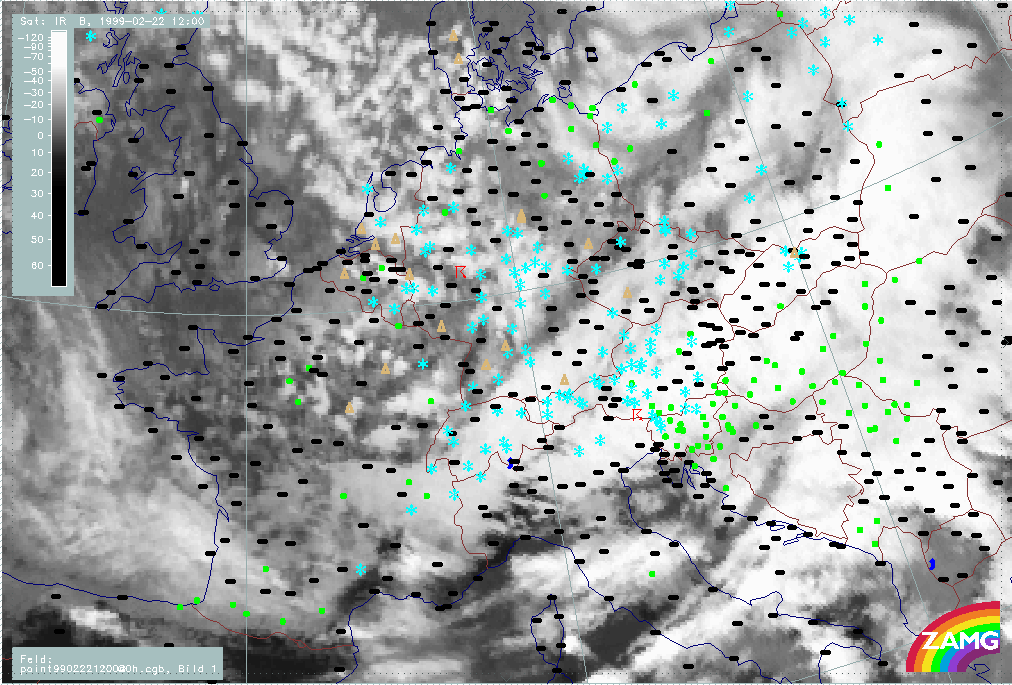
Phase 9: 21 February/18.00 - 22 February/12.00 UTC
This phase is characterised by:
- Crossing of (at least) two Cold Fronts and/or Commas with very intensive thickness gradient
- CA dominates
- PVA important
- Main cloud features: Stau features, Cold Front bands, Cold Front passage
|
20 February 1999/18.00 UTC - Meteosat IR image; 21/18.00 - 22/12.00 UTC 3-hourly image loop
|
|
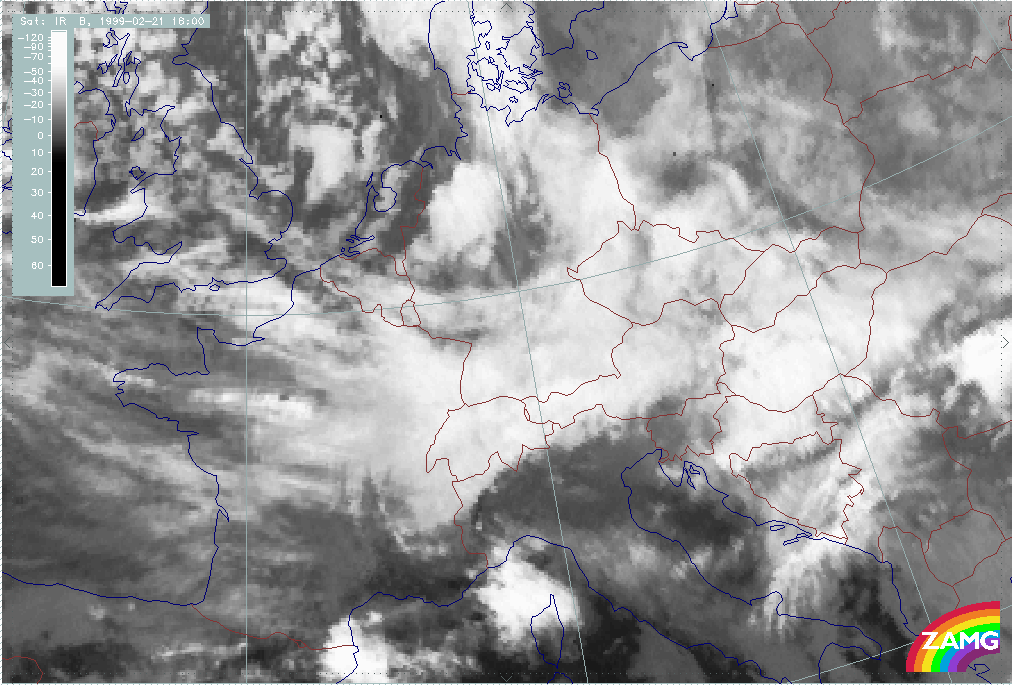
In summary, the following can be noted:
- There are two passages of Cold Front and/or cold air features during this phase:
- First system crosses the Alps at 21/21.00 UTC (ph902);
- Second system crosses the Alps at 22/03.00 UTC (ph904);
- Between these two phases (21/21.00 - 22/03.00 UTC) a Warm Front - like feature in the eastern parts can be observed.
- During the phase 21/18.00 - 22/00.00 UTC (ph901 - ph904), distinct Stau Cloud at the W. Alps can be observed; cloudiness even lies to the south of the highest mountain chains over N. Italy.
- The second Cold Front passage (ph904 - ph907) is very pronounced with a double structure:
- frontal cloud band and
- Extended cold air features behind.
- Merging of the Cold Front cloud band and cold air features over the Alps at 22/12.00 UTC (ph904) with very intensive convective cloud structures.
|
20 February 1999/18.00 UTC - Meteosat IR image; weather events (green: rain and showers, blue: drizzle, cyan: snow, red: thunderstorm with precipitation, purple: freezing rain, orange:
hail, black: no actual precipitation or thunderstorm with precipitation); 21/18.00 - 22/12.00 UTC 3-hourly image loop
|
|
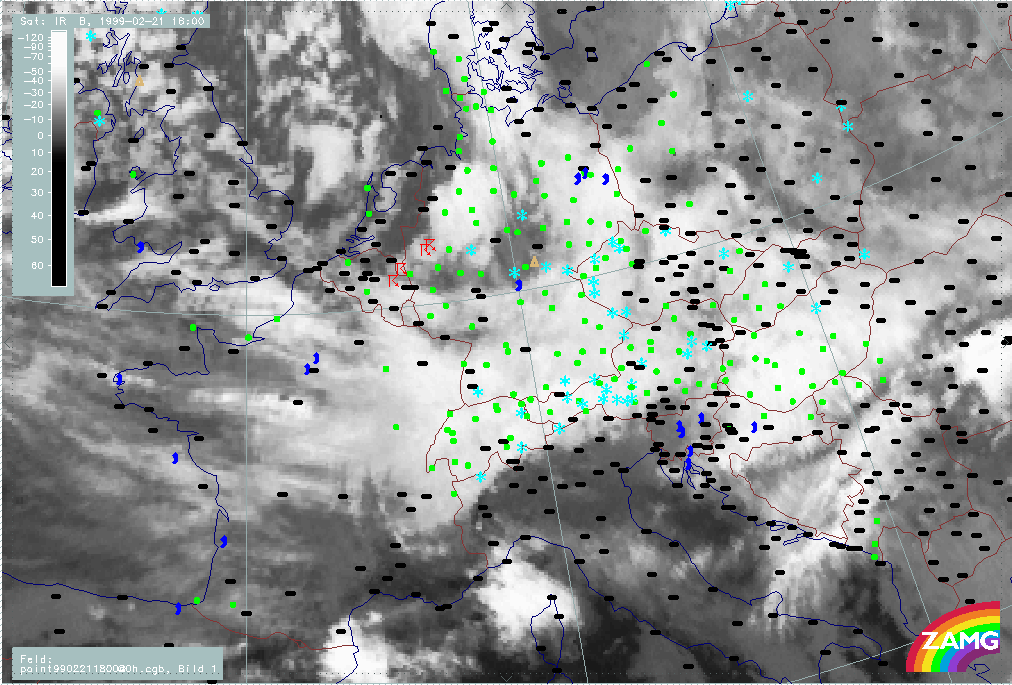
In summary, the following can be noted:
- During the first half of the phase, rain predominates within the Alpine region; snow is restricted to the highest mountain chains.
- From 22/06.00 UTC on (ph905p) (connected to the second Cold Front passage), snow events intensify first over Austria, later over Switzerland. At 22/09.00 UTC (ph906p) the rain phase has ended.
- There are many thunderstorms: during the first phase within the Cold Air Cloudiness. Within the second phase, with the intensive Cold Front passage, there are thunderstorms at the boundary between Cold Front cloudiness and Cold Air Cloud phenomena; at 22/09.00 UTC (ph906p), thunderstorms appear in Tyrol, at 22/12.00 UTC (ph907p) in Carinthia. These thunderstorms also indicate the passage of the Cold Front cloud band across the Alps.
|
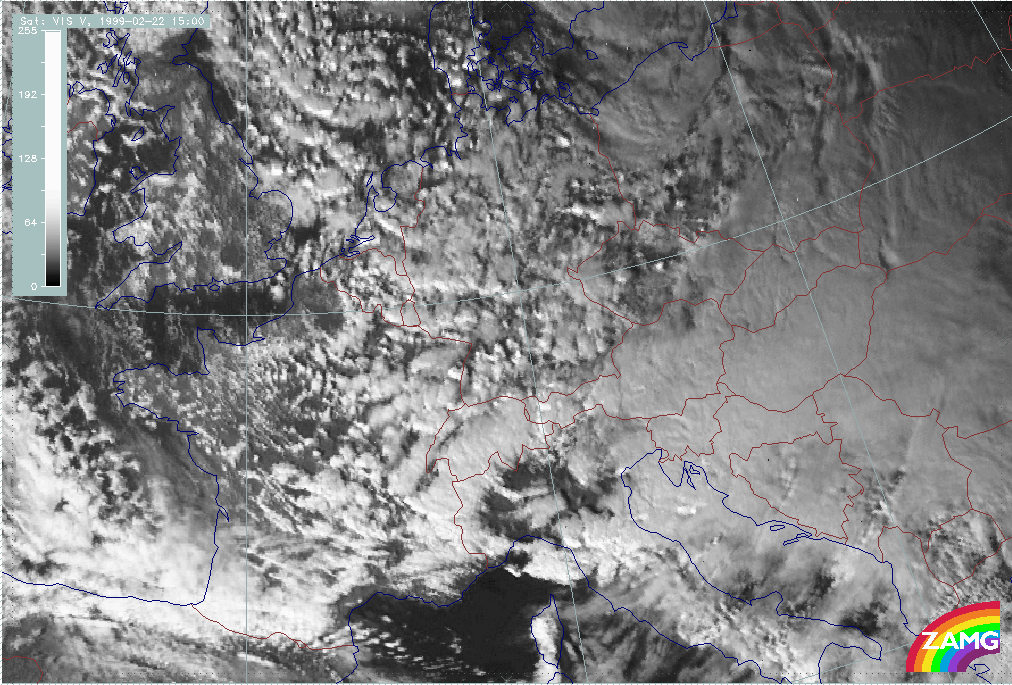
22 February 1999/09.00 UTC - Meteosat VIS image; 22/09.00 - 22/15.00 UTC 3-hourly image loop
|
|
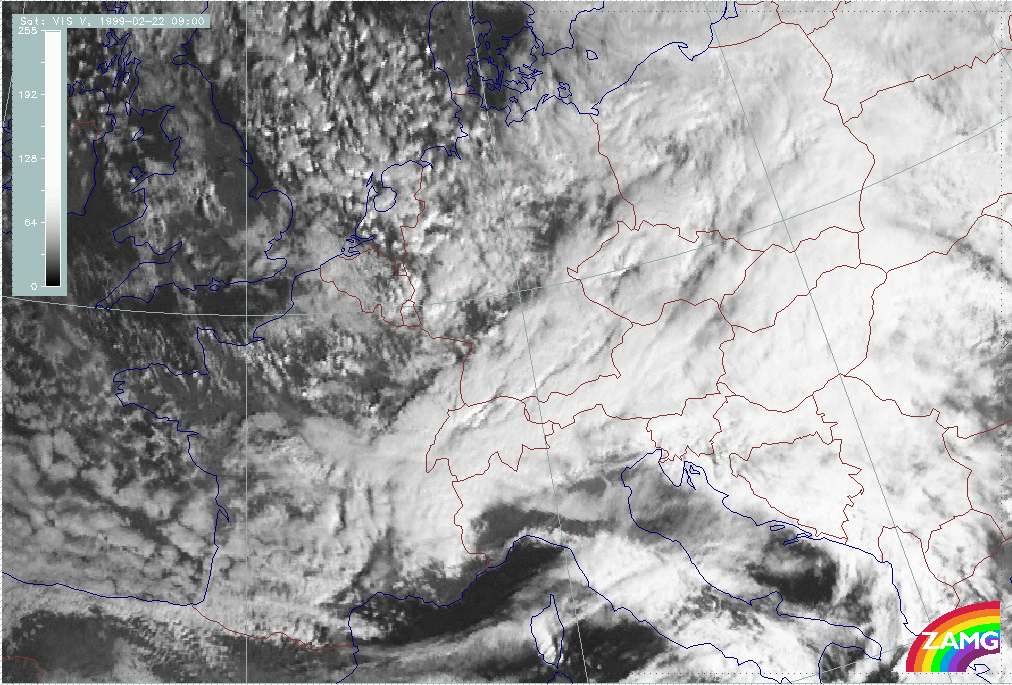
In summary, the following can be noted:
- The VIS images of 22/09.00 and 12.00 UTC reveal the double structure of cloudiness very well: the frontal cloud band itself as well as the Cold Air Cloudiness to the rear.
- There is a small stripe between the two features with some holes in cloudiness.
- The thunderstorm reports are along the northern boundary of the Cold Front band and directly at the "stripe" between the two systems.
For a detailed example see: Cold front crossing
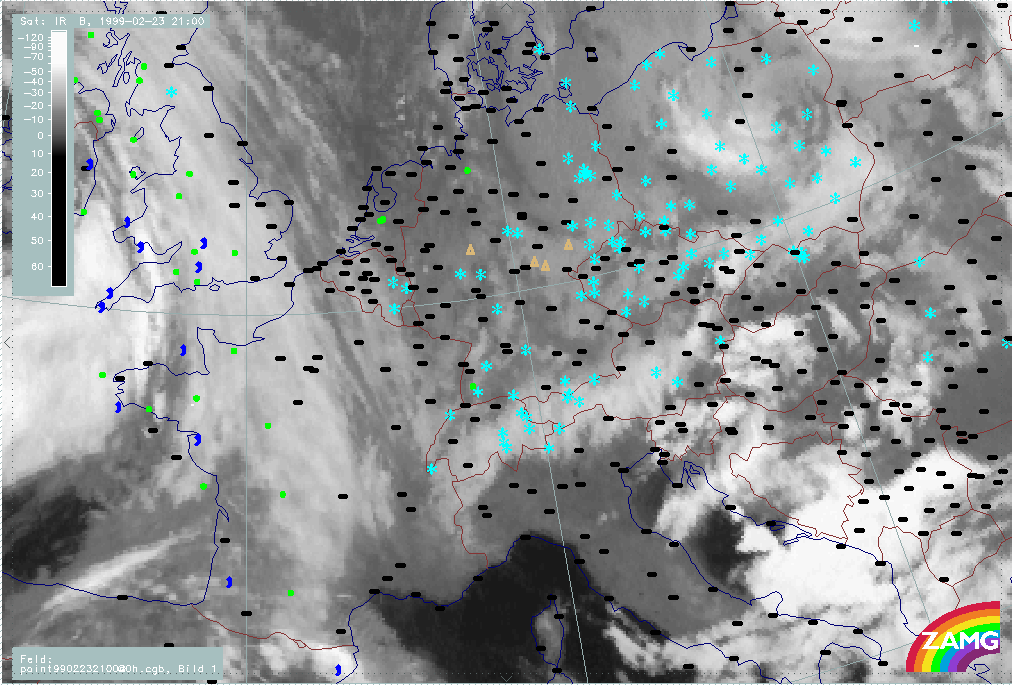
Phase 10: 22 February/15.00 - 23 February/18.00 UTC
This phase is characterised by:
- Thickness trough
- Non frontal conditions
- WA/CA boundary immediately north of Alps but CA dominates within the Alps
- Main cloud features: Stau features, Lee features, Comma feature
|
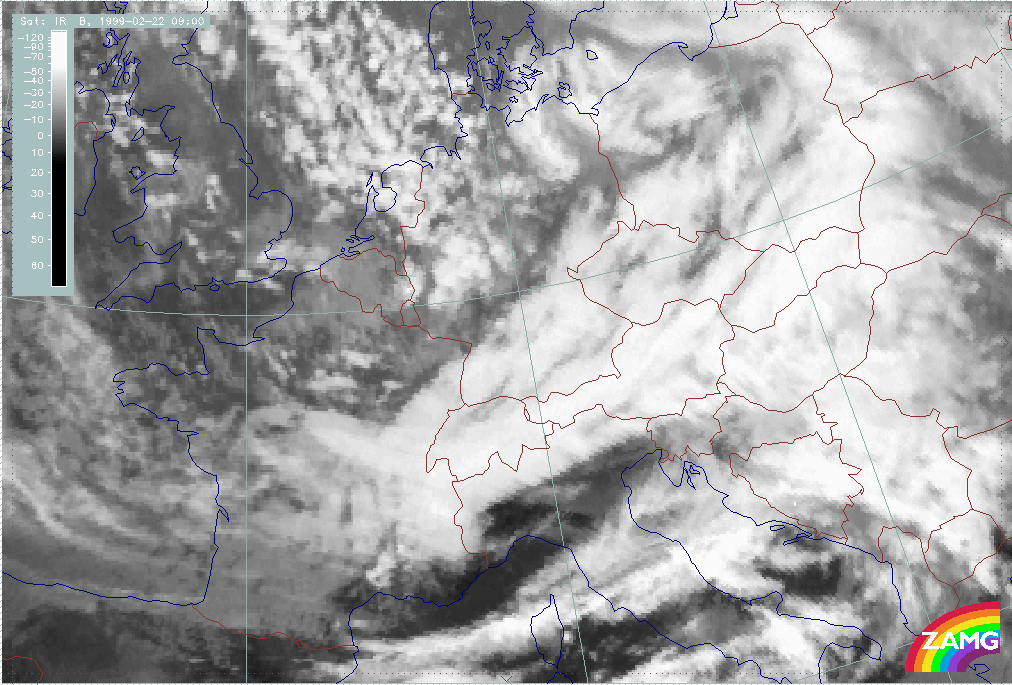
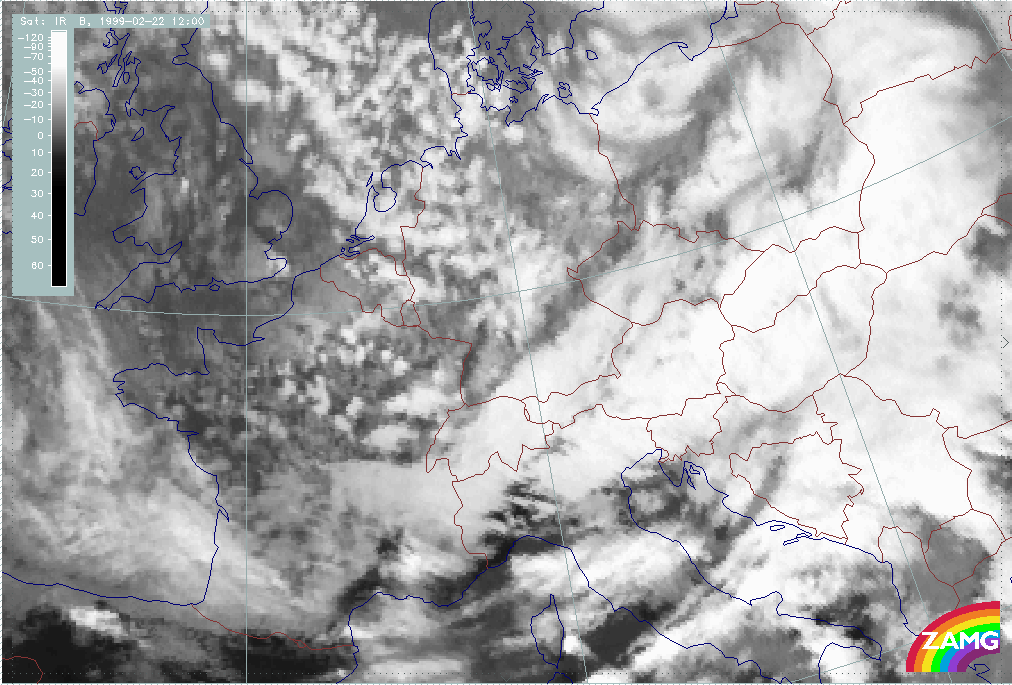
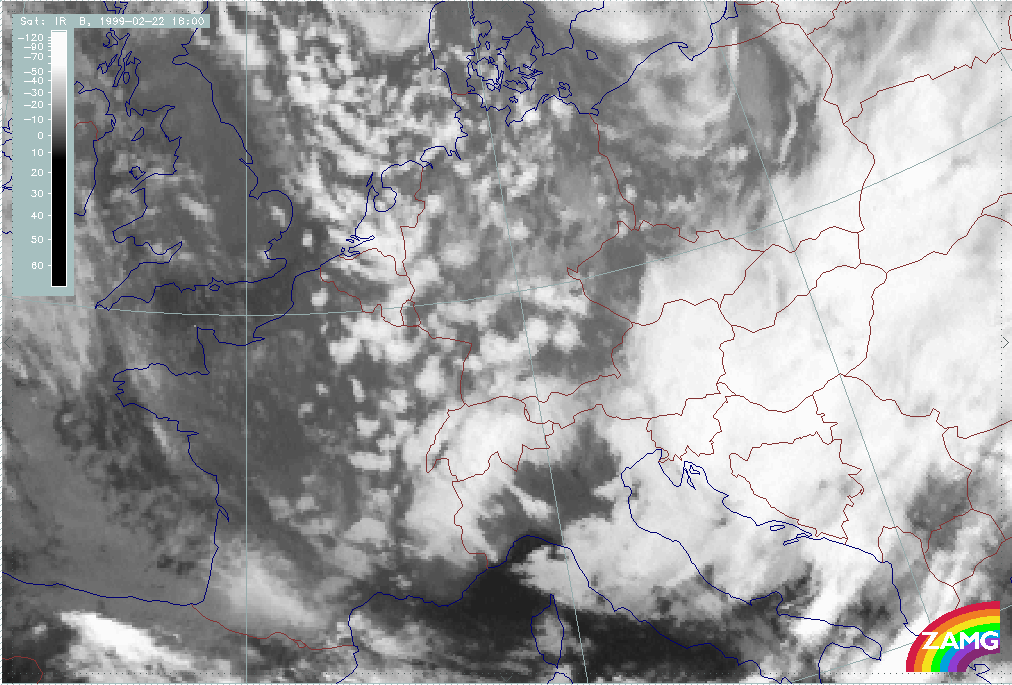
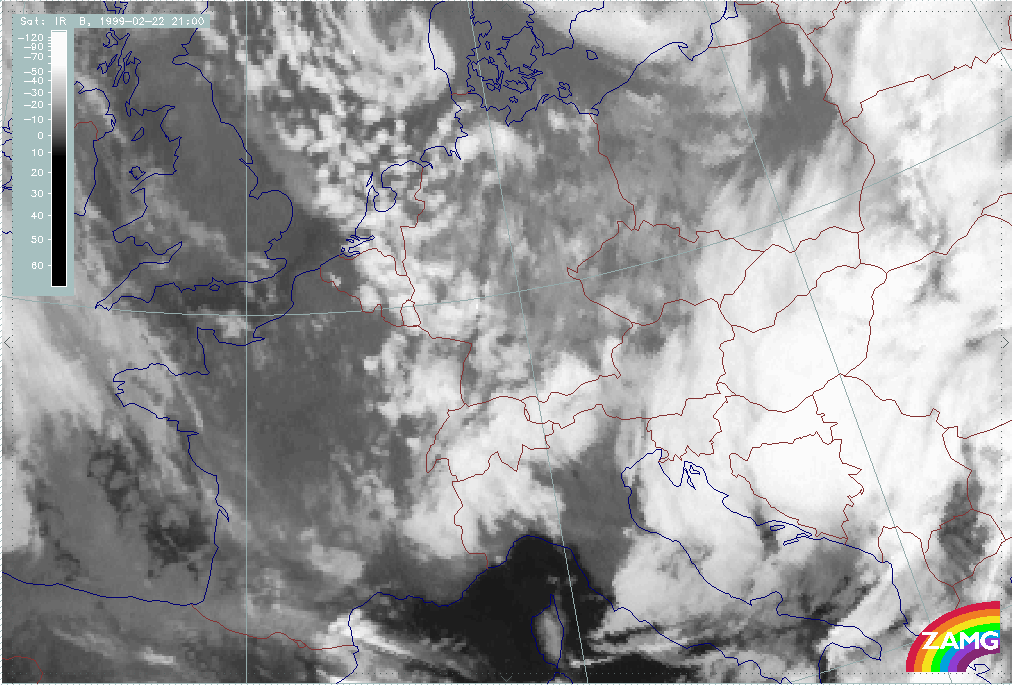
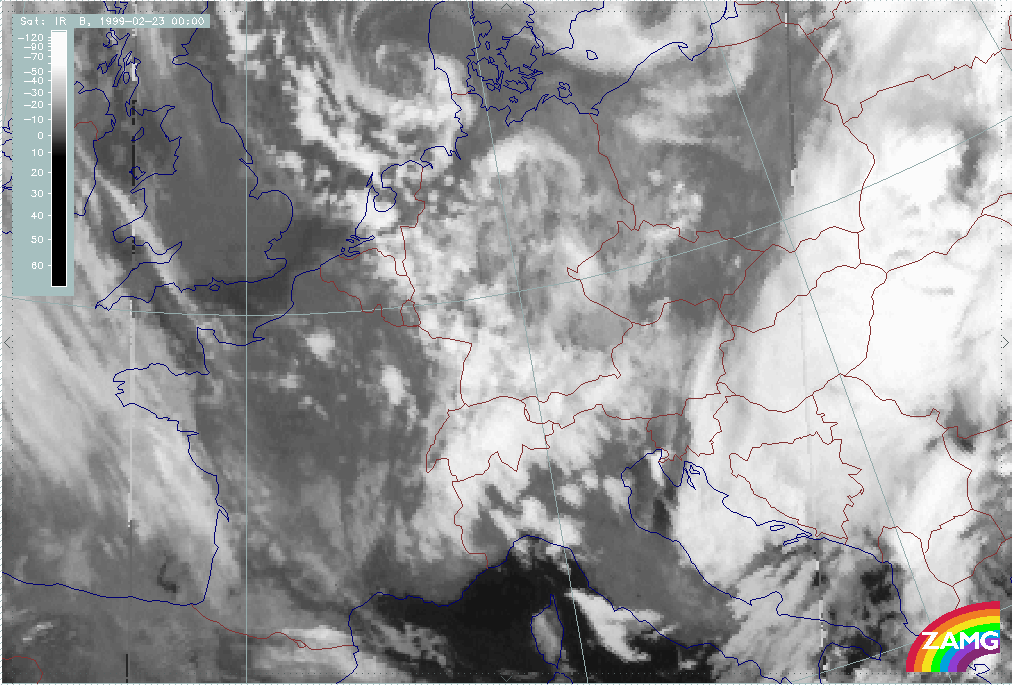
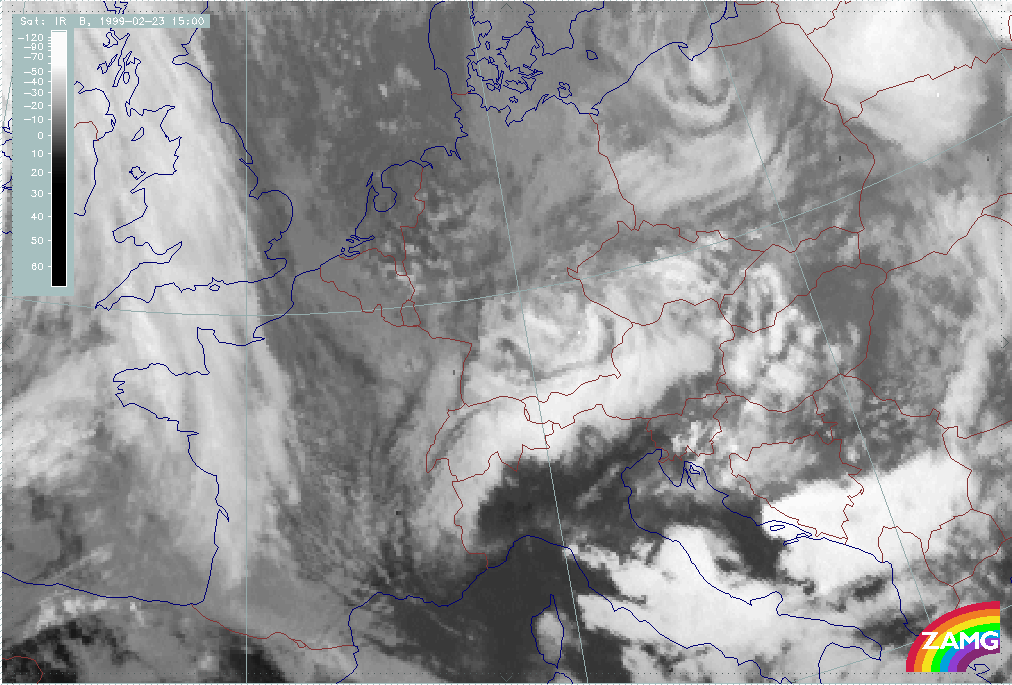
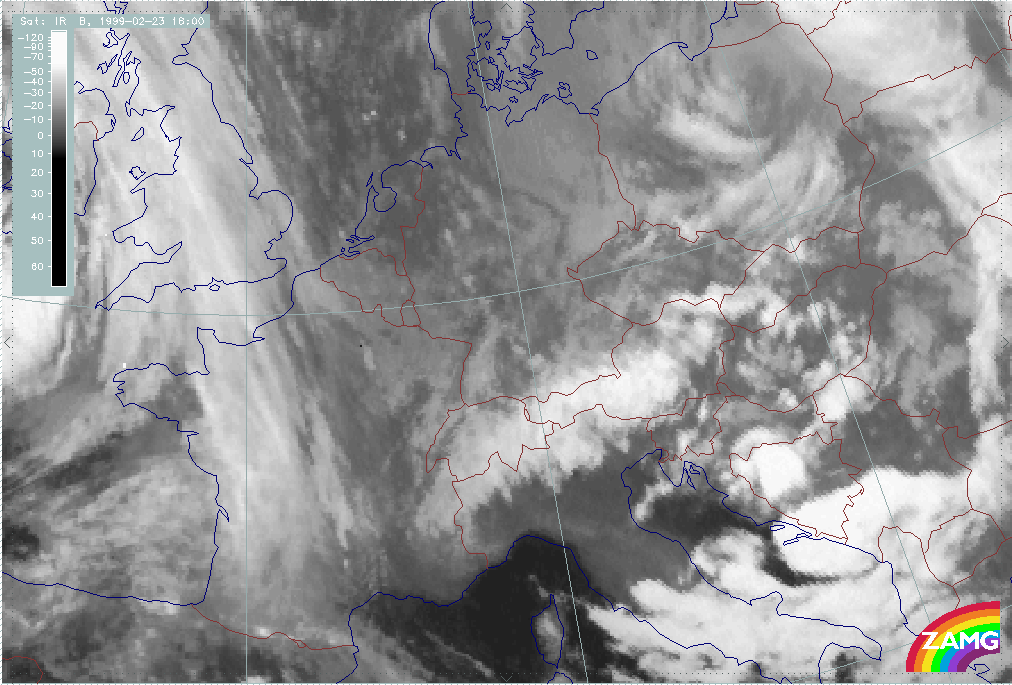
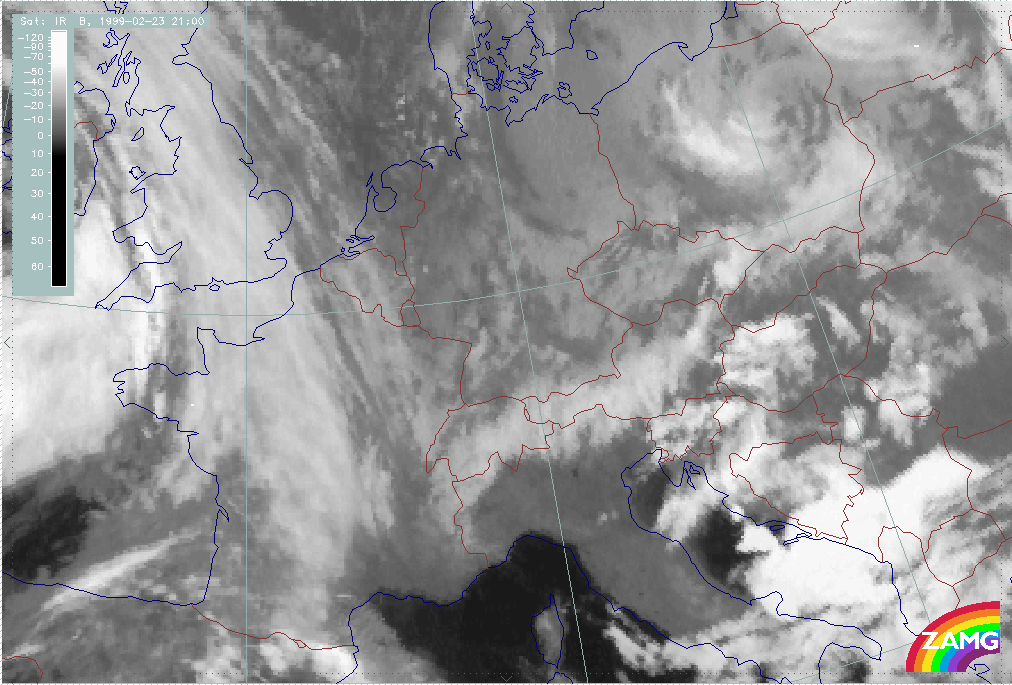
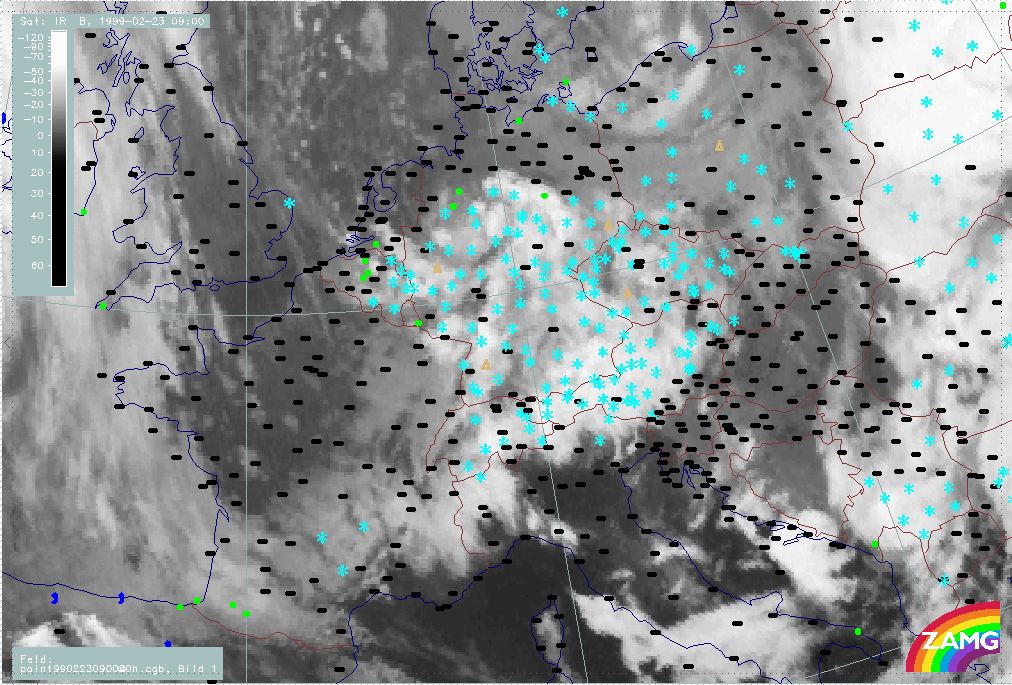
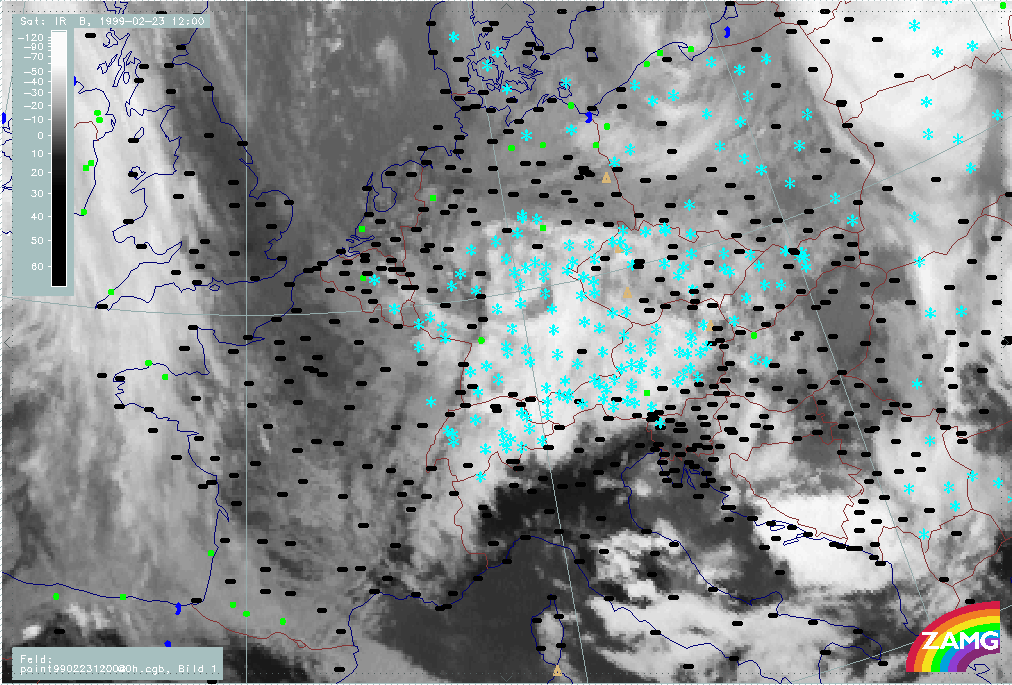
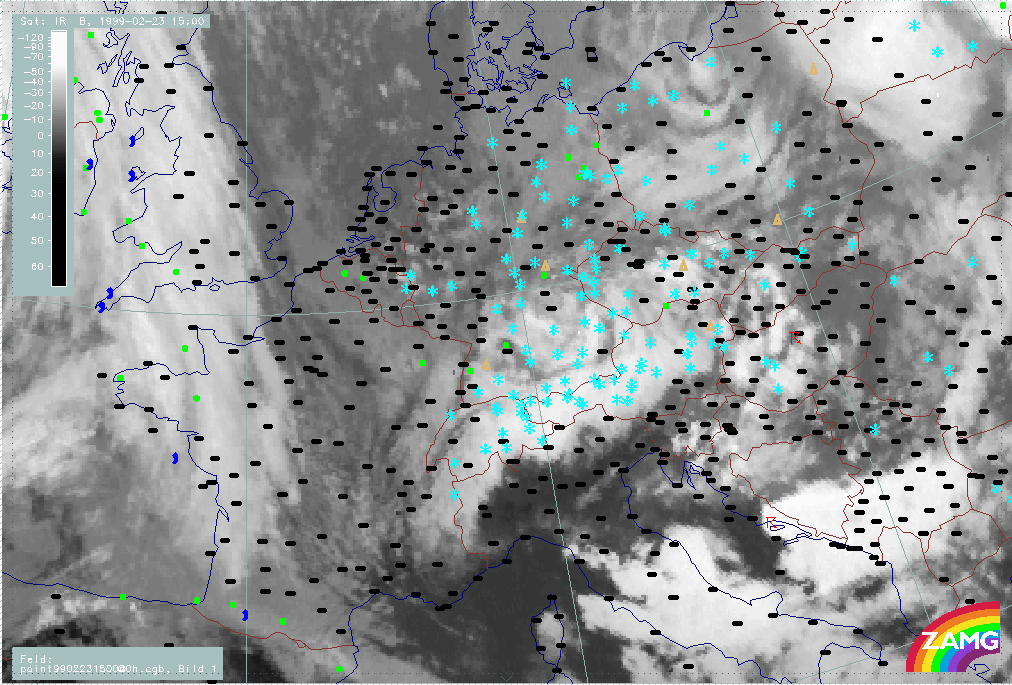
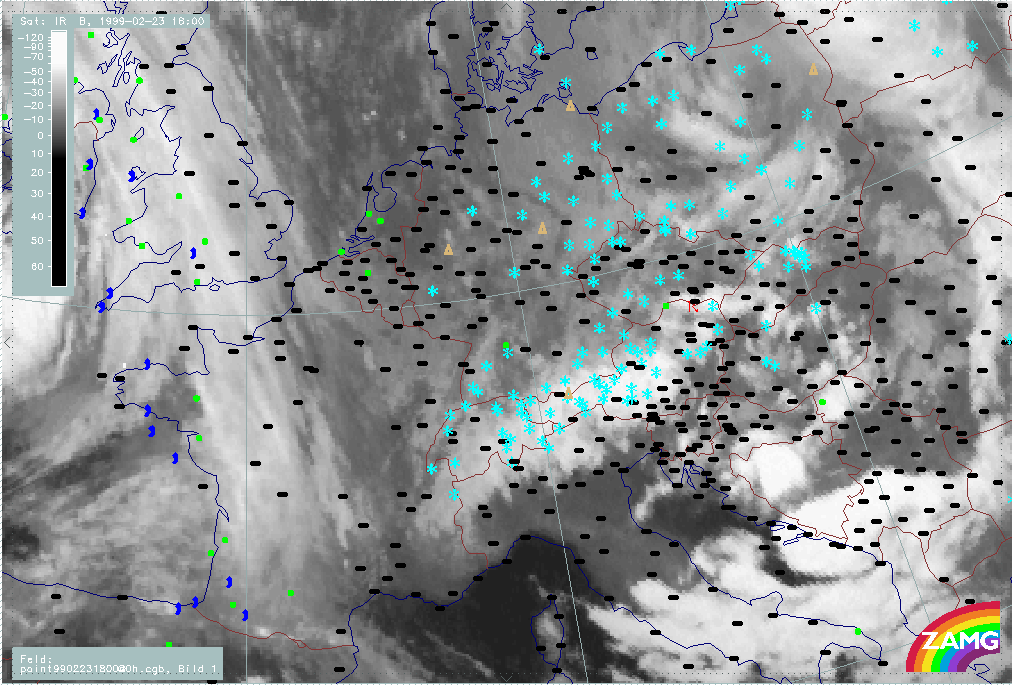
22 February 1999/15.00 UTC - Meteosat IR image; 22/15.00 - 23/21.00 UTC 3-hourly image loop
|
|
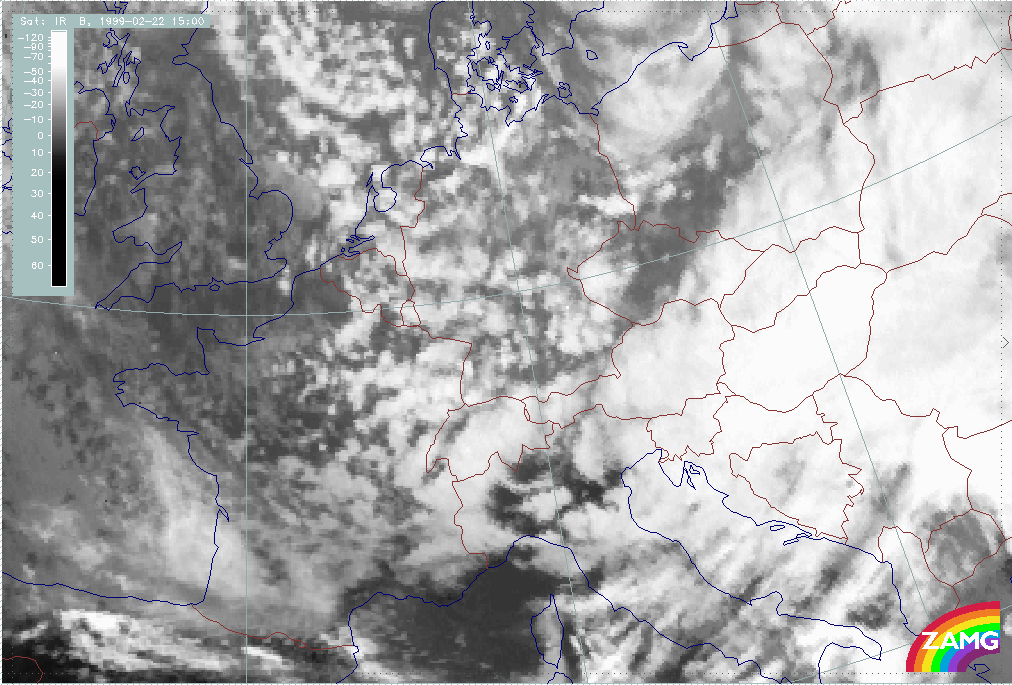
In summary, the following can be noted:
- Between 22/15.00 and 21.00 UTC (ph1001 - ph1003), the frontal cloud band, combined with the cold air cloud band, propagate eastward across Austria; their cloudiness then moves across Central and E. Austria.
- At the same time, intensive Stau Cloud develops at the W. Alps and over W. Austria.
- In phase 22/18.00 UTC (ph1002), parallel lines are superimposed on the Stau Cloud which are perpendicular to the orientation of the Alps; such a phenomenon has already been discussed.
- The phase from 23/00.00 to 15.00 UTC (ph1004 - ph1009) is characterised by intensive Stau Cloud in the whole Alpine mountain area and by the propagation and superimposition of a Comma cloud spiral from the North Sea across the Alps. At 23/15.00 UTC (ph1009), the merging and interaction between the Stau Cloud and the cloud spiral provides some very interesting features.
- By 13/21.00 UTC (ph1011) the phases show decreasing Stau Cloud.
|
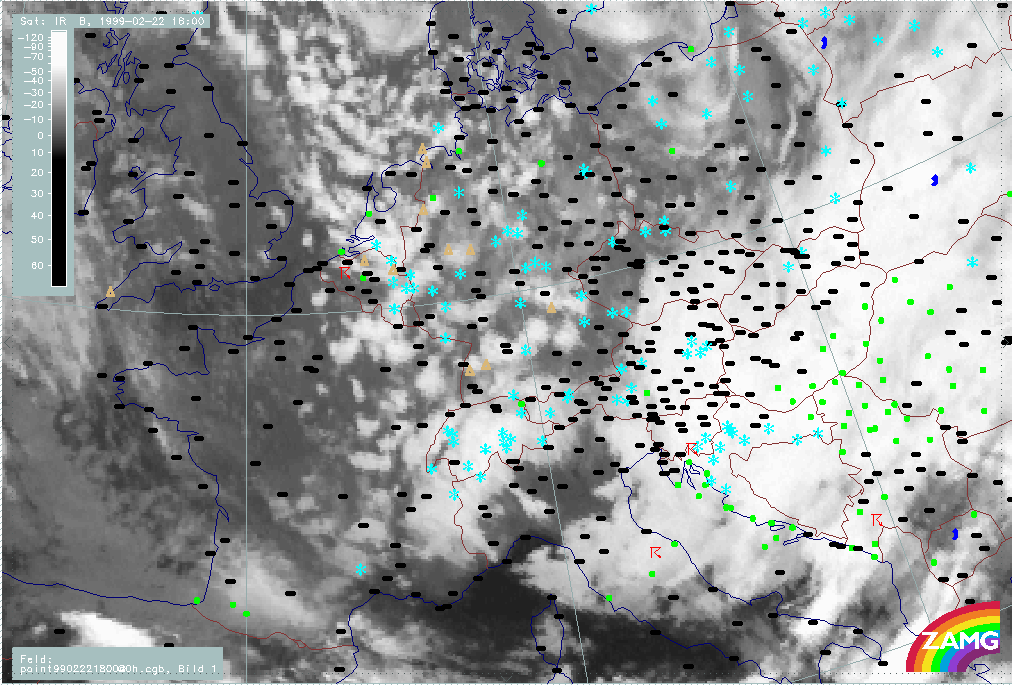
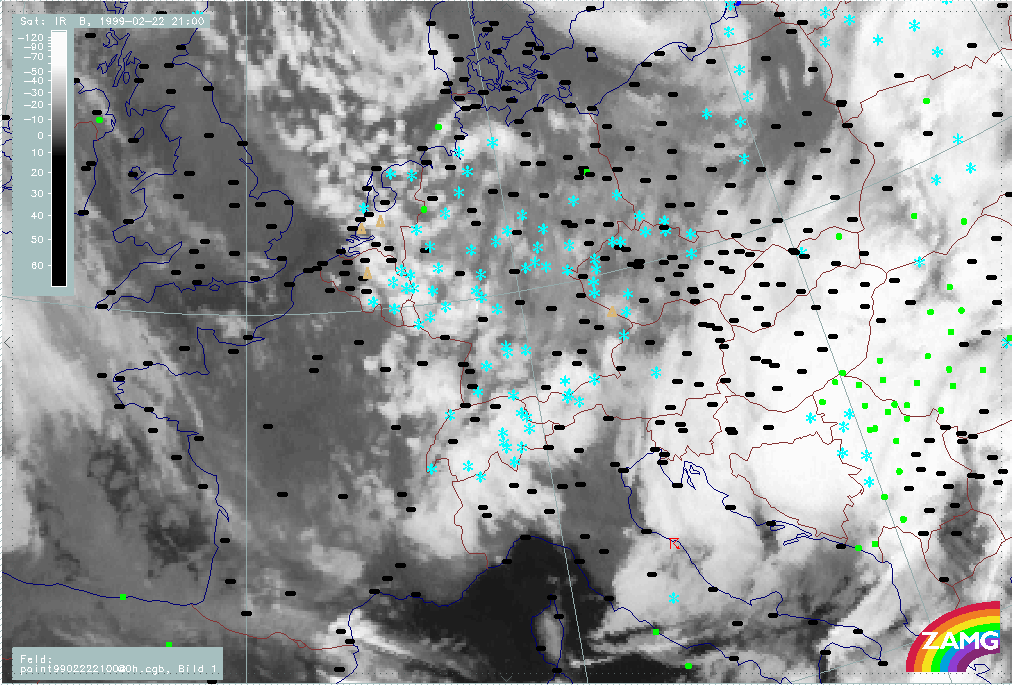
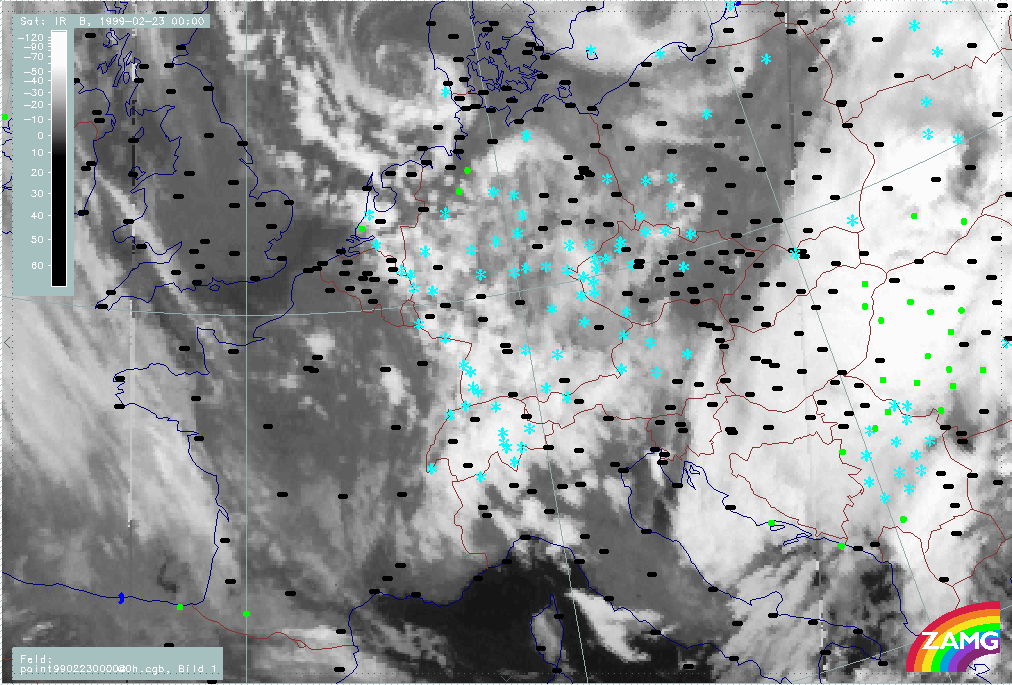
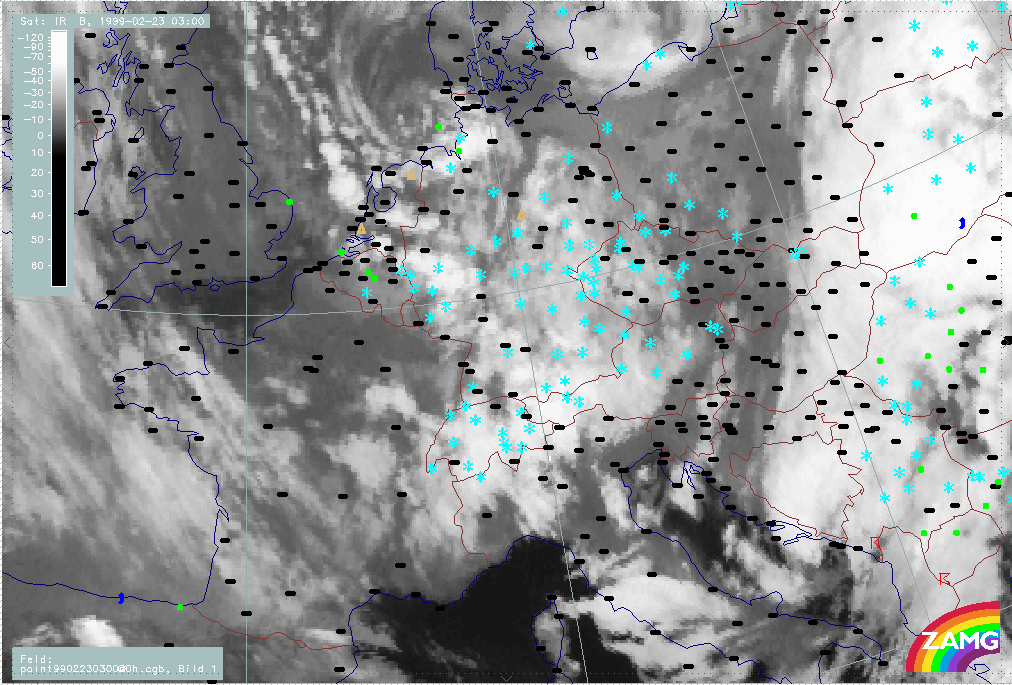
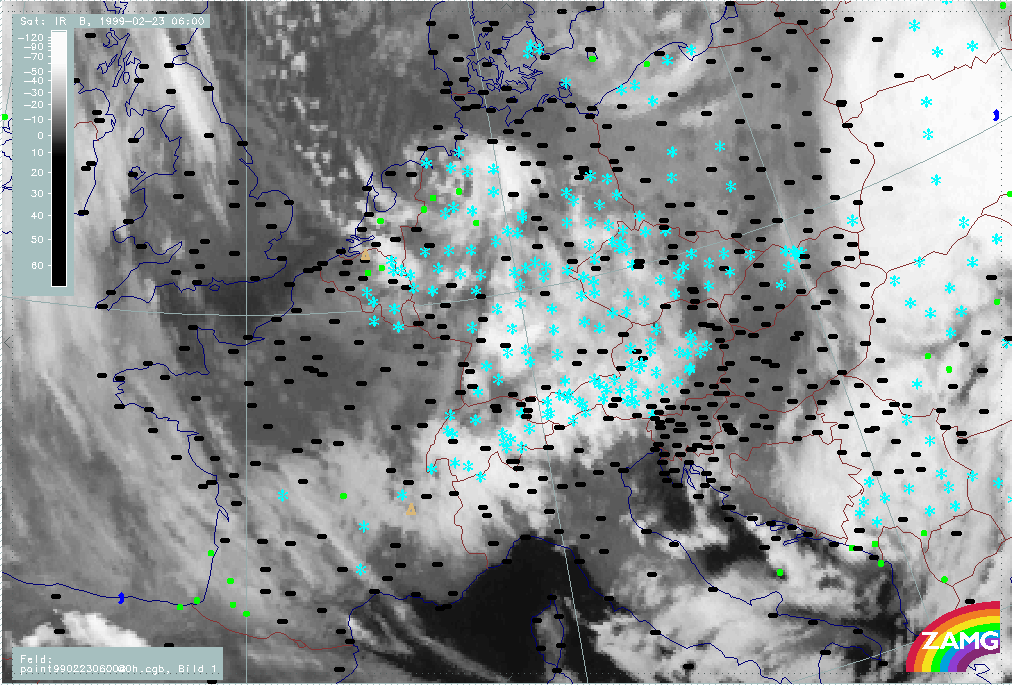
22 February 1999/15.00 UTC - Meteosat IR image; weather events (green: rain and showers, blue: drizzle, cyan: snow, red: thunderstorm with precipitation, purple: freezing rain, orange:
hail, black: no actual precipitation or thunderstorm with precipitation); 22/15.00 - 23/21.00 UTC 3-hourly image loop
|
|
In summary, the following can be noted:
- At the beginning of 22/15.00 UTC (ph1001p), there is a lot of snowfall in the Alpine mountain area and there are several thunderstorms reported within the Cold Air Cloudiness over Germany.
- Then there is a short phase 22/18.00 - 21.00 UTC (ph1002p - ph1003p) where snowfall events decrease, especially over W. Austria.
- From 23/00.00 UTC on until 23/15.00 UTC (ph1004p - ph1009p), snowfall intensifies again and extends from the Alpine mountain area across the whole of Germany; this large snowfall area is associated with the cloud features of the Stau and the Comma clouds.
- From 23/18.00 UTC onwards (ph1010p), snowfall is decreasing over Germany and restricted to the Stau Cloud in the mountains only, where it remains very heavy.
|
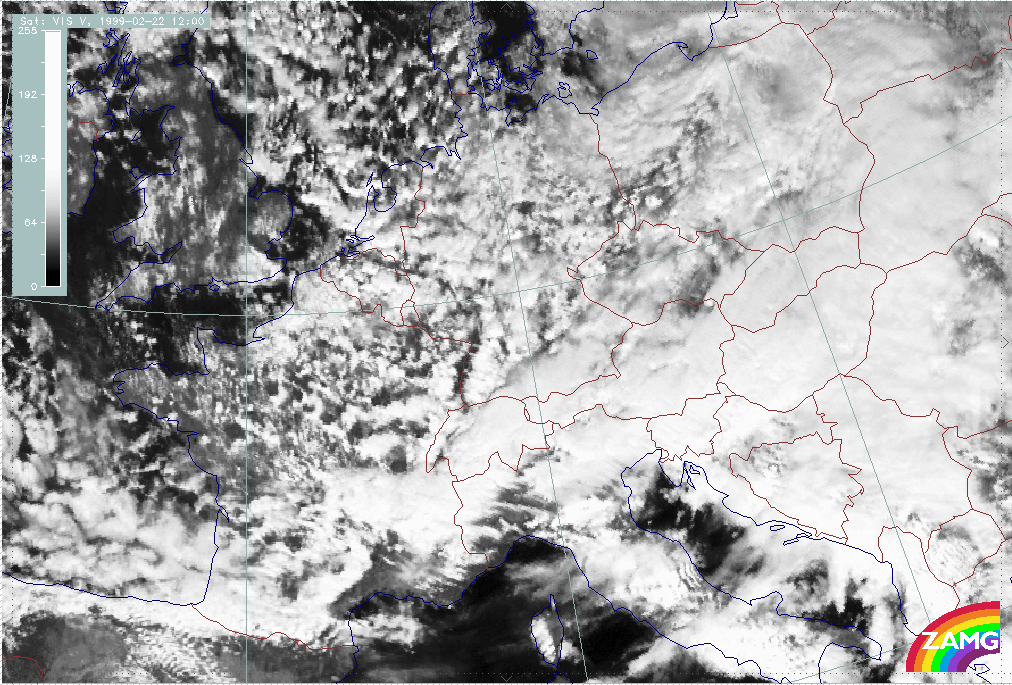
22 February 1999/15.00 UTC - Meteosat VIS image; 22/15.00 - 23/15.00 UTC 3-hourly image loop
|
|
In summary, the following can be noted:
- The VIS image from 22/15.00 UTC (ph1001v) shows the intensive Stau Cloud over Switzerland and pronounced convective cells over France and Germany.
- The line structure perpendicular to the Alpine mountains over the W. Alps is also recognisable.
- The approach and crossing of the Comma spiral can also be seen very clearly in the VIS images (ph1007v - ph1009v).
- The most important feature is the development of two cloud layers with different heights: the Comma head has lower cloud tops and is very cellular in structure; in the area of the Comma tail a higher cloud layer is superimposed which can be detected by a Dark Stripe caused by its shadow (ph1008v).
- However, there is a point in time at 23/15.00 UTC (ph1009v), where this shadow appears to be parallel to the highest Alpine mountain chain instead of being parallel to the Comma tail.
For a detailed example see: Thickness trough
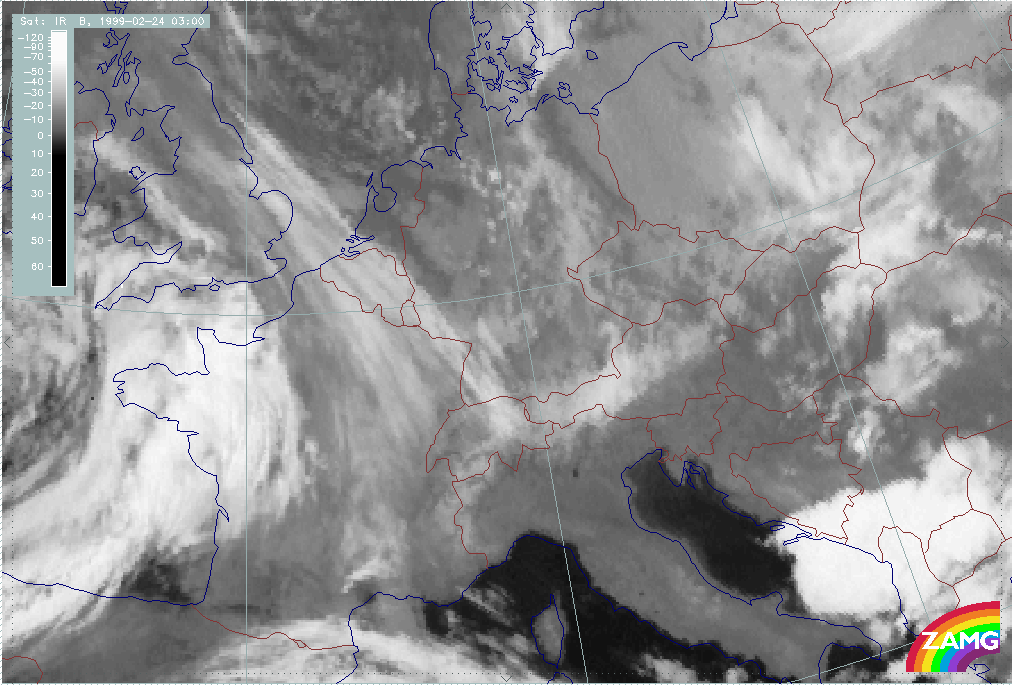
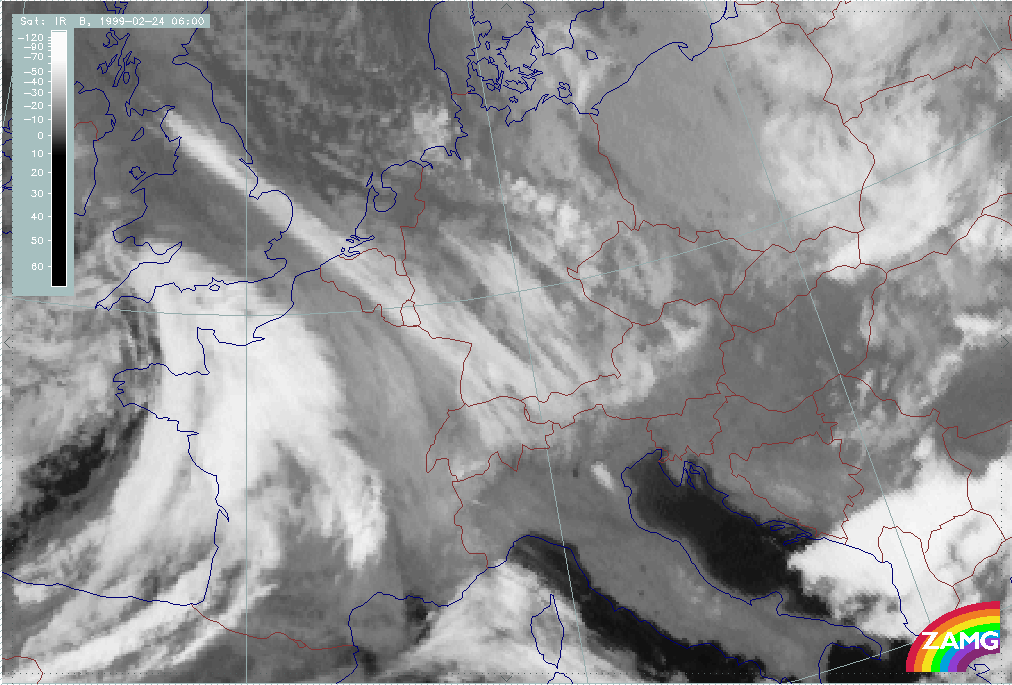
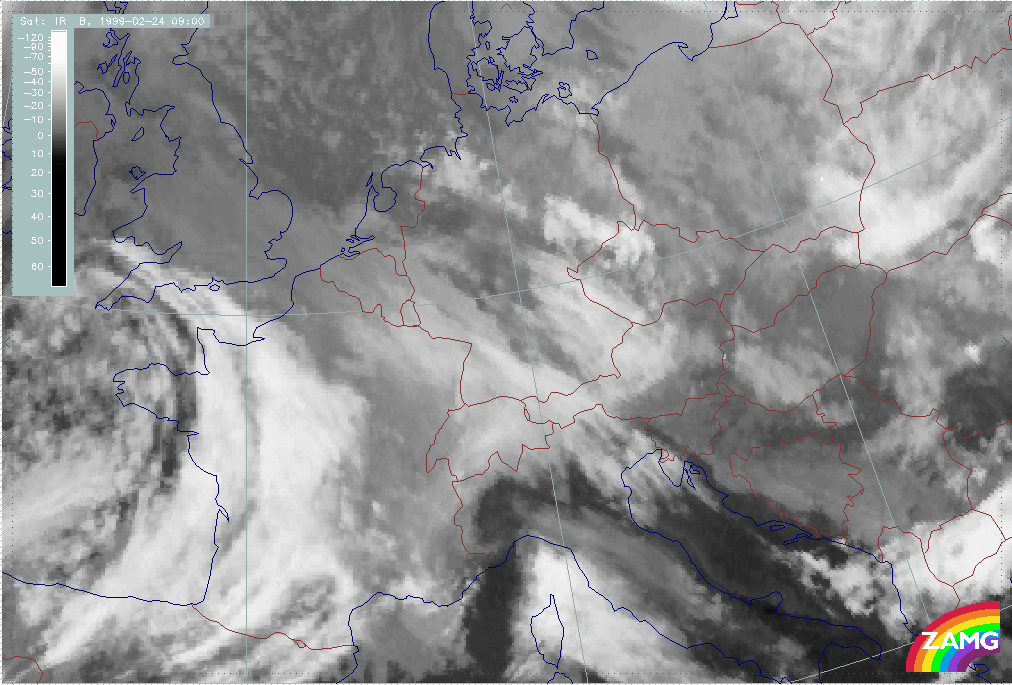
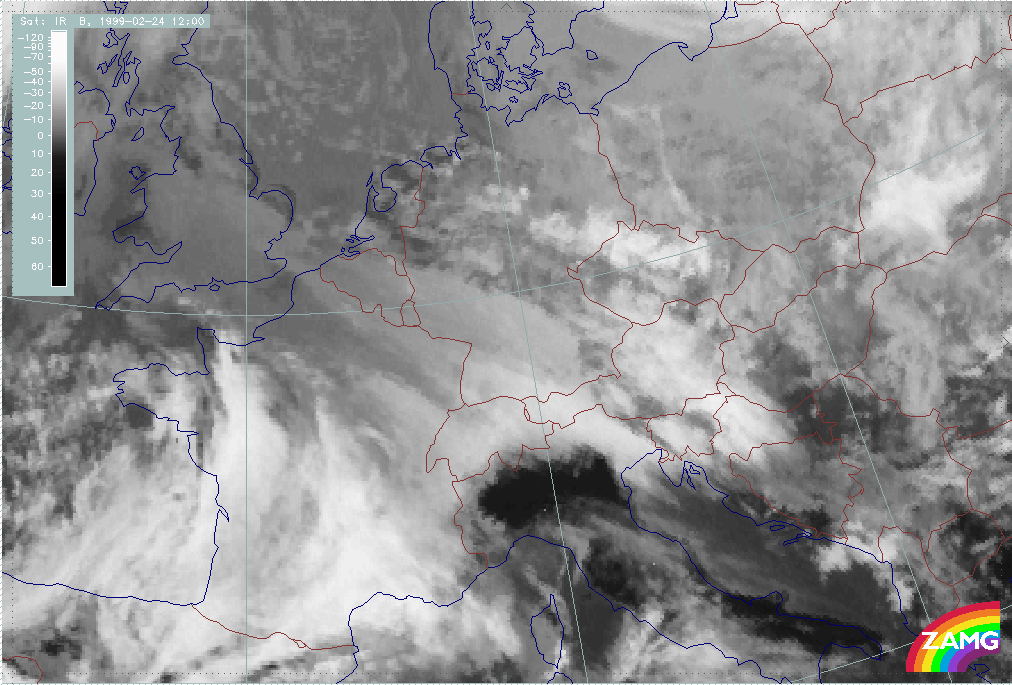
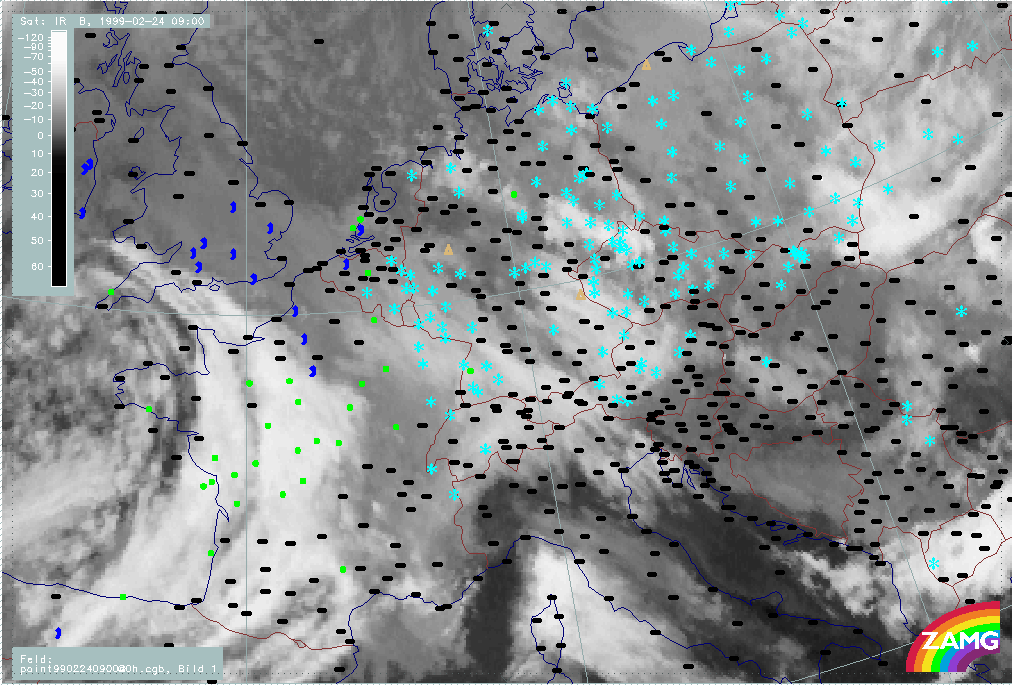
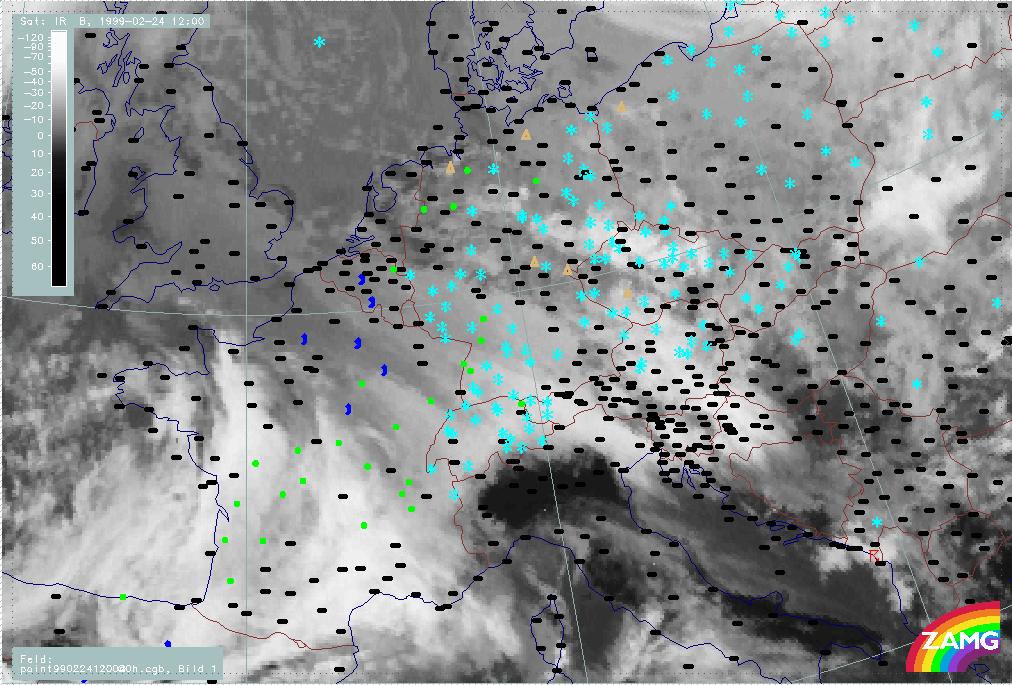
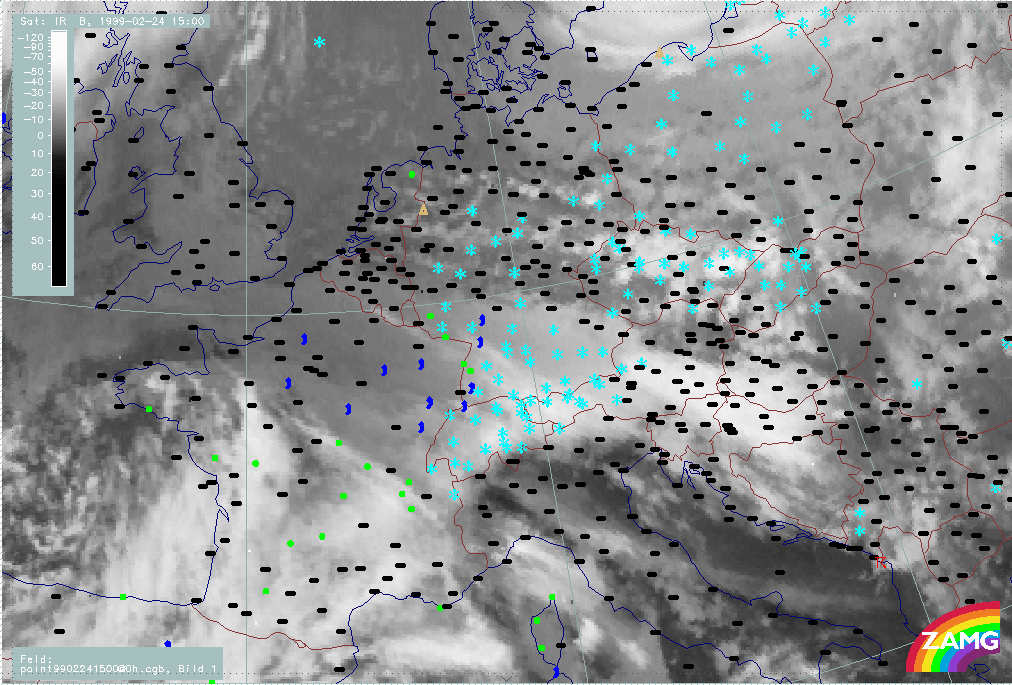
Phase 11: 24 February/00.00 - 24 February/12.00 UTC
This phase is characterised by:
- Warm Front crossing with thickness gradient
- Warm Front maximum crossing
- Main cloud features: Stau features, Lee features, Warm Front fibres
|
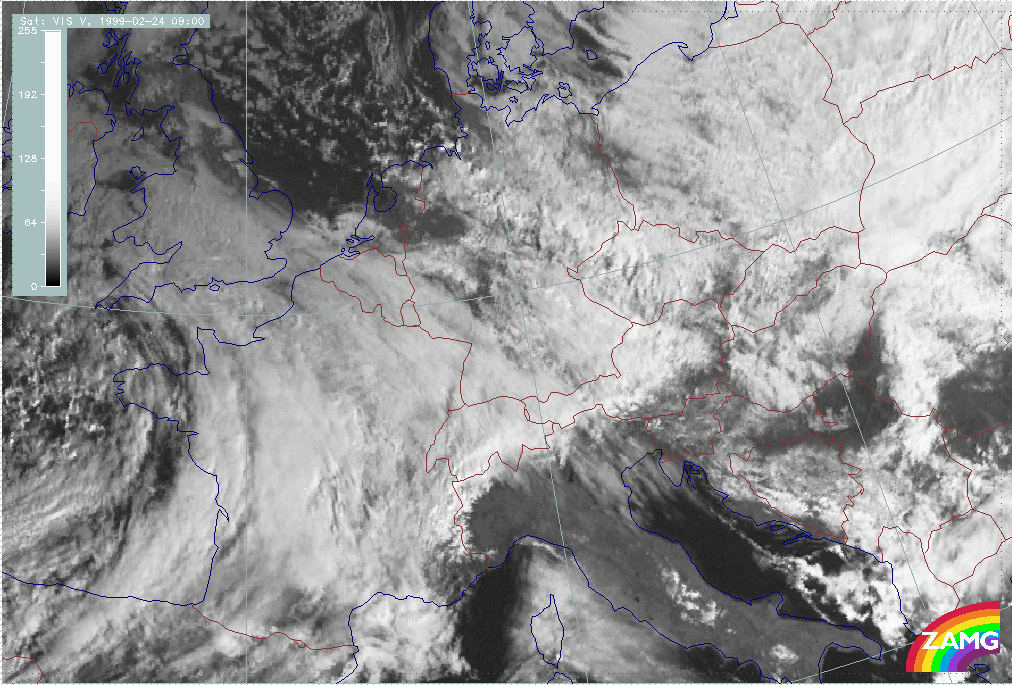
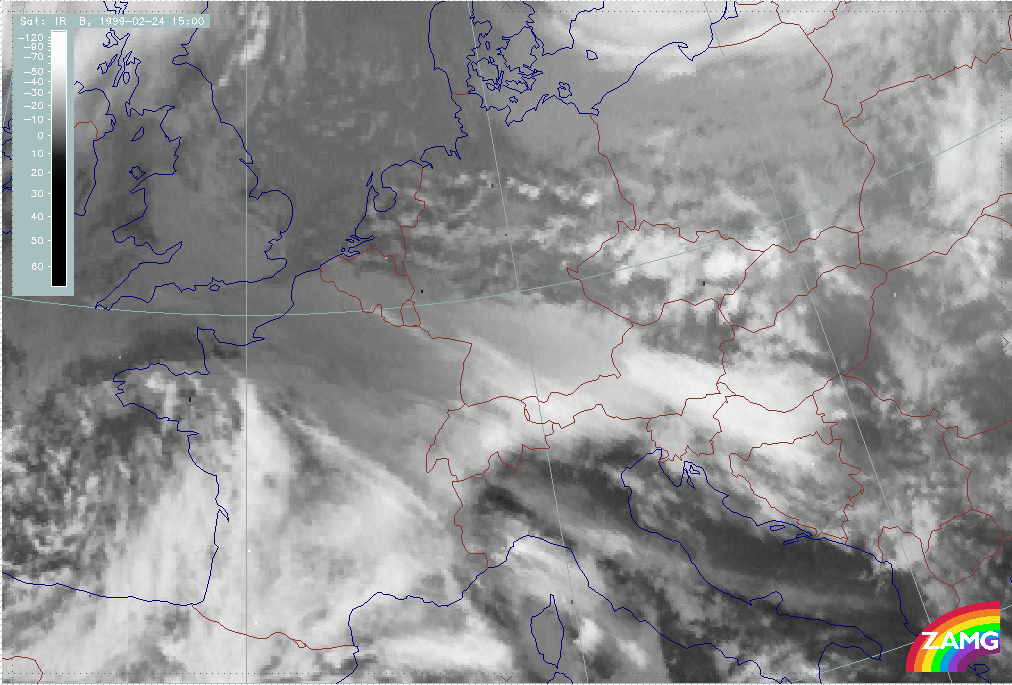
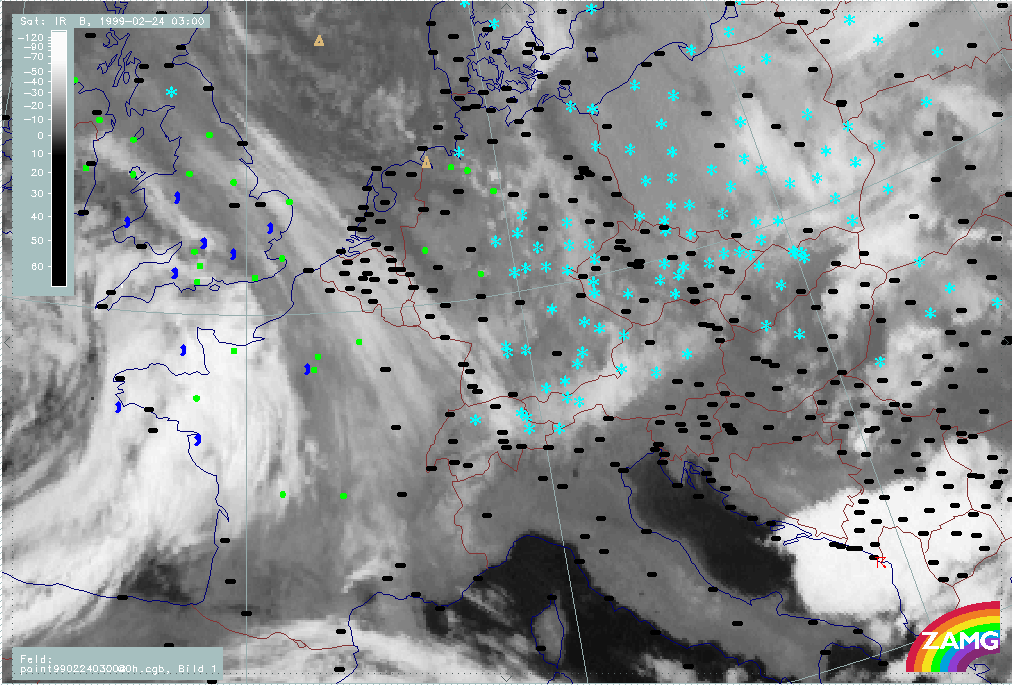
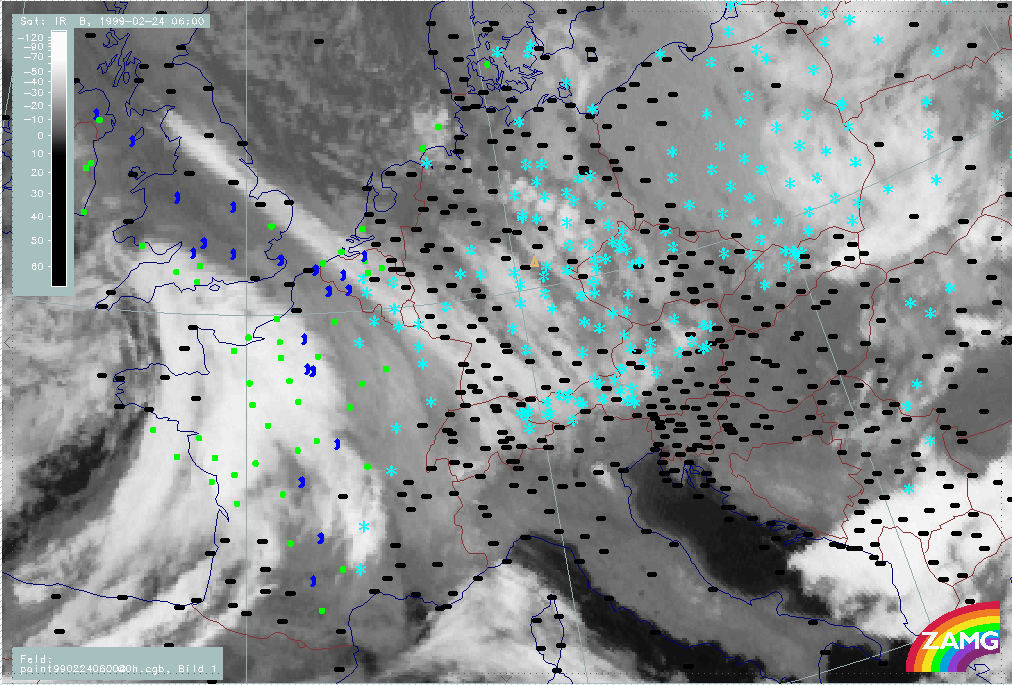
24 February 1999/00.00 UTC - Meteosat IR image; 24/00.00 - 24/18.00 UTC 3-hourly image loop
|
|
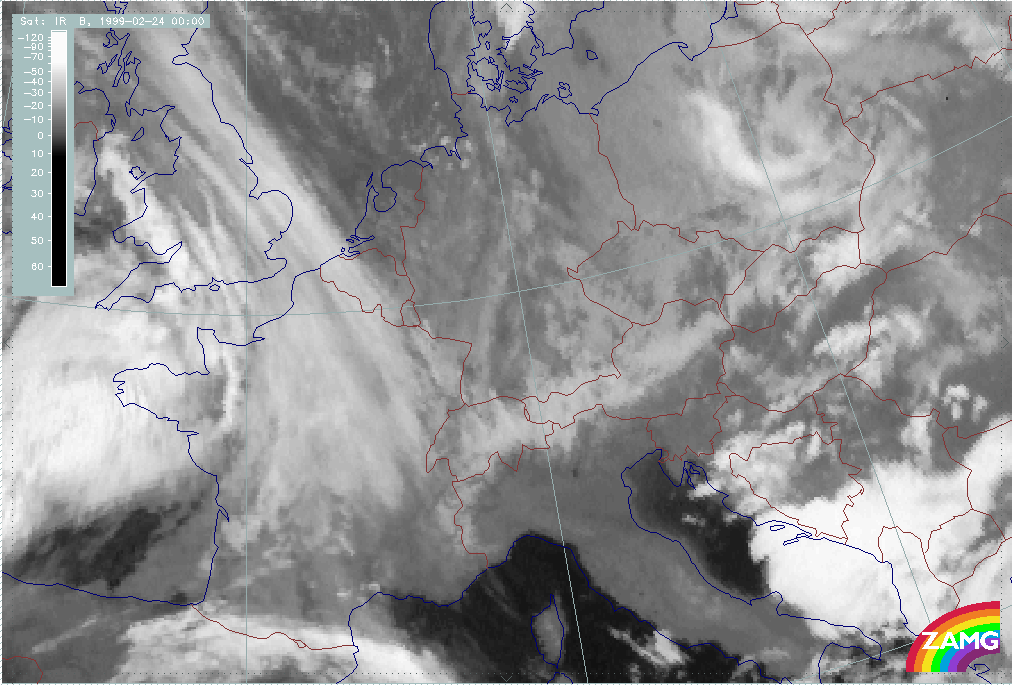
In summary, the following can be noted:
- Between 24/00.00 and 06.00 UTC (ph1101 - ph 1103), Warm Front cloud fibres propagate eastwards along the Alpine mountain chains; at the same time the Stau Cloud intensifies, especially over Austria.
- Between 24/09.00 and 12.00 UTC (ph1104 - ph1105), the main feature is the development of an intensive area of cloudiness to the lee of the Alps over N. Italy, Slovenia and Croatia.
- At the same time the Warm Front cloud north of the Alps becomes more grey indicating dense but lower cloud tops. The cloud band rotates from more NW-SE to W-E directions but can still be interpreted as (Detached) Warm Front cloud.
- Only the northern edge, which is now nearly W-E oriented, seems to indicate the edge of a Cold Front or Baroclinic Boundary cloud band.
|
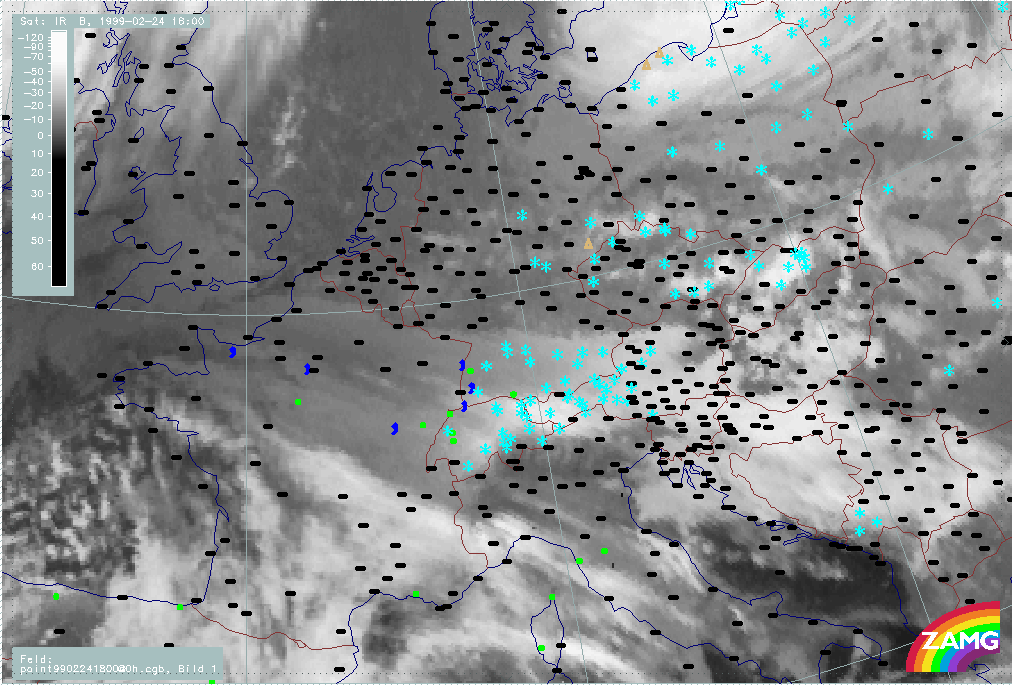
24 February 1999/00.00 UTC - Meteosat IR image; weather events (green: rain and showers, blue: drizzle, cyan: snow, red: thunderstorm with precipitation, purple: freezing rain, orange: hail, black: no actual precipitation or thunderstorm with precipitation); 24/00.00 - 24/18.00 UTC 3-hourly image loop
|
|
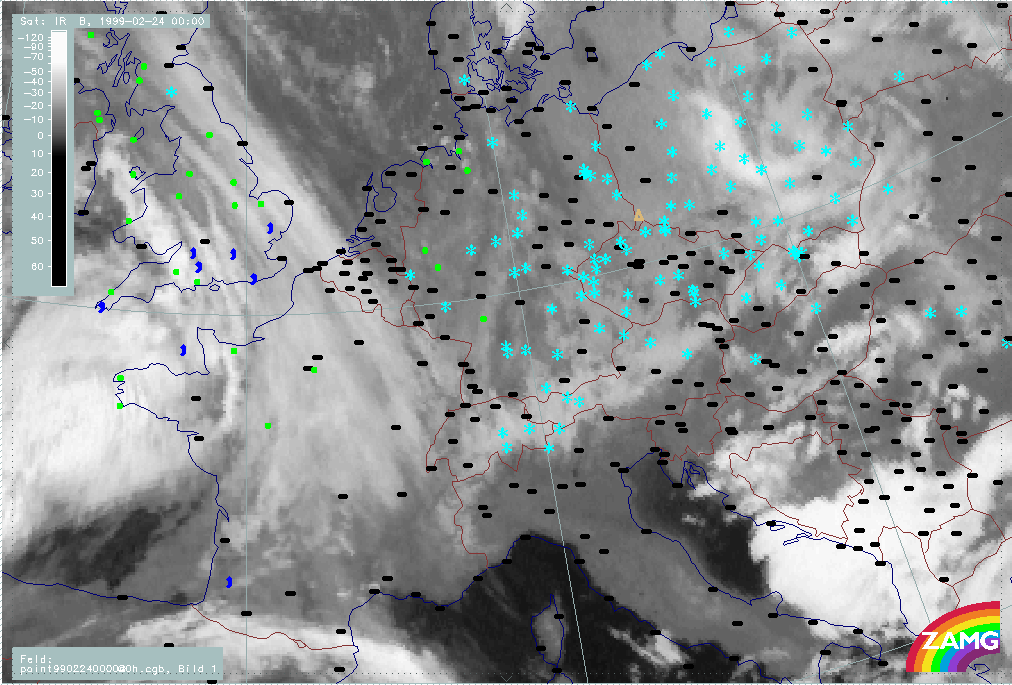
In summary, the following can be noted:
- There are reports of snow in Alpine areas as well as to the north, across the whole of Germany.
- Warm Front cloud fibres, and later developing Lee Cloudiness, are not accompanied by any precipitation.
- From 24/12.00 UTC (ph1105p) on, which is the phase when the greyer (lower) cloud tops intensify, reports of snow increase significantly within this area of cloudiness.
|
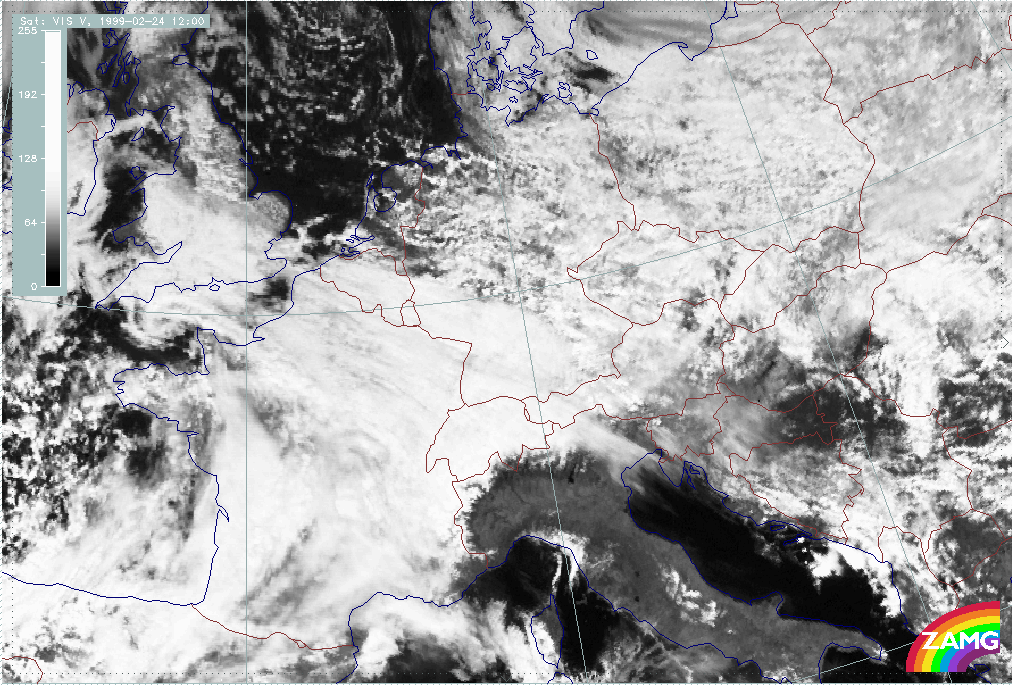
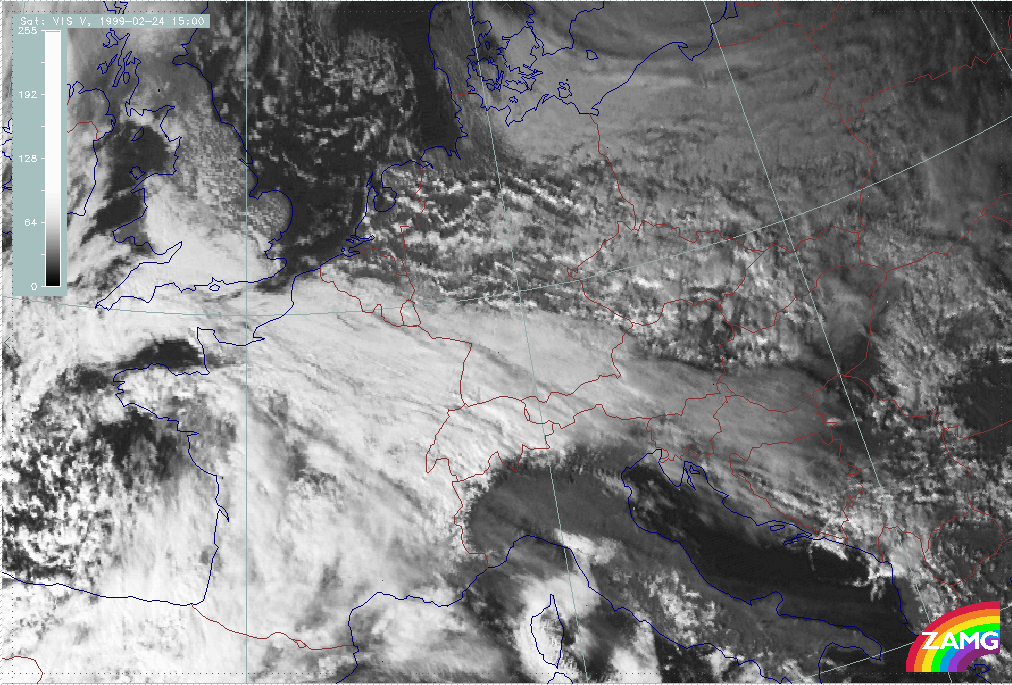
24 February 1999/09.00 UTC - Meteosat VIS image; 24/09.00 - 24/15.00 UTC 3-hourly image loop
|
|
In summary, the following can be noted:
- The VIS images from 24/09.00 - 15.00 UTC (ph1104v - ph1106v) show that the cloudiness in the lee of the Alps mostly consists of high translucent Cirrus cloud which cross the Alps without modification; it is, therefore, much higher than the mountain tops.
For a detailed example see: Detached Warm Front and subtypes
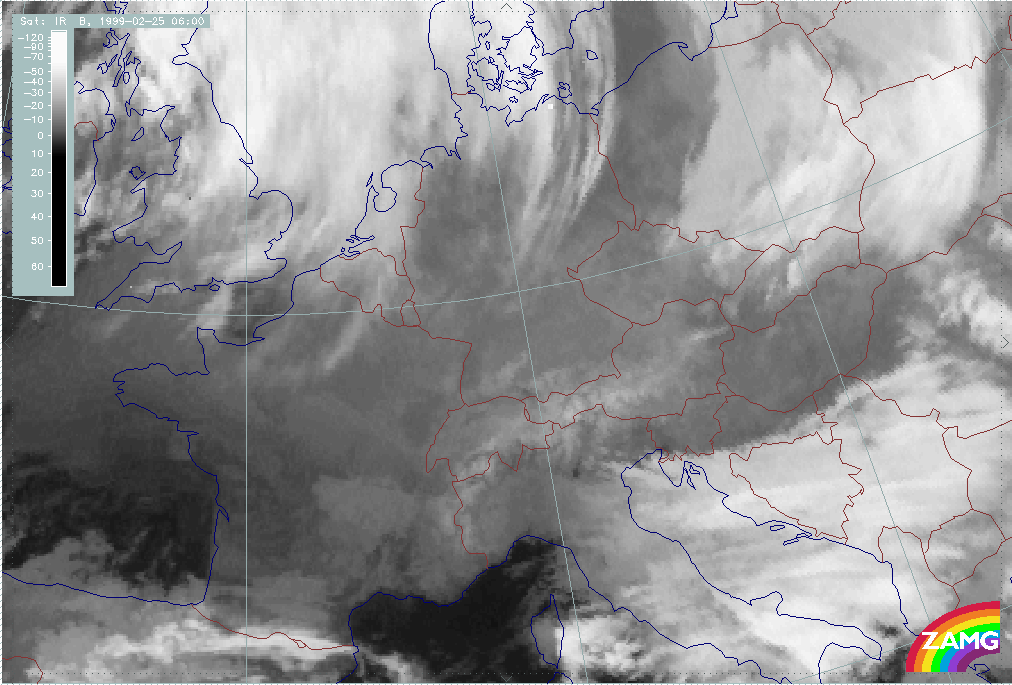
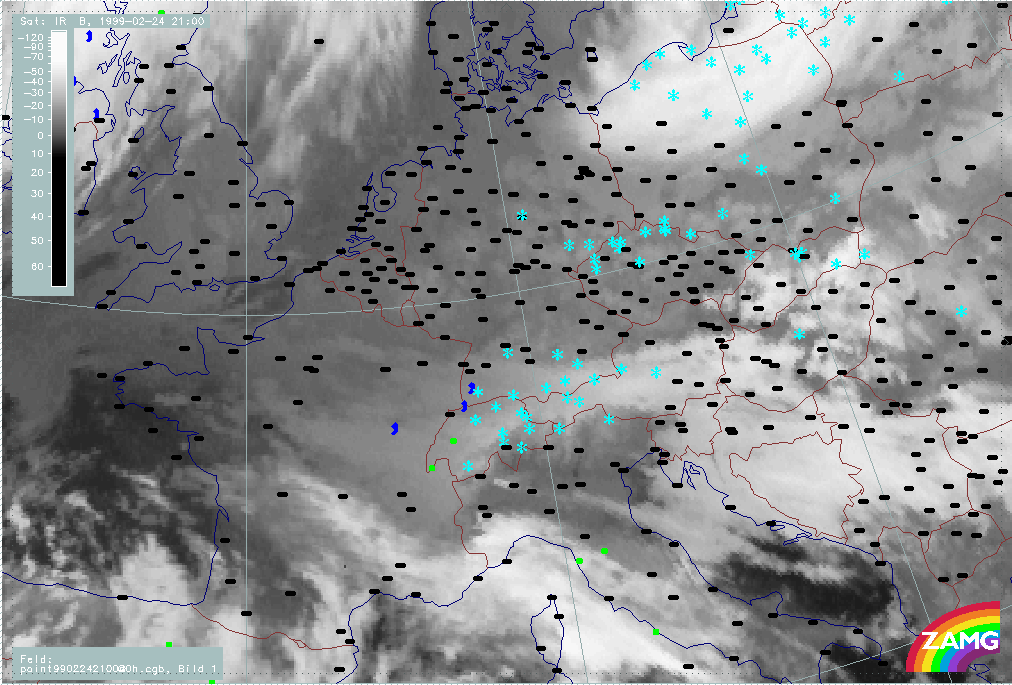
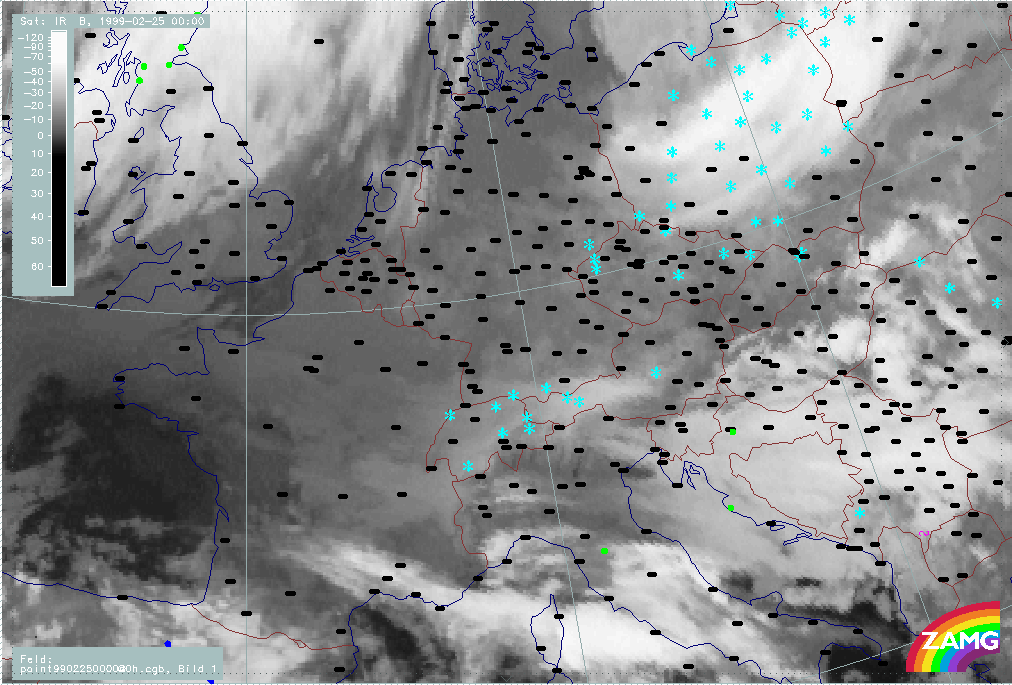
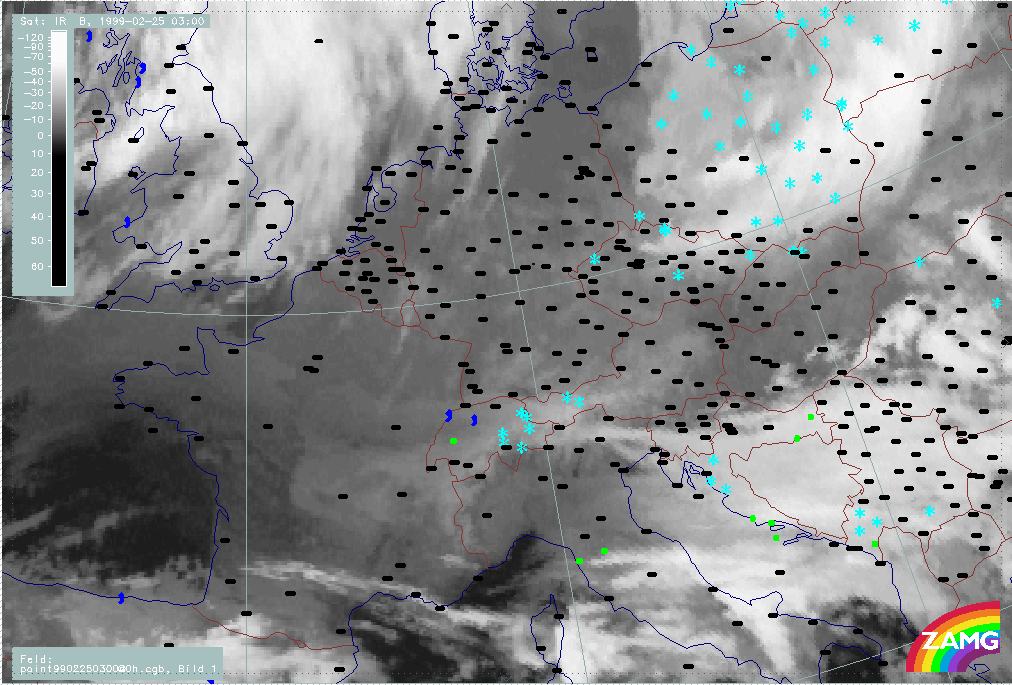
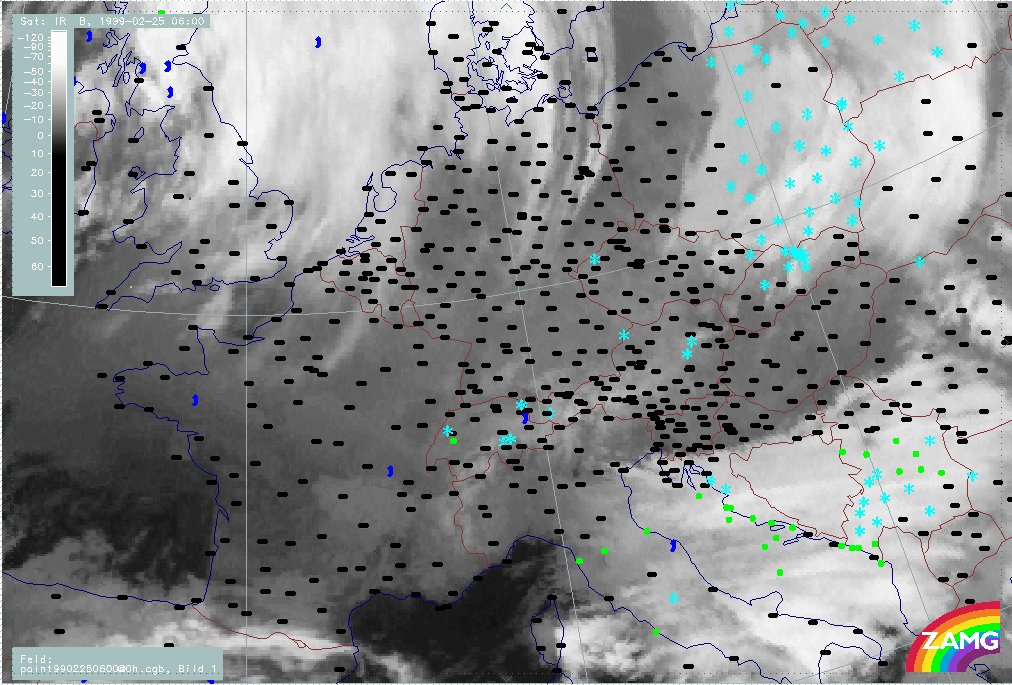
Phase 12: 24 February/18.00 - 25 February/06.00 UTC
This phase is characterised by:
- Cold Front crossing with thickness gradient
- CA dominating
- Main cloud features: Stau features
|
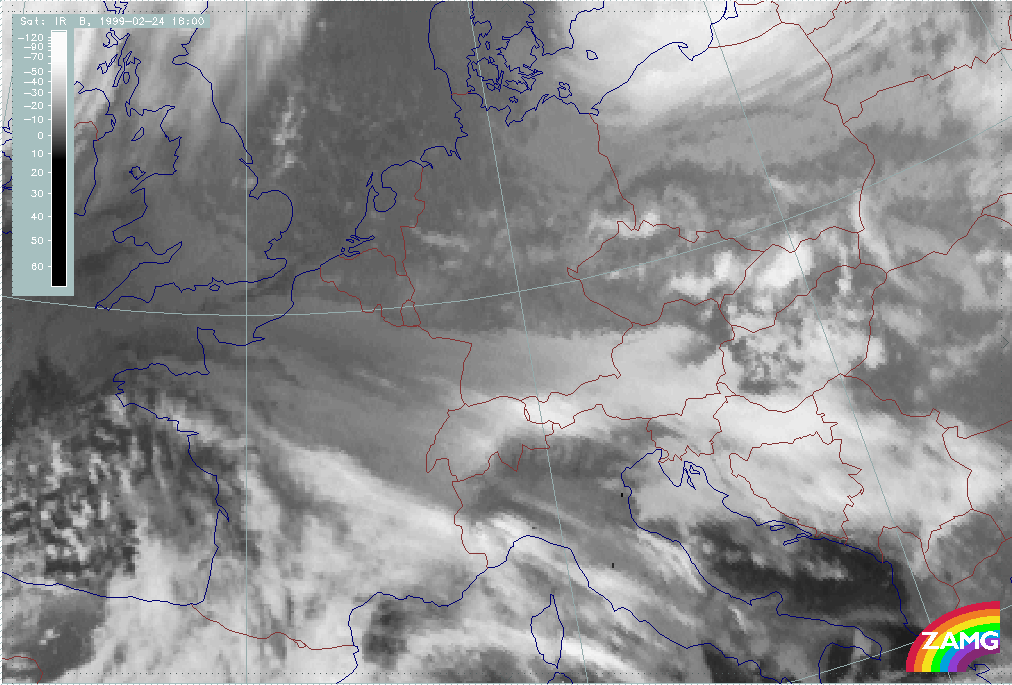
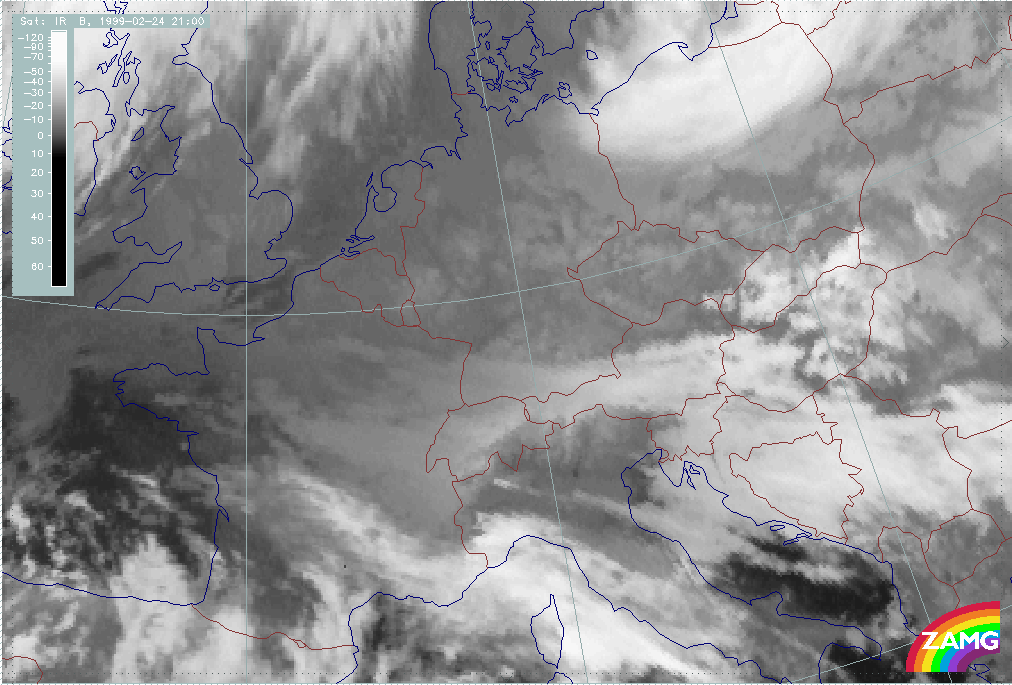
24 February 1999/18.00 UTC - Meteosat IR image; 24/18.00 - 25/06.00 UTC 3-hourly image loop
|
|

In summary, the following can be noted:
- The first part shows the passage of the dark grey low cloud band indicating a Cold Front.
- As already observed several times before, there is an intensification and/or new development of the cloud to the south of the mountains after the frontal passage took place (ph1201 - ph1204).
- Finally, only few clouds remain in the Alpine mountain region.
|
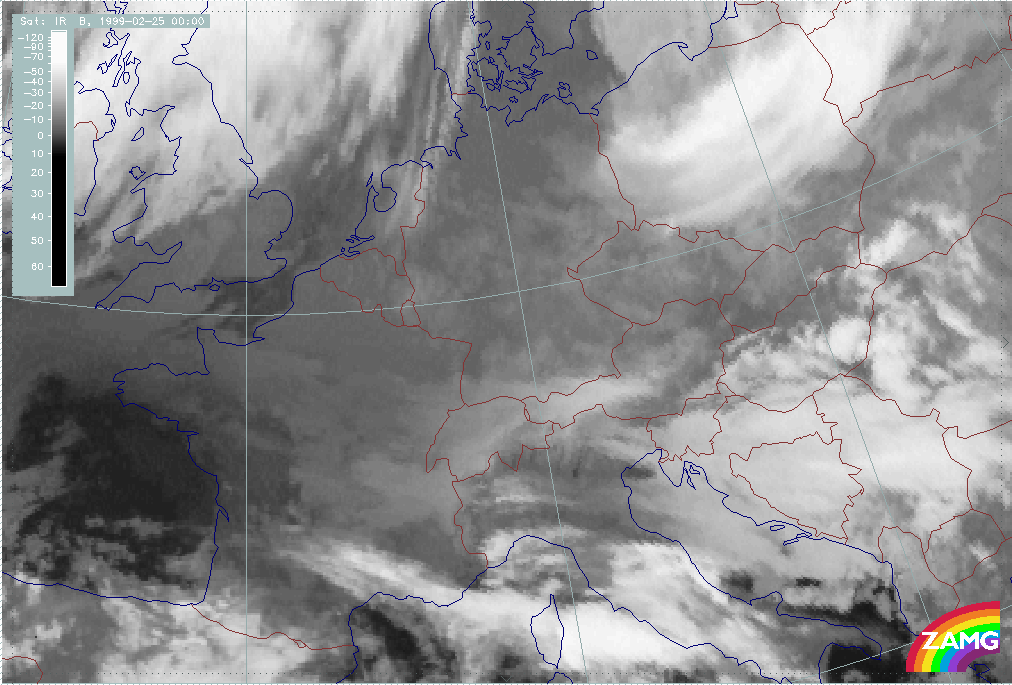
24 February 1999/18.00 UTC - Meteosat IR image; weather events (green: rain and showers, blue: drizzle, cyan: snow, red: thunderstorm with precipitation, purple: freezing rain, orange: hail, black: no actual precipitation or thunderstorm with precipitation); 24/18.00 - 25/06.00 UTC 3-hourly image loop
|
|
In summary, the following can be noted:
- There is much snow over Switzerland and Tyrol during the passage of the frontal cloud band.
- From 25/00.00 UTC (ph1203p), snow events decrease significantly.