Table of Contents
Introduction
In the early hours of 04 July 2003, the region of central Dalmatia, a coastal part of Croatia was devastated by a severe thunderstorm. Heavy rain and hail destroyed all the crops and vegetables in the fields in just a few hours. The amount of rainfall exceeded 30 mm in less then an hour, and there were also stations measuring 50 mm or even more in only 30 minutes. Some Dalmatian towns experienced flash floods, with water flowing onto the streets and some roads had to be closed.
|
Flash-flood in Split; photography courtesy of daily newspapers `Jutarnji list´, 05.07.2003
|
Hail-stones in Dalmatia; photography courtesy of daily newspapers `Jutarnji list´, 05.07.2003
|
|

|

|
|
|
Devastated crops in Dalmatia; photography courtesy of daily newspapers `Jutarnji list´, 05.07.2003
|
|
In many places this was equivalent to the total monthly rainfall, and some amounts were measured within only 30 minutes.
In addition, heavy hail and hail showers, together with strong winds occurred in many locations. In the vicinity of Sibenik hail was the size of walnuts and further inland, vegetables, vineyards and olive trees were almost completely destroyed by strong hail showers. Damage to houses, cars and trees was also widespread.
|
04 July 2003 - Rainfall in southern Croatia
|
04 July 2003 - Hail occurrence in the morning hours. The numbers stand for the order of appearance of hail. The light violet signs
stand for the stations which reported hail in the morning, but without the exact time of appearance.
|
|
|
Convective development is not rare along the Croatian Adriatic coast and the near inland. It usually occurs in a south-westerly upper-level flow bringing warm and humid air to the Adriatic. Because of the orographic barrier provided by many islands near the coast and, at a larger scale, by the Dinaric Alps, the air is forced to rise. When such rising is reinforced by either synoptic-scale conditions or some meso-scale process, severe convective development such as that described here, can occur.
Initial weather situation
The large scale situation preceding the storm was analyzed by using the ECMWF analysis fields. At 00.00 UTC on 04 July 2003, the region of Italy and the Adriatic Sea was experiencing strong upper-level south-westerly flow, on the leading side of an upper trough connected to the low over southern Scandinavia. At the surface (1000 hPa) there is a very weak pressure gradient, but at upper levels (500hPa) there is a very pronounced gradient along the Adriatic.
|
04 July 2003/00.00 UTC - Meteosat IR image; violet: height contours 1000 hPa, cyan: height contours 500 hPa
|
04 July 2003/00.00 UTC - Meteosat IR image; red: thermal front parameter
|
|
|
Since the TFP shows no significant maxima in the region of interest, it can be concluded that there was no frontal influence. However, there was pronounced warm advection in the lower layers in the region of the north Adriatic. A jet stream was located over Italy and the Adriatic, with a pronounced PVA maximum on the left exit side of the jet, above the Alpine region.
|
04 July 2003/00.00 UTC - Meteosat IR image; red: temperature advection 1000/500 hPa
|
04 July 2003/00.00 UTC - Meteosat IR image; yellow: isotachs 300 hPa
|
|
|
|
|
|
04 July 2003/00.00 UTC - Meteosat IR image; green: vorticity advection 300 hPa
|
|
Development of a Mesoscale Convective System
Meteosat 8 images in infra-red (10.8 µm), water vapour (6.2 µm) and high-resolution visible together with rapid-scan Meteosat 7 images, are used to show the development of the system.
|
04 July 2003/02.15 - Meteosat 8 (MSG) IR image (10.8 µm); 02.15 - 11.15 UTC quarter-hourly image loop
|
04 July 2003/02.00 - Meteosat 8 (MSG) WV image (6.2 microm); 02.00 - 11.00 UTC quarter-hourly image loop
|
|
04 July 2003/03.30 - Meteosat IR enhanced image; 03.30 - 08.00 UTC 10 Minutes image loop
|
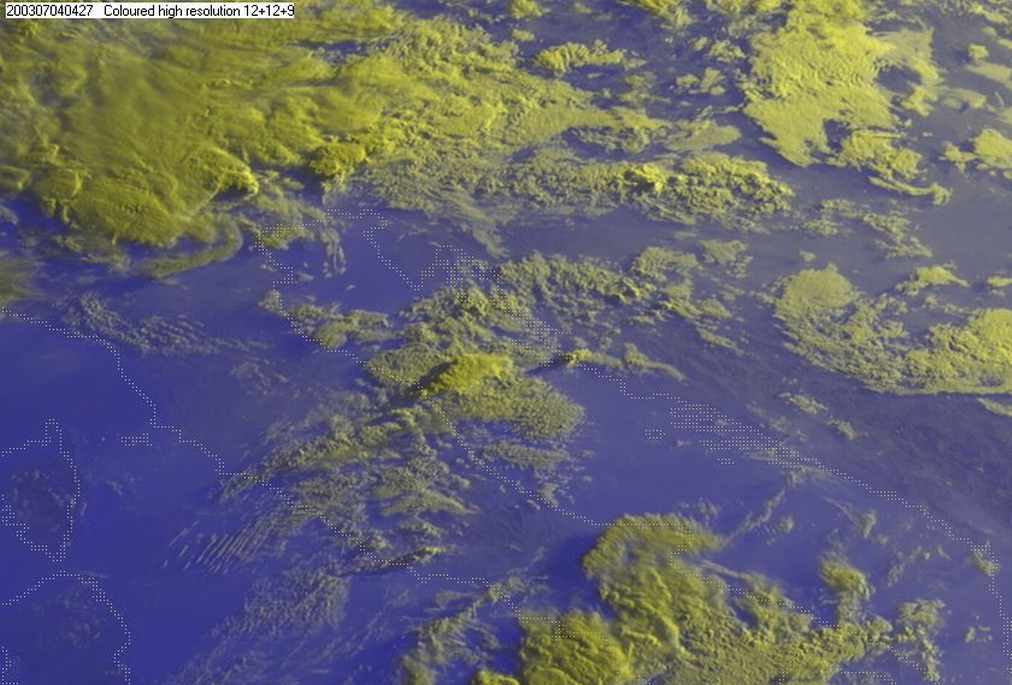
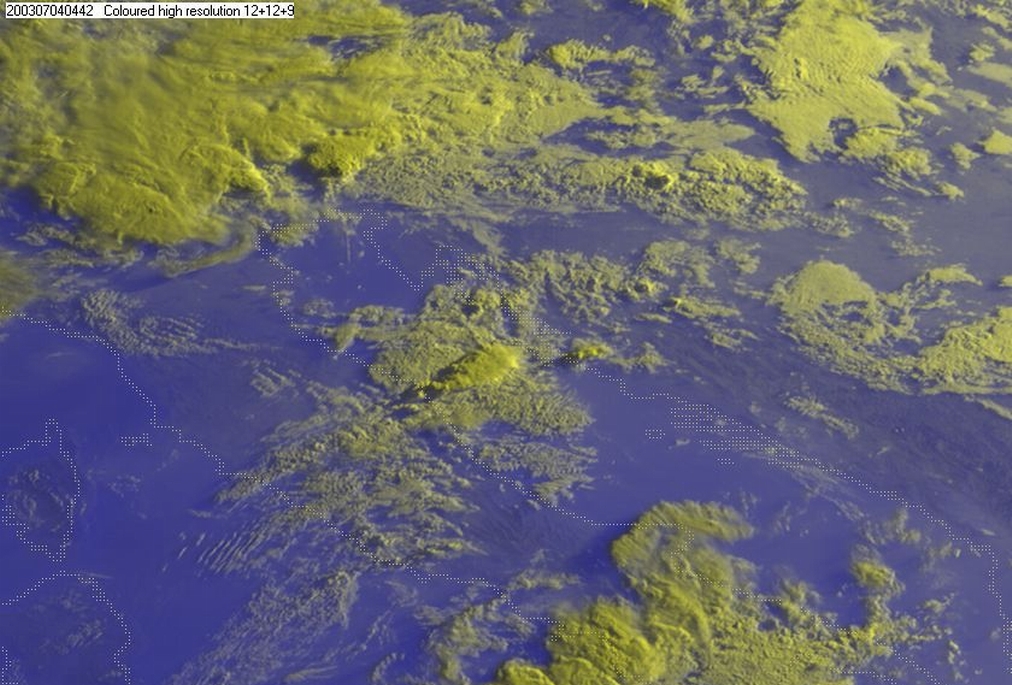
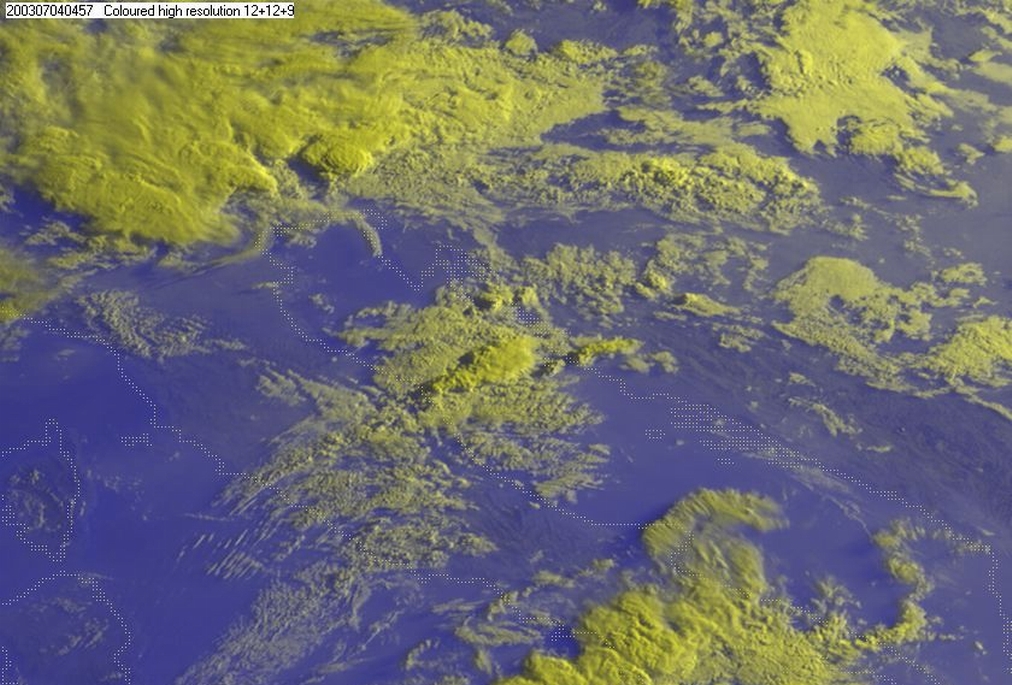
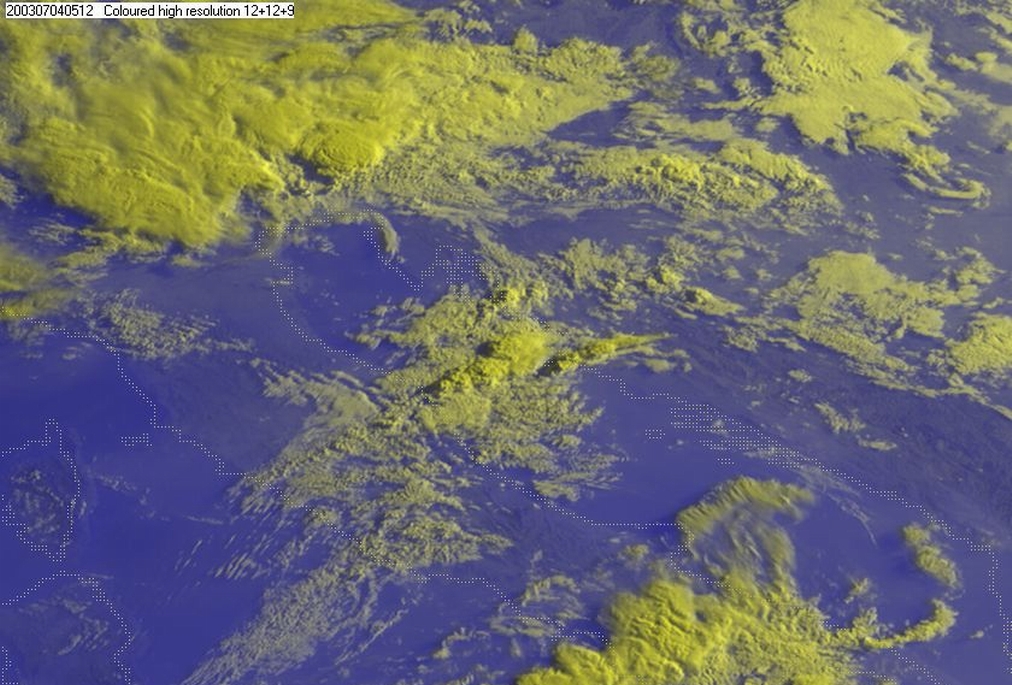
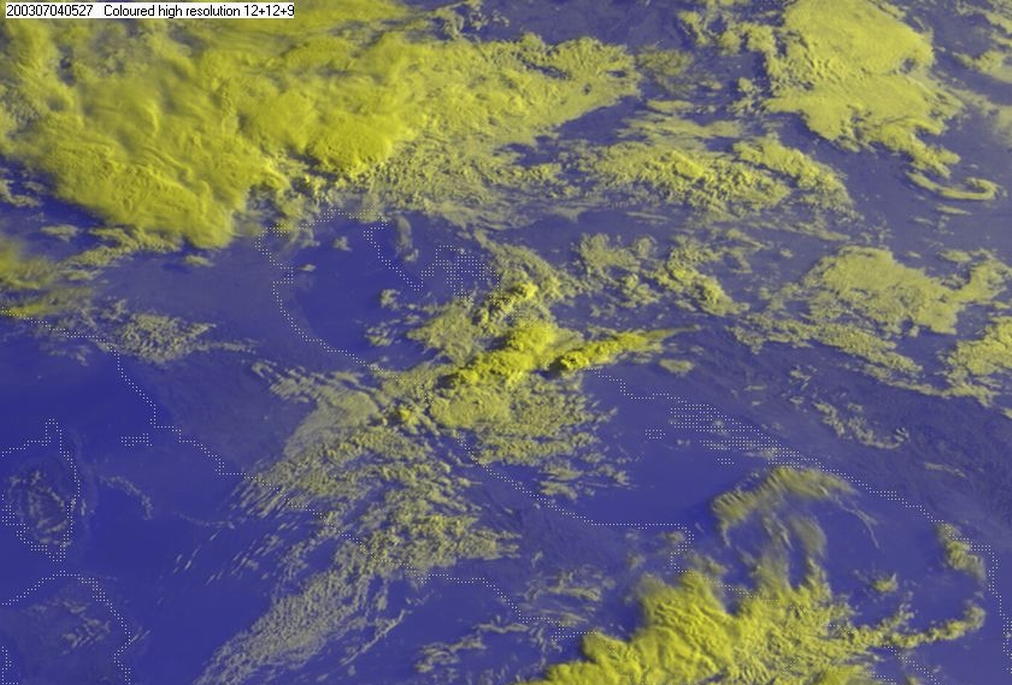
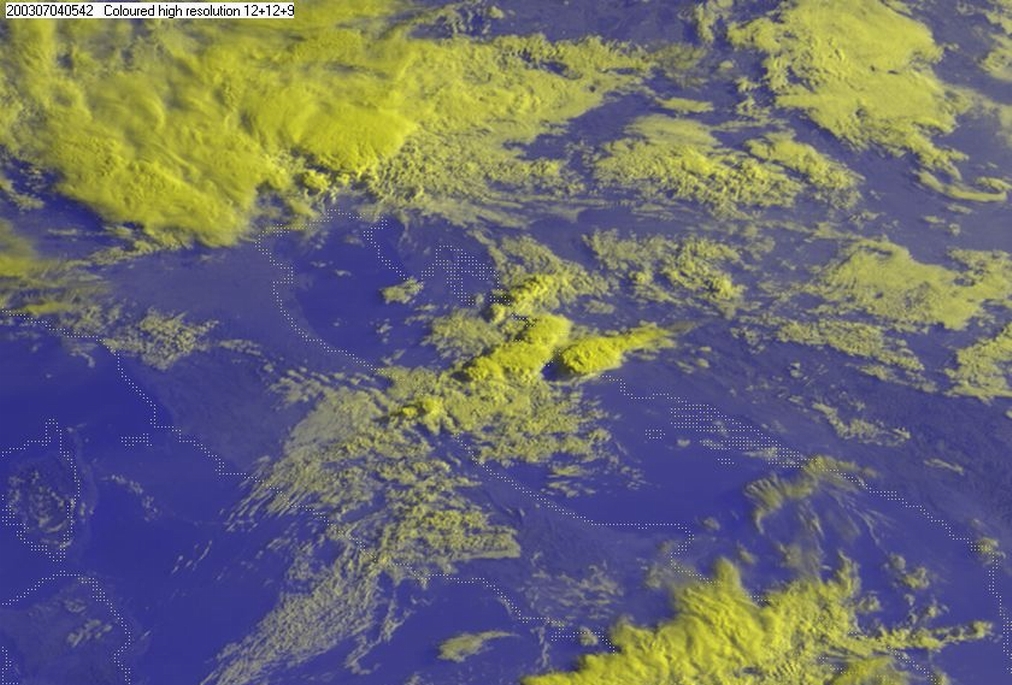
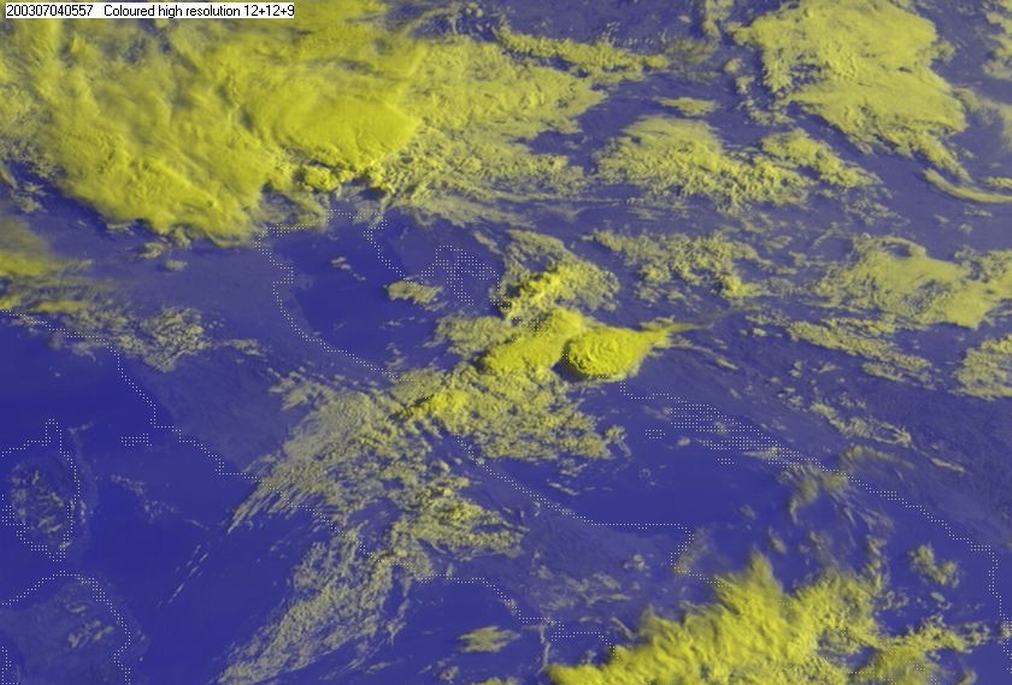
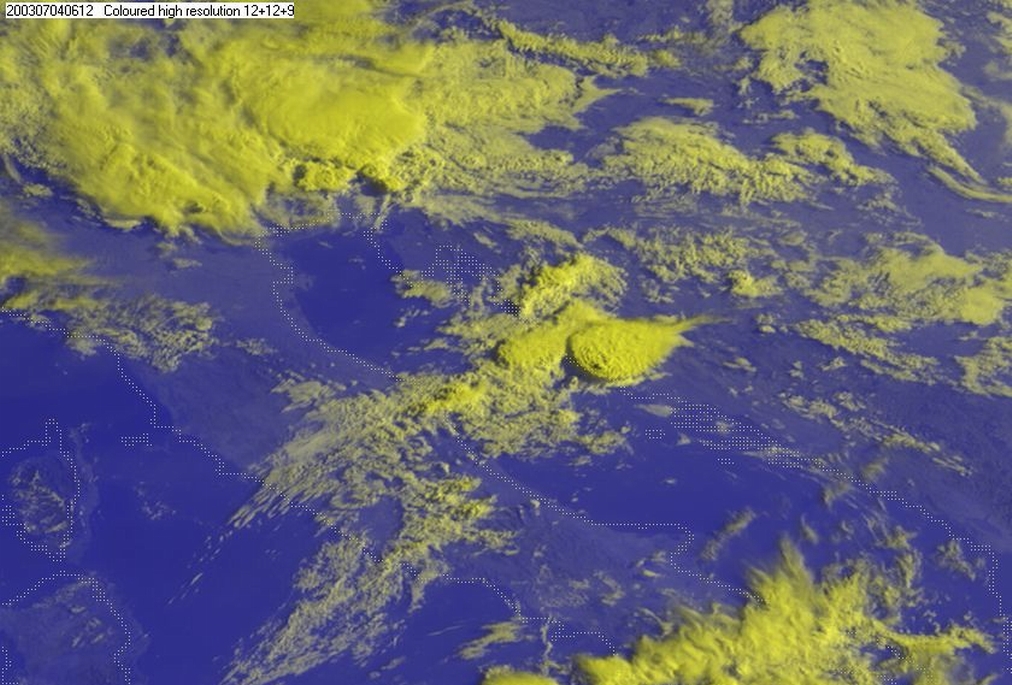
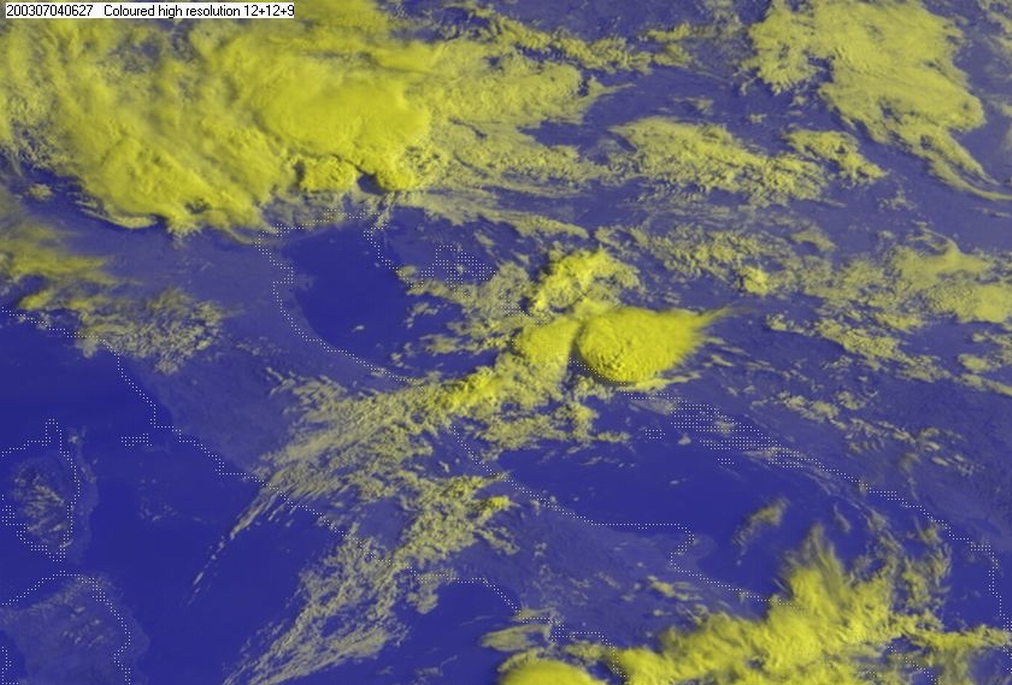
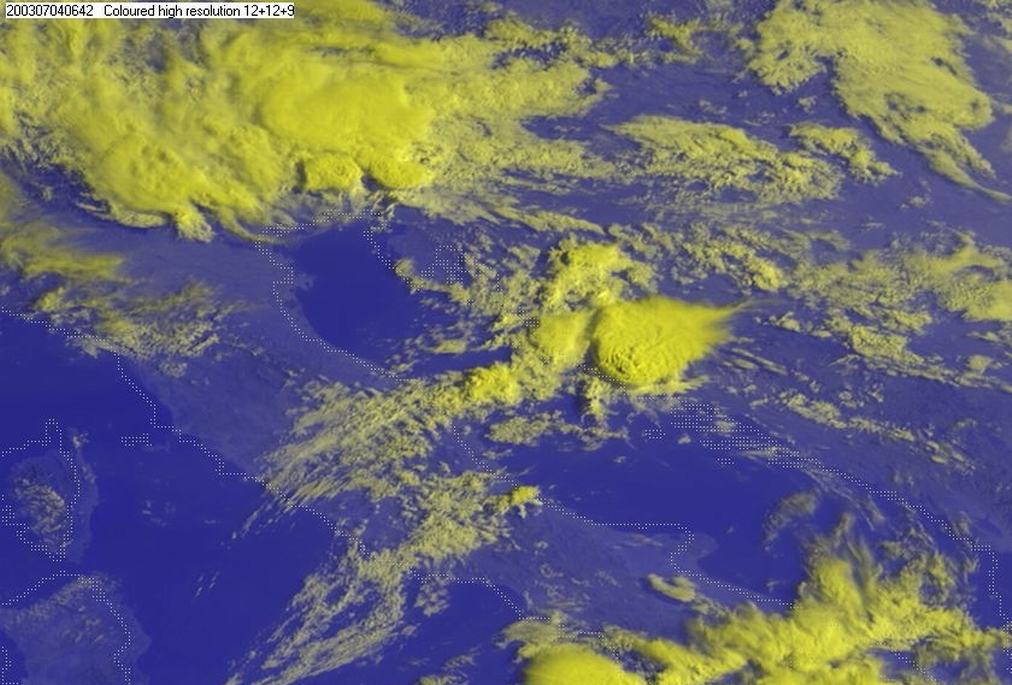
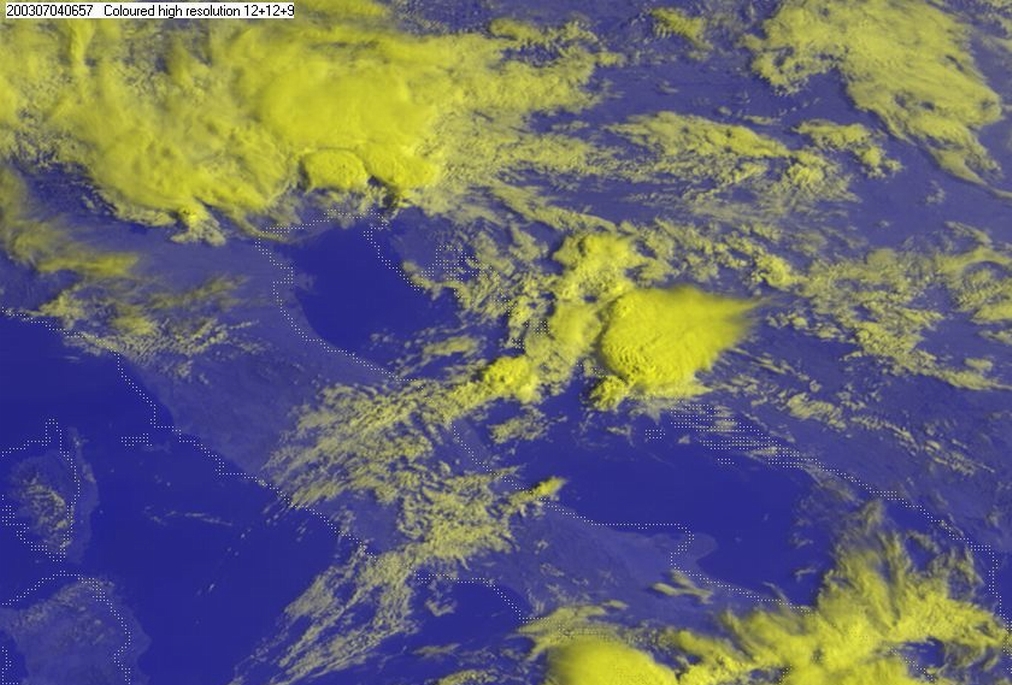
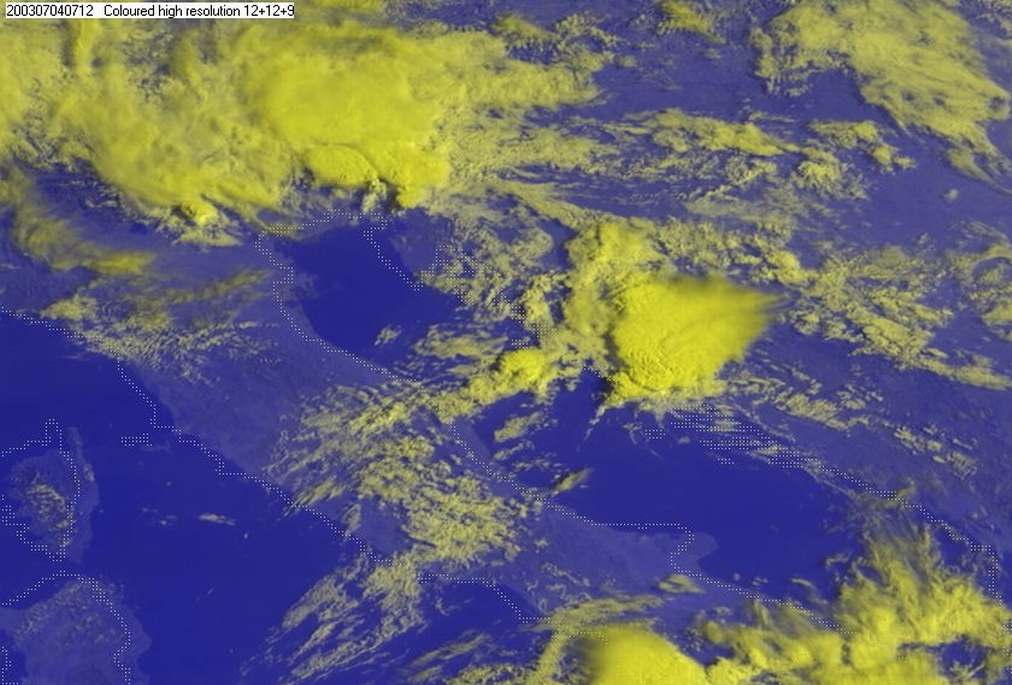
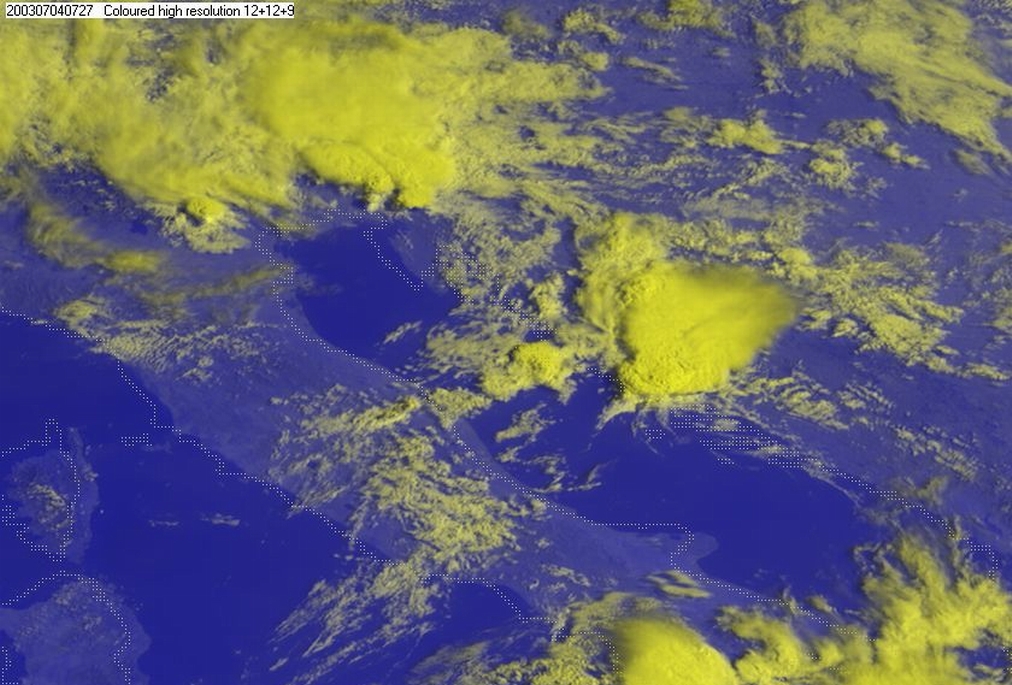
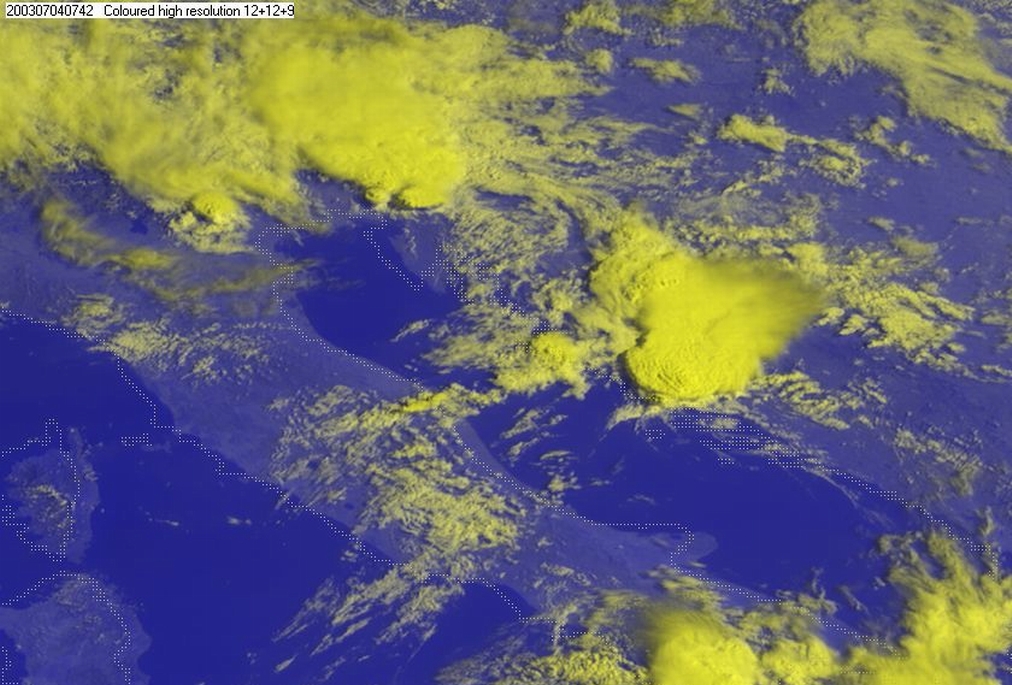
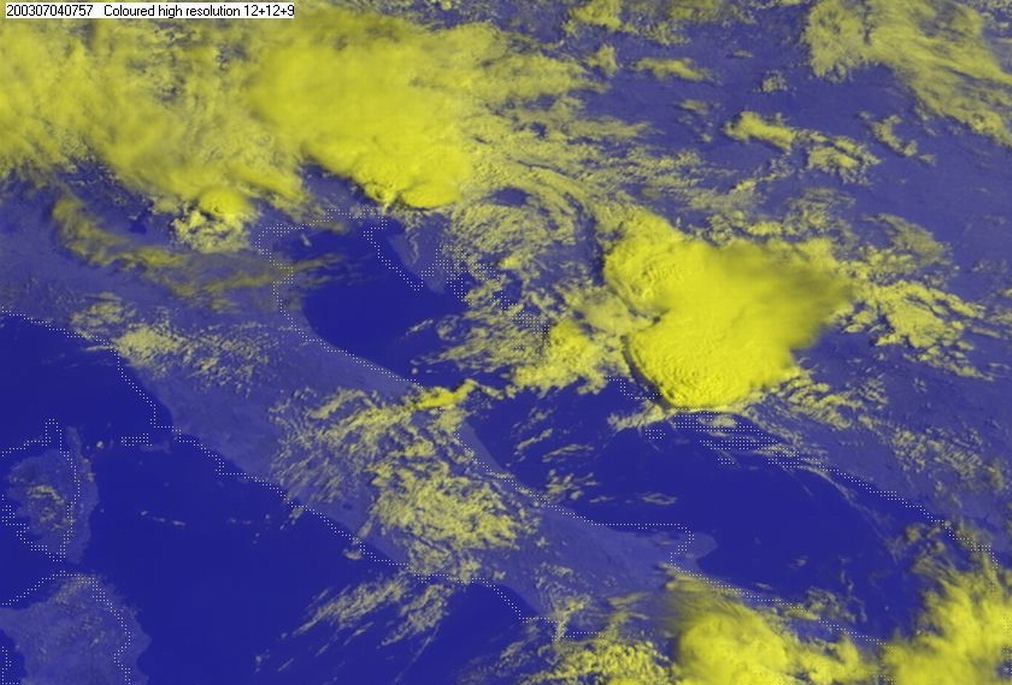
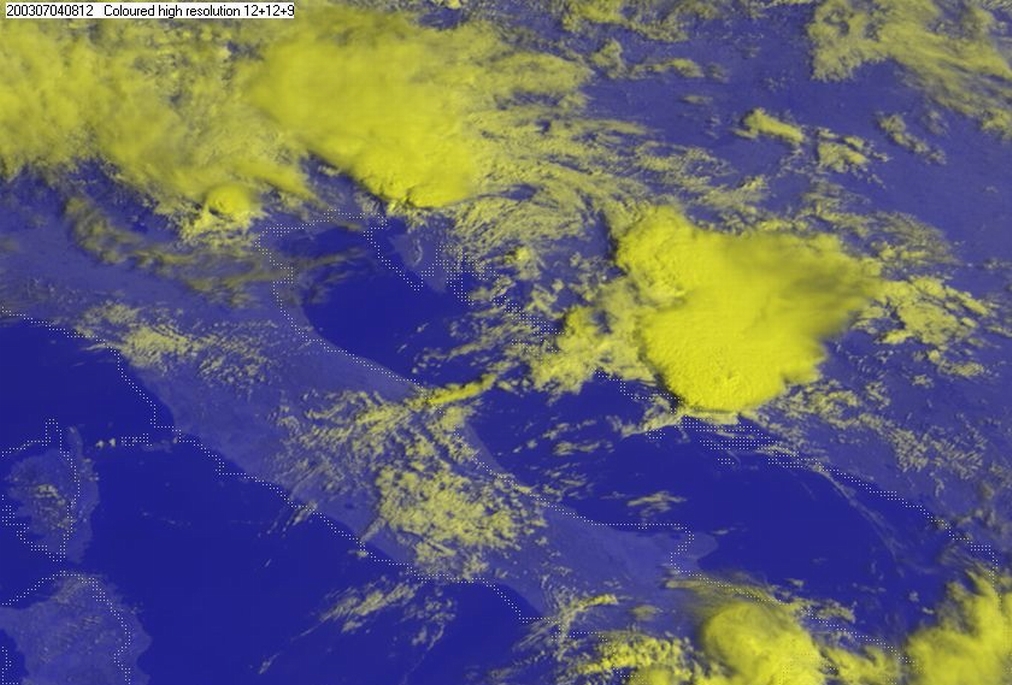
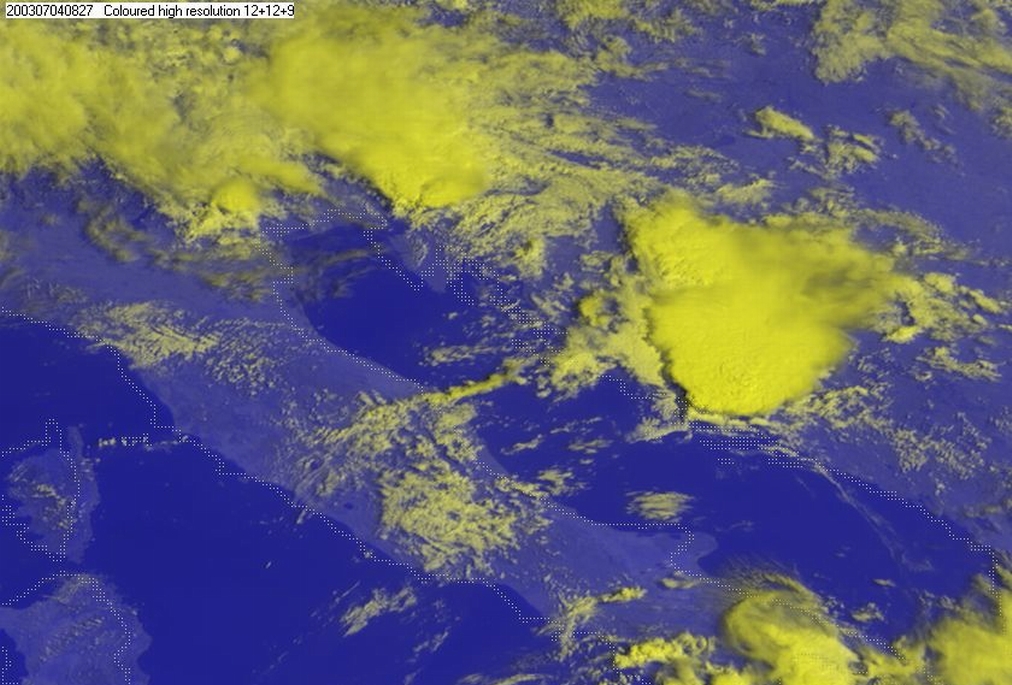
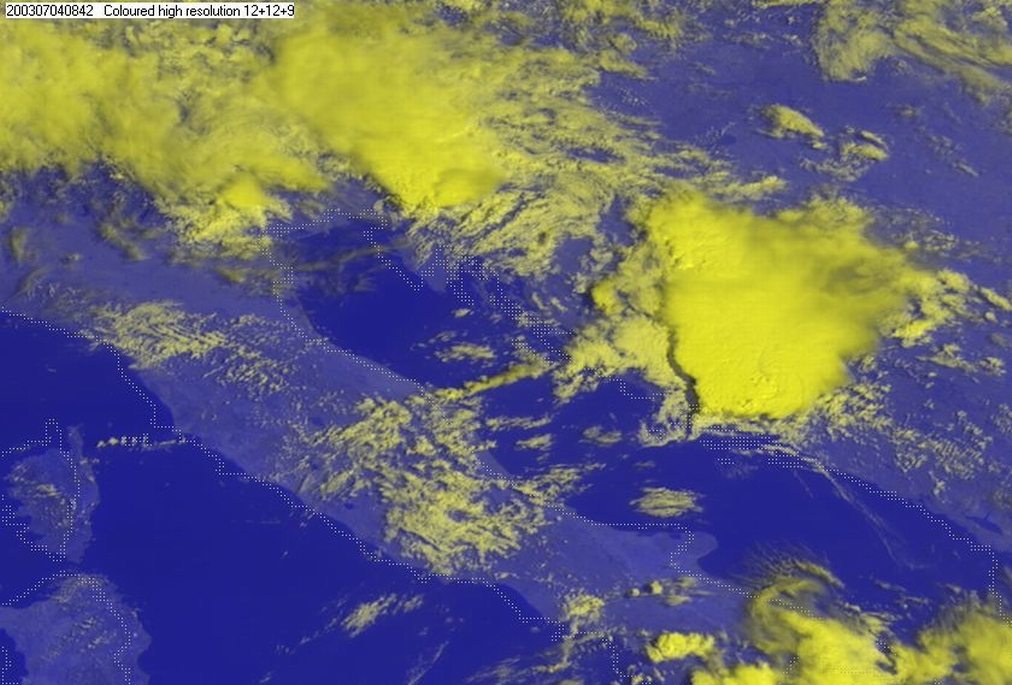
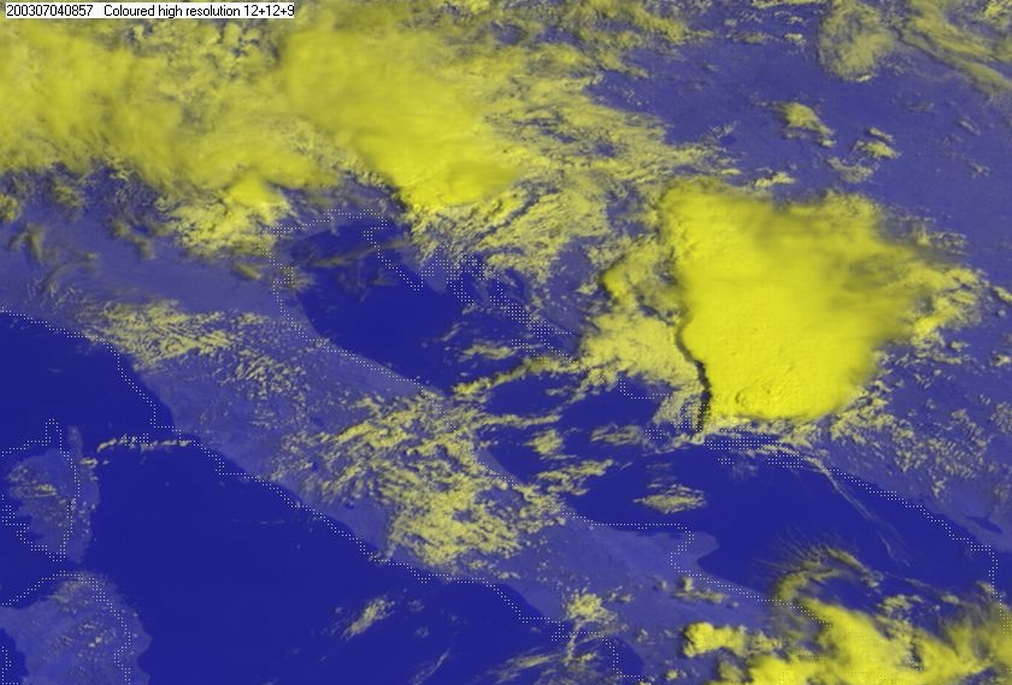
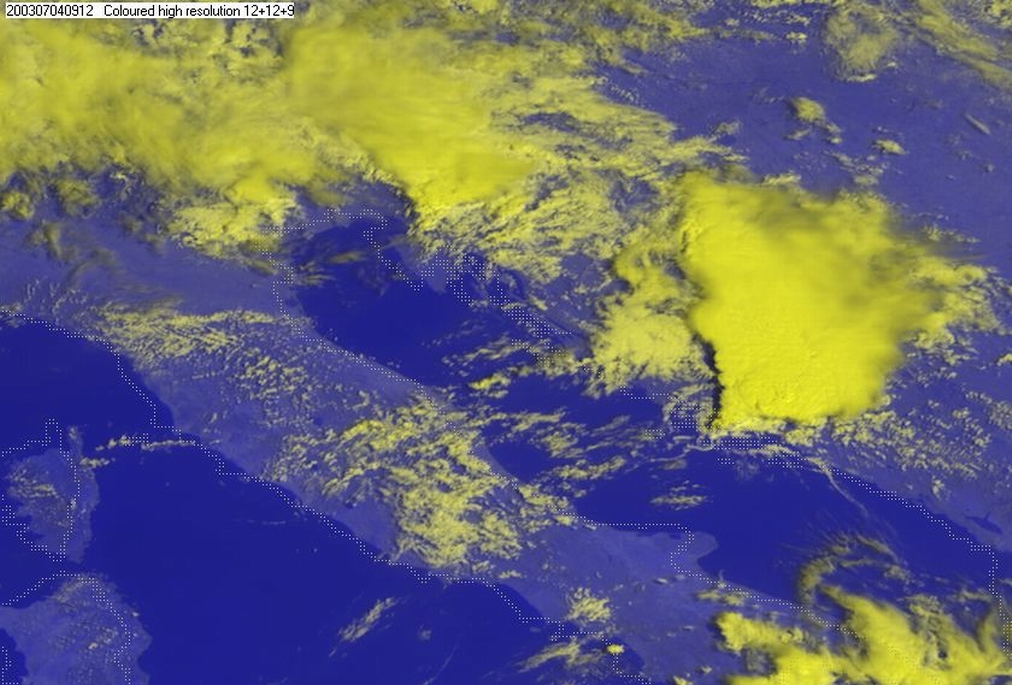
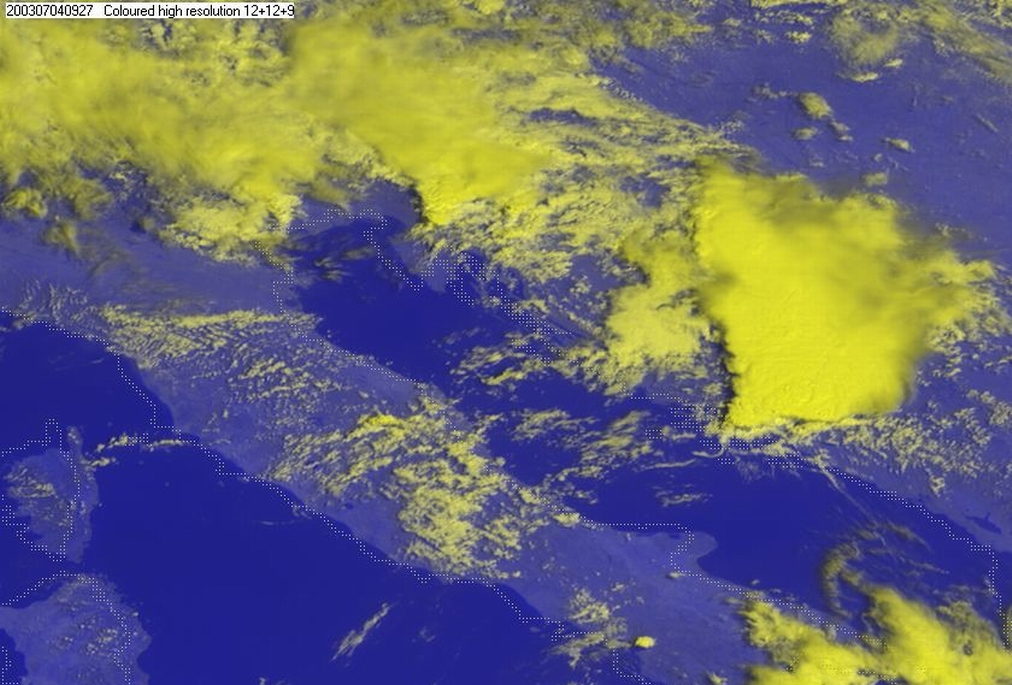
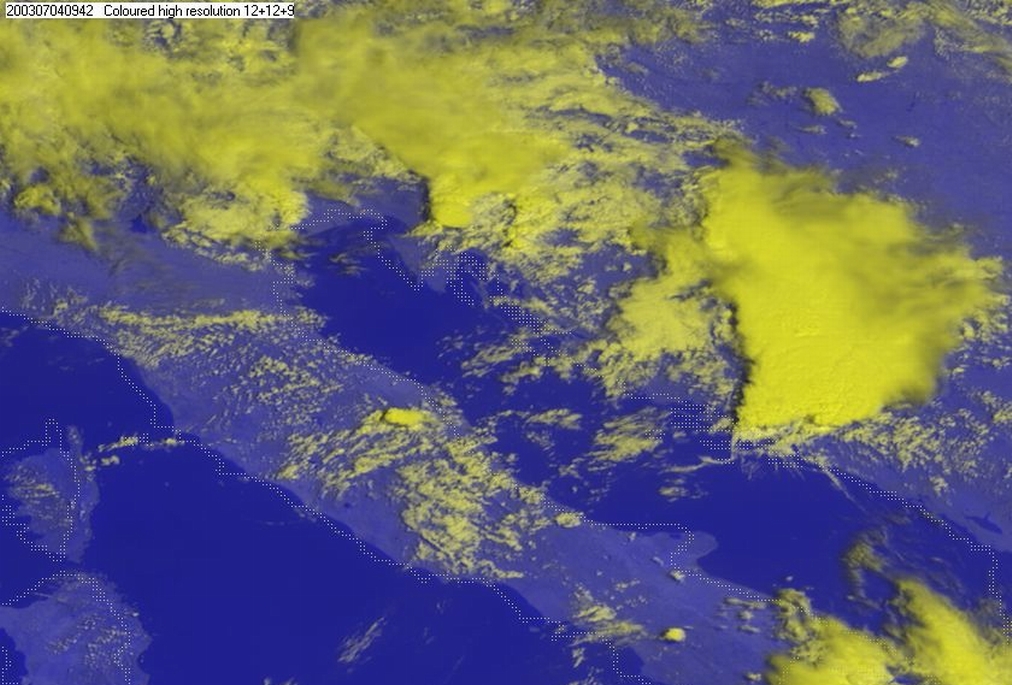
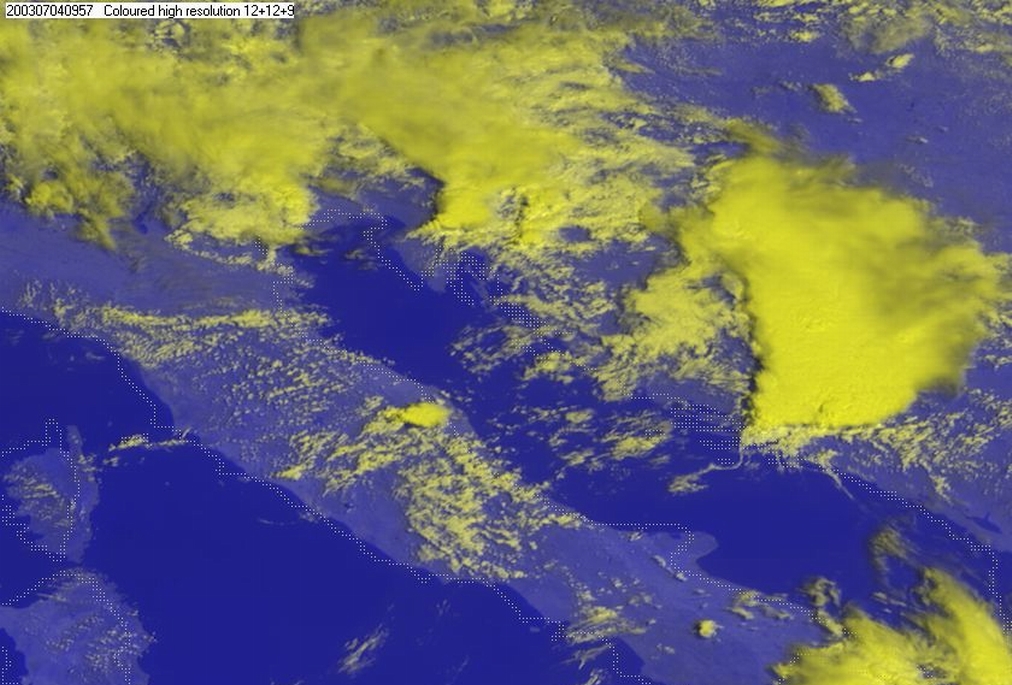
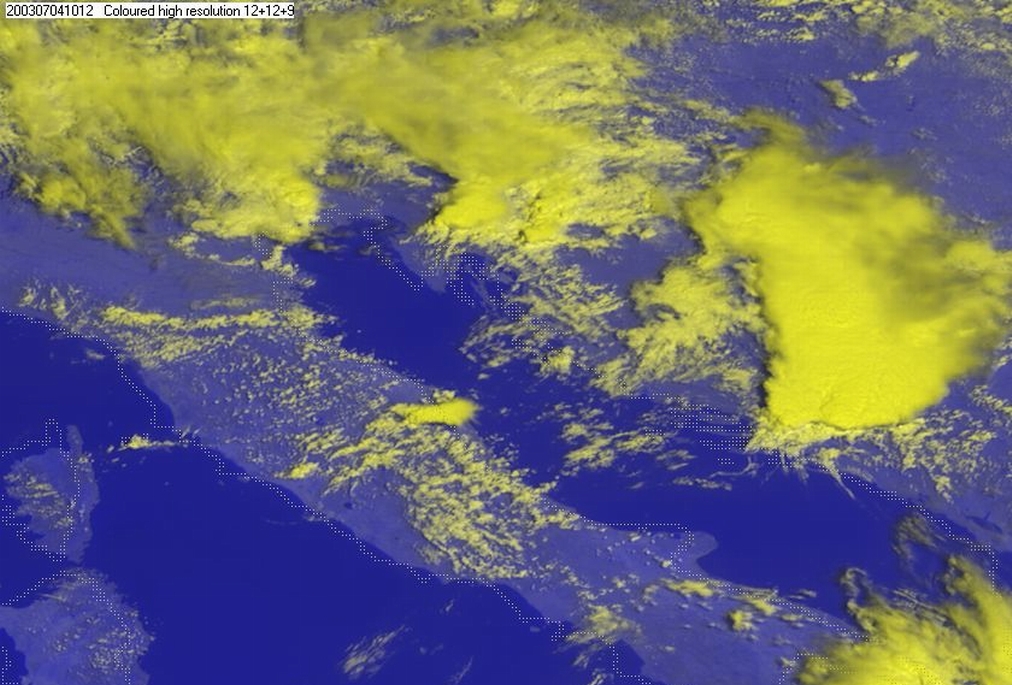
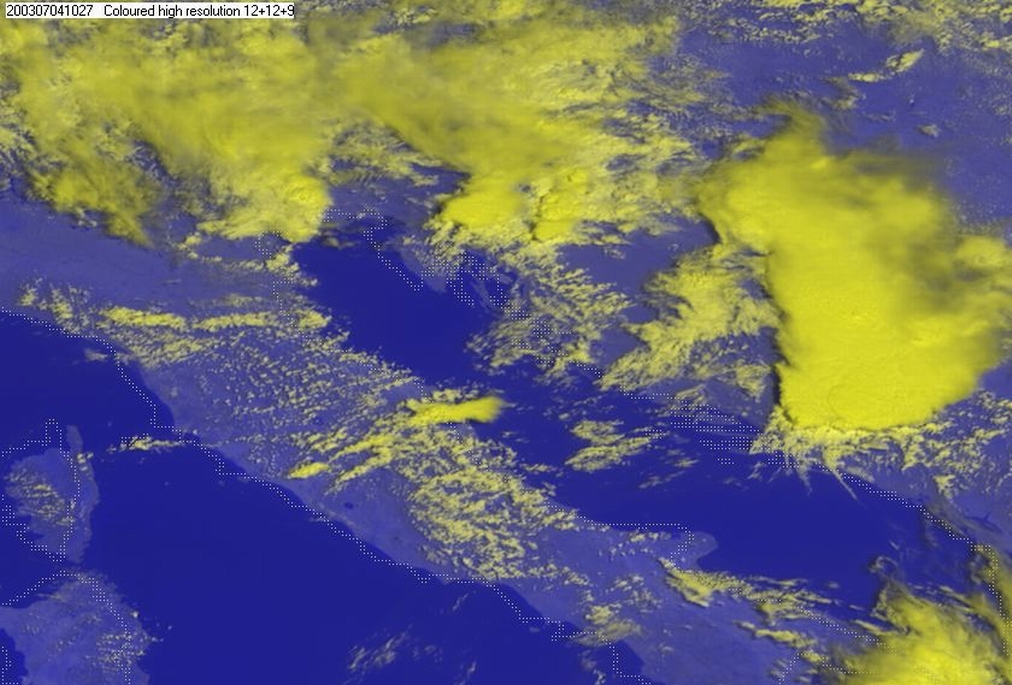
04 July 2003/ 04.00 - Meteosat 8 RGB composite HRVIS-HRVIS-10.8; 04.00 - 10.14 UTC quarter-hourly image loop
|

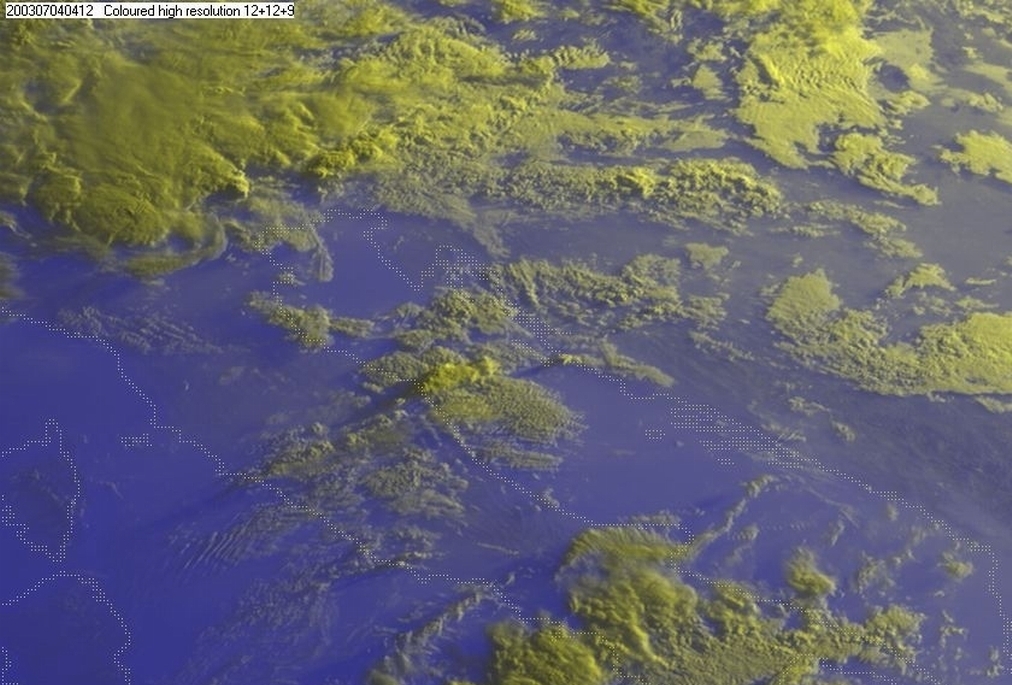
In order to emphasize both the visible (HRVIS) and the infra-red component, an RGB composite was produced with the high-resolution visible image on red and green part of spectrum, and IR 10.8 µm on blue. According to the MSG Interpretation Guide this combination of channels (HRVIS and 10.8 µm) is used to detect clouds and convection during daytime. With this combination a clear distinction can be made between thick Cb clouds and Ci anvils.
The development of the system started with a small cell in the Adriatic, moving towards the Croatian coast. The triggering of the strongest
convection seems to have taken place between 05.00 and 05.30 UTC, to the right of the initial cell. At 05:00 there was a line of small cells
over the island of Dugi Otok, spreading towards the mainland. At 05.15 the cell over the island is starting to grow while at 05.30 it is
already a well defined convective system with overshooting tops and an elongated shadow showing its huge vertical size. Over the next 30
minutes the cell developed rapidly and SYNOP stations in its vicinity already reported thunder and hail. In the 06.00 UTC image the
overshooting tops as well as the cirrus anvil are clearly seen. In channel 3.9 µm imagery ice clouds are darker then dense water clouds,
and the cirrus anvil above the cell is easily seen. In the image at 07.45 UTC, a plume over the anvil can also be detected. There is also a
tail-like line of low clouds that can be seen in all images after 07.15. This marks the outflow boundary from the convective system.
At the same time, convective development took place in the region of the Eastern Alps and western Croatia. That area was in the region of
strong PVA, in the left exit region of a jet streak (see Initial Weather Situation).
Model forecasts
From a forecasting point of view, it is clear that large-scale models are not capable of showing such a development, because it starts as a small-scale feature. However, at the larger scale, the situation indicated by the models was favourable for convective development.
Large scale model forecast (ECMWF)
ECMWF forecasts for 06.00 UTC indicated that the region from the North Adriatic, Northern Italy to the Alps was favourable for convective development. There was convergence in the lower layers, and strong upward motion at both 700 and 500 hPa.
|
04 July 2003/06.00 UTC - Meteosat IR image; cyan: divergence 850 hPa
|
04 July 2003/06.00 UTC - Meteosat IR image; magenta: vertical motion (omega) 700 hPa
|
|
|
|
|
|
04 July 2003/06.00 UTC - Meteosat IR image; magenta: vertical motion (omega) 500 hPa
|
|
In addition there is strong PVA forecast for the upper layers, associated with the jet and its exit region.
|
04 July 2003/06.00 UTC - Meteosat IR image; green: vorticity advection 300 hPa
|
04 July 2003/06.00 UTC - Meteosat IR image; yellow: isotachs 300 hPa
|
|
|
However, looking more closely at the images, it can be seen that conditions were favourable for convective development but parameters pointed more to the Alpine region then to the mid-Adriatic. Indeed, there was some strong development taking place in the Alpine region, which was caught by the model, whereas the secondary development in the Adriatic was not detected.
Vertical cross sections
To show the large-scale vertical structure two cross-sections were computed across the region where the strongest convergence in the Adriatic was presumably triggered.
|
04 July 2003/06.00 UTC - Meteosat WV image; position of vertical cross section indicated
|
04 July 2003/06.00 UTC - Vertical cross section; black: isentropes (ThetaE), cyan thick: vertical motion (omega) - upward motion, cyan
thin: vertical motion (omega) - downward motion, orange thin: IR pixel values, orange thick: WV pixel values
|
|
|
|
|
|
04 July 2003/06.00 UTC - Vertical cross section; black: isentropes (ThetaE), yellow: isotachs, orange thin: IR pixel values, orange
thick: WV pixel values
|
|
Mesoscale convective systems such as this are usually very difficult to forecast because their own internal dynamics evolve on a small scale, and, as a consequence, this isn not well reflected in operational synoptic scale numerical models. Although quasi-geostrophic triggering conditions were present in this case, they are relatively slow in producing precipitation. So in order to produce convection of such intensity there must have been additional mesoscale processes.
Meso-scale model forecasts (ALADIN)
To get closer to the scale of the event, meso-scale model output is studied. The model used is the Aladin model, with 8 km resolution, and which is operationally run at DHMZ.
One of the parameters that gave an indication of development at approximately the right time and place was CAPE (Convective Available Potential Energy).
|
04 July 2003/00.00 - ALADIN model forecasts (model run 03 July/12.00 UTC); blue: Convective Available; 00.00 - 13.00 UTC hourly image
loop
|
|
However, looking more closely at the humidity field at 700 hPa, it is clear that the development was ecpexted more to the north and west, and that convection over the southern part was too late, when compared to the actual time of development.
|
03 July 2003/21.00 UTC - ALADIN model forecasts (model run 03 July/12.00 UTC); blue: relative humidity at 700 hPa level (%); 03/21.00 -
04/14.00 UTC hourly image loop
|
|
In the vertical cross section (across the island where convection was triggered), what catches the attention is the rather abrupt change of wind direction with height in the vicinity of mainland. This feature is caused by a land-sea circulation being overrun by south-westerly upper level stream.
|
04 July 2003/00.00 UTC - ALADIN model forecasts (model run 03 July/12.00 UTC); white lines: temperature, arrows: horizontal wind, grey
shades: isotachs; 00.00 - 12.00 UTC hourly image loop
|
|
Besides this, the horizontal wind field also shows some interesting features. A dynamical adaptation of ALADIN model, on a 2×2 km grid, for the area of interest is shown. A Convergence Line (marked by red dashed line) can be clearly observed at 00.00 UTC, pointing towards the island where convection was presumably triggered. At 06.00 UTC convergence was again indicated, but a little more to the south.
|
04 July 2003/00.00 UTC - ALADIN model forecasts (model run 03 July/12.00 UTC); arrows: 10 m wind, colour shades: isotachs, red: line of
convergence
|
04 July 2003/00.00 UTC - ALADIN model forecasts (model run 03 July/12.00 UTC); arrows: 10 m wind, colour shades: isotachs, red: line of
convergence
|
|
|
This combination of horizontal wind convergence and strong vertical wind shear probably played an important role in triggering the convection.
Taking into account all analyzed forecast material the following can be concluded:
- Large scale models (in this case ECMWF) are capable of showing overall characteristics of the atmosphere and can give some idea about how favourable the conditions are for convective development. Limits of these models are, on one hand, the resolution which is far too small to precisely catch small-scale development and, on the other hand, the physics of the model which, by making the atmosphere hydrostatic, dont allow the occurence of non-hydrostatic developments. In other words: it is not possible to determine the exact time and place of convective development with the large-scale models.
- Meso-scale models (in this case ALADIN) come closer to the real situation. Some parameters can give a very good indication of what is going on. However, despite their higher resolution, even meso-scale models are not very accurate in predicting the exact time and place of the event.
Nowcasting
The case of the hailstorm in Dalmatia in July 2003 was a classic case of severe convective development growing out of a rather small scale feature. It was not well detexted by large-scale models and it could only be partly forecast using a meso-scale model. Therefore, nowcasting tools based on satellite imagery were the best to follow the development.
Nowcasting methods used in the following pages were developed within a joint project of five Central European countries. Results are based on
the use of satellite imagery only. For the purpose of following the development, several nowcasting tools are used together:
Atmospheric Motion Vectors - calculated from the displacement of clouds between two consecutive images
Convective Cells - automatically detected, and based upon the radius and brightness temperature of the
features
Development contours - motion corrected change of cloud top temperature between two consecutive images.
|
04 July 2003/04.30 - Meteosat IR image; red, orange and yellow crosses: convective cells, yellow, pink and violet lines: development,
light blue and blue: decay, green arrows: atmospheric motion vectors, weather reports; 04.30 - 12.00 UTC half-hourly image loop
|
|
At 04.30 UTC a convective cell was detected and its initial development was seen over the island of Dugi Otok. On the next image it already grows into a deeper cell, then developing further, with first reports of thunderstorms in the region. Half an hour later, again over the same island, there is more development, with the cell now growing rapidly, and with a lot of thunder and some hail reported at 06.00 UTC.