Weather observations
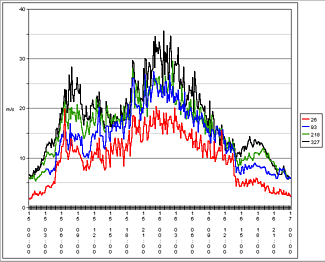
A time series of observed 10 minute average winds in southern Finland, Kivenlahti (60N/25E) shows two wind maxima. The first maximum was observed during the morning of 15 November, when the wind was southwesterly in the warm airmass. The second wind maximum was observed the following night (15 to 16 November); the wind was then north-northwesterly and clearly very gusty, as even the 10-minute average values alternated significantly between consecutive measurement periods. This is best seen in wind observations in upper levels taken during the early hours of 16 November.
Wind observations at the lowest level (26 m AGL) show maximum sustained winds several times slightly exceeding 20 m/s, which is highly exceptional even for coastal areas.
|
10-minute-average wind measurements from Kivenlahti, Espoo, south coast of Finland (60N/25 E). red: wind at 26m, blue: wind at 93m,
green: wind at 218m, black: wind at 327m AGL.
|
|
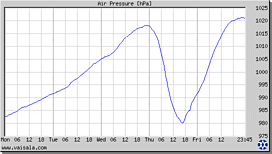
Surface pressure changes were rapid and large during the catastrophic event. Pressure first rose when the low centre (over Russia) moved further east and a surface high pressure ridge approached from the west. The passage of the intense low is seen as a rapid drop in surface pressure on Thursday 15 November. The pressure fall stops abruptly at 17.00 UTC and starts to rise as rapidly as it fell.
|
Vaisala measurements on pressure. Measurement site Helsinki Vantaa (60N/25E)
|
|
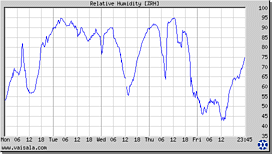
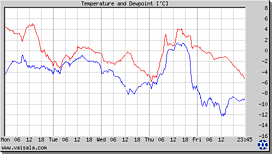
A time series of relative humidity also shows interesting features. At first the humidity is quite high, near 80 %. Dry air streams from the north and by Friday 16 November, at 00.00 UTC, relative humidity drops to 55%. After the passage of the gravity wave the air becomes even drier. The minimum relative humidity in southern Finland in the afternoon on the 16th of November 2001 was only 43% and the temperature around -1 degree Celsius. This is an exceptionally low combination of temperature and humidity in southern Finland in November.
|
Measurements of humidity. Measurement site Helsinki Vantaa (60N/25E)
|
Measurements of temperature (red) and dew point temperature (blue). Measurement site Helsinki Vantaa (60N/25E)
|


