Verifying NWP Wind Fields With ASCAT Wind Data
ASCAT wind data provide detailed information on 10 meter surface winds over oceans and lakes. These wind vectors are far more precise than surface wind charts from model data as can be seen in Figure 19. Scatterometer winds show convergence and shear, areas with increased wind speed, the position of surface pressure minima and even the intensity of fronts near the ocean surface. Wind drag on the ocean surface induces waves which propagate and finally reach coasts. They can cause damage and life threatening situations for people living near the shore. High Swell also has a damaging potential for coastal areas but cannot be detected by scatterometers.
|
|
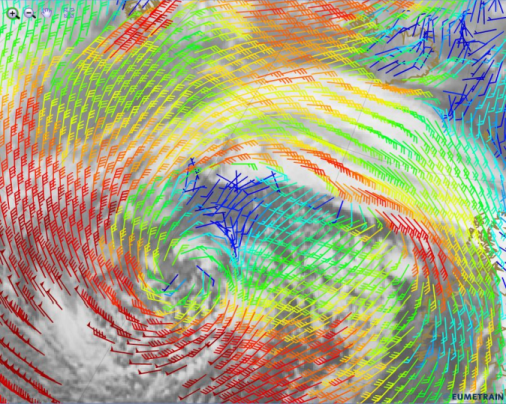
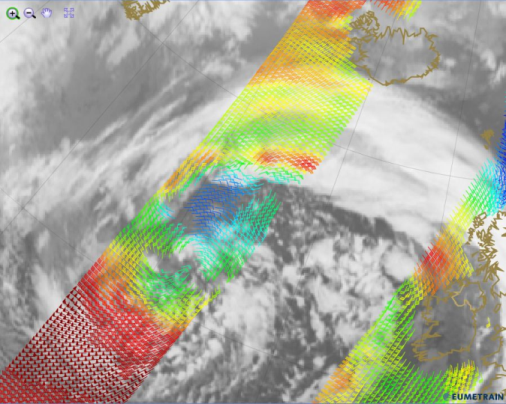
Figure 19: Model 10m wind speed (ECMWF) and ASCAT wind speed data from 5 January 2014 at 12:00 UTC. Apply the slider to compare predicted and real wind direction.
Figure 19 shows a comparison of NWP data with ASCAT wind speed data at 10 meters above the ocean surface for the storm Christina. While both data sources show good agreement, the scatterometer data has a much finer resolution and shows some discrepancies in the region of light wind speeds north of the pressure minimum (blue arrows).
By comparing measurements of wind speed and direction with NWP surface pressure fields, the meteorologist can evaluate the quality of the model forecast. Figure 20 shows such a comparison between ASCAT wind data and the ECMWF mean sea level pressure field. Taking a time delay of 2 hours between both fields into account, the position of the forecasted surface low is in good accordance with the measured data.

Figure 20: ASCAT wind field and ECMWF forecast (+12h) of the mean sea level pressure for 5 January 2014 at 00:00 UTC.
ASCAT wind data can be used to analyze the position and severity of surface fronts over the oceans. Figure 21 shows the cyclone Ruth, located west of the British Isles on 7 January 2014. At that time, Ruth had become a winter storm with gale force winds up to 8 Beaufort. ASCAT measured storm force winds, force 10 (50kts)! The ASCAT overpass shows high wind speeds near the center of the low (red wind barbs) and a steep gradient next to the Irish coast at the location of the yellow wind barbs.

Figure 21: Two ASCAT overpasses over the storm Ruth on 7 February 2014 at 10:16 UTC (right stripe) and 12:01 UTC (left stripe). The IR10.8 μm image is from 12:00 UTC.
Within the next 12 hours, the southern part of Ireland and Cornwall were hit by the storm as it reached a force of 11 to 12 Beaufort. Valentia (Ireland) recorded 24 mm of rain in 24 hours.
The ASCAT measurements show strong surface winds over the Atlantic between Iceland and Greenland on 7 February 2014 at 12:00 UTC (see Figure 22). Strong surface winds transfer their momentum into the water and create waves. There is a high degree of correlation between wind speed and significant wave height.
Where ASCAT measurements show wind speeds between 35 and 40 m/s, significant wave height determined from Jason-2 reaches 7 meters and more.
|
|
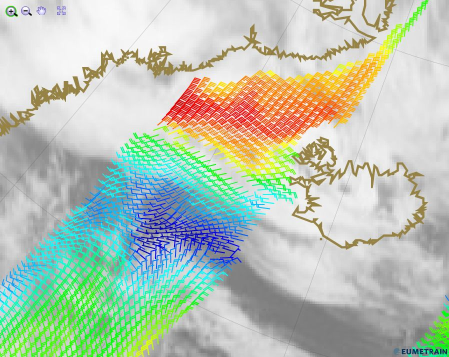
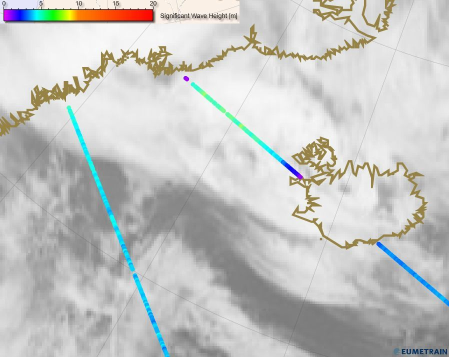
Figure 22: Comparison between ASCAT wind data and JASON-2 significant wave height data for 7 February 2014 at 12:00 UTC. Apply the slider to compare both data sources.