Table of Contents
- I. Introduction and SatRep Diagnosis for 02 August 1997/06.00 UTC
- II. Development of Upper Level Low and Rapid Cyclogenesis
- III. Diagnosis for 03 August 1997/00.00 UTC
- IV. Diagnosis for 03 August 1997/06.00 UTC
- V. Very Short Range Forecast from 03 August 1997/06.00 UTC - 18.00 UTC
02 - 03 August 1997 - Introduction
This case study deals in the first instance with a rapid cyclogenesis development over the Atlantic and its eastward movement to the British Isles. But the main feature is a delay in rapid cyclogenesis development because of the development of an upper level low in the same area. In other words, it is an example where two conceptual models act together or are superimposed, and the task is to find features for being able to separate them. Similar problems can also be found in the case study of 19 February 1997.
Another reason for the selection of this case study was the fact that the LAM numerical model forecast (HIRLAM) did not forecast the situation resulting in heavy rain over Ireland at all, or at least not in the right geographical position. Therefore it is important to look into this case study also from the viewpoint of whether satellite imagery is able to revise the wrong forecast at least for the VSRF period.
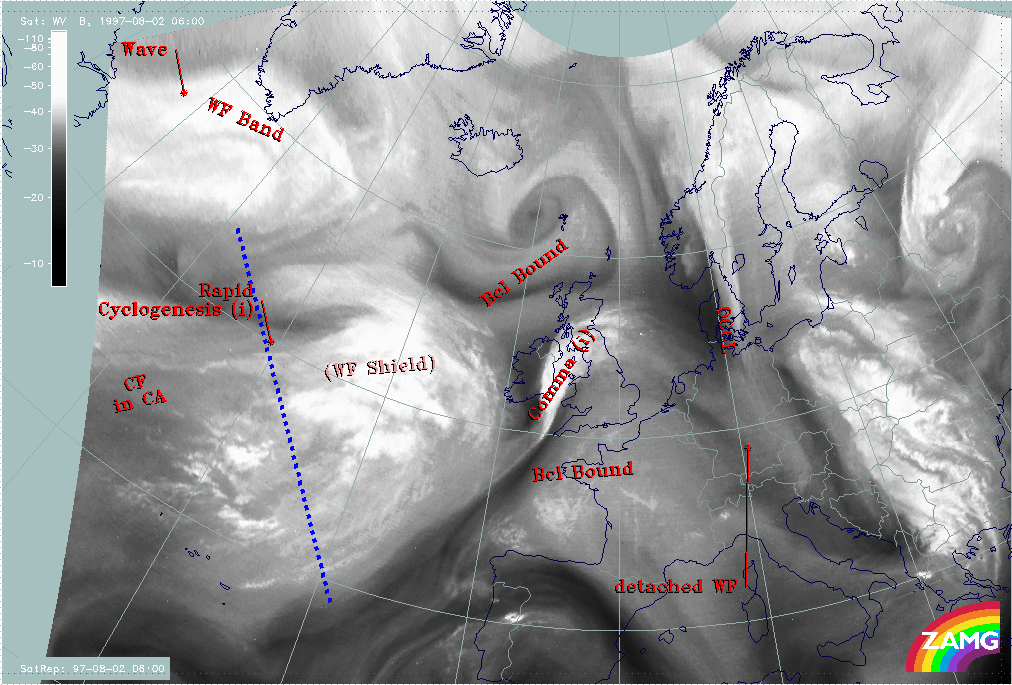
02 - 03 August 1997 - Overview Of Satellite Imagery For 02 August 06.00 UTC
|
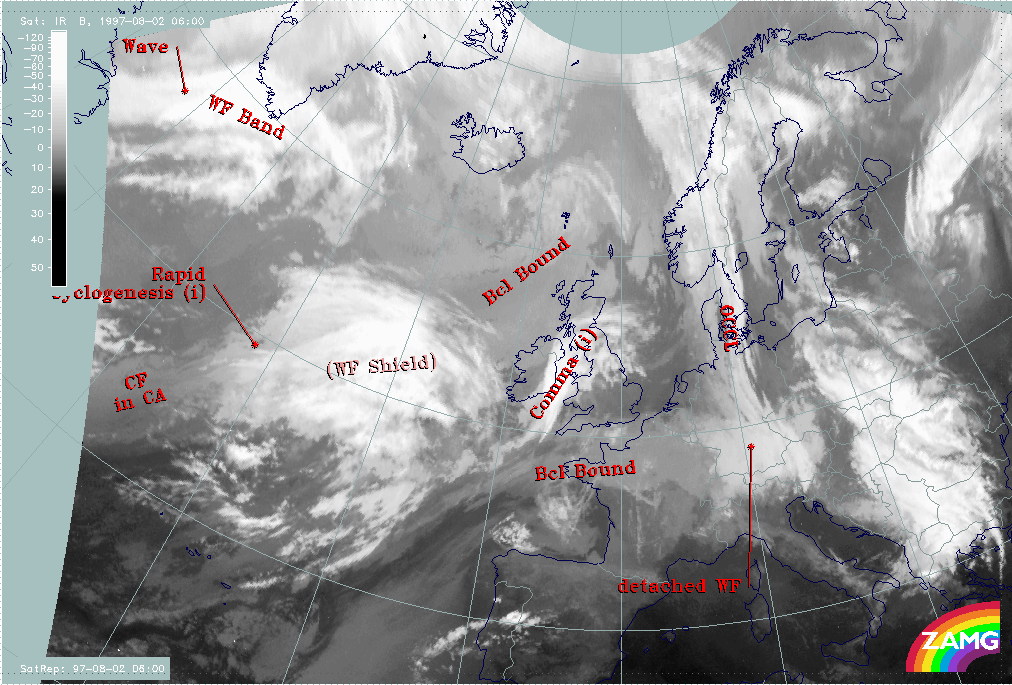
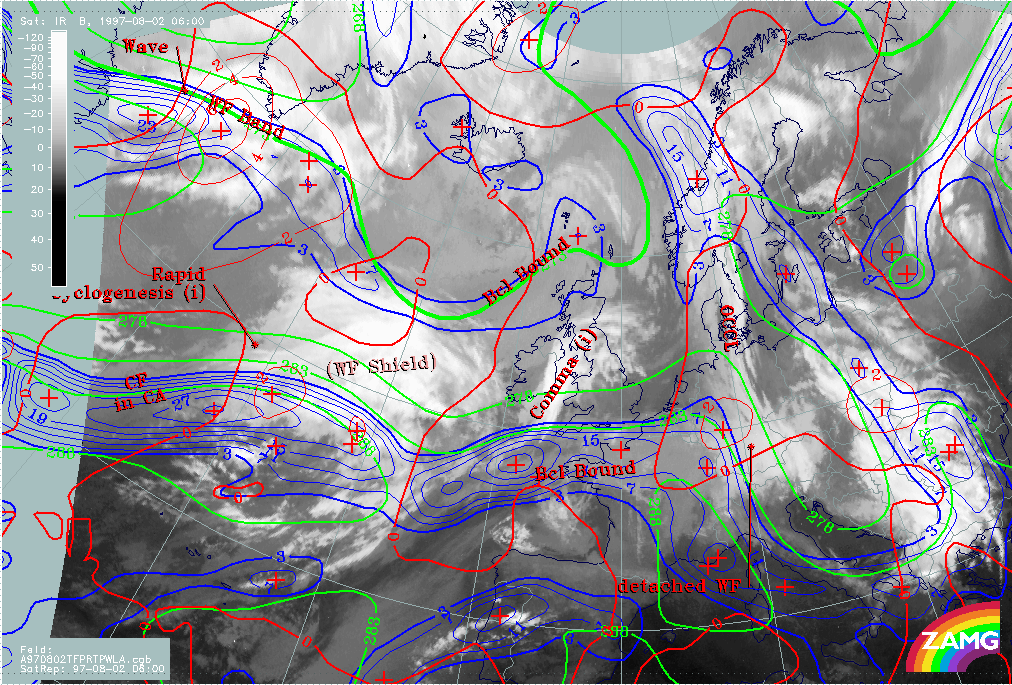
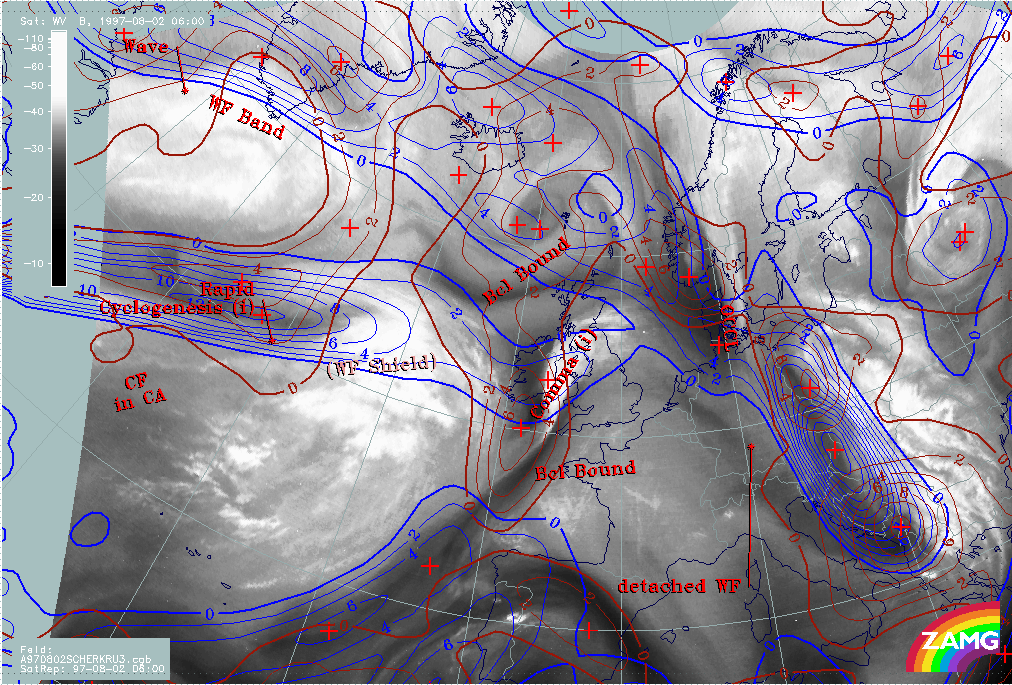
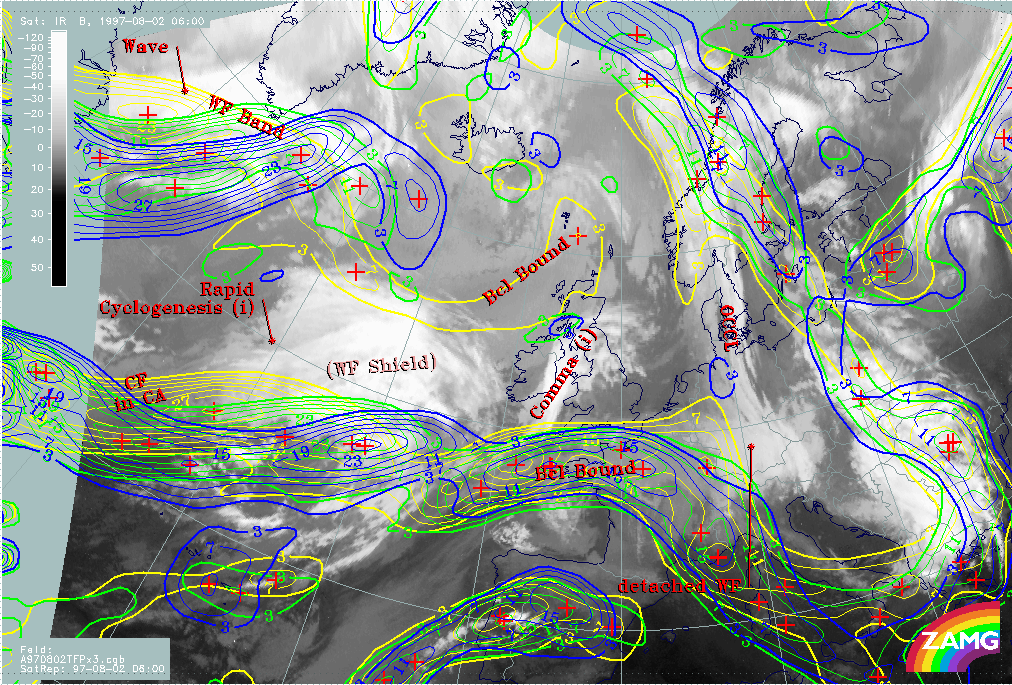
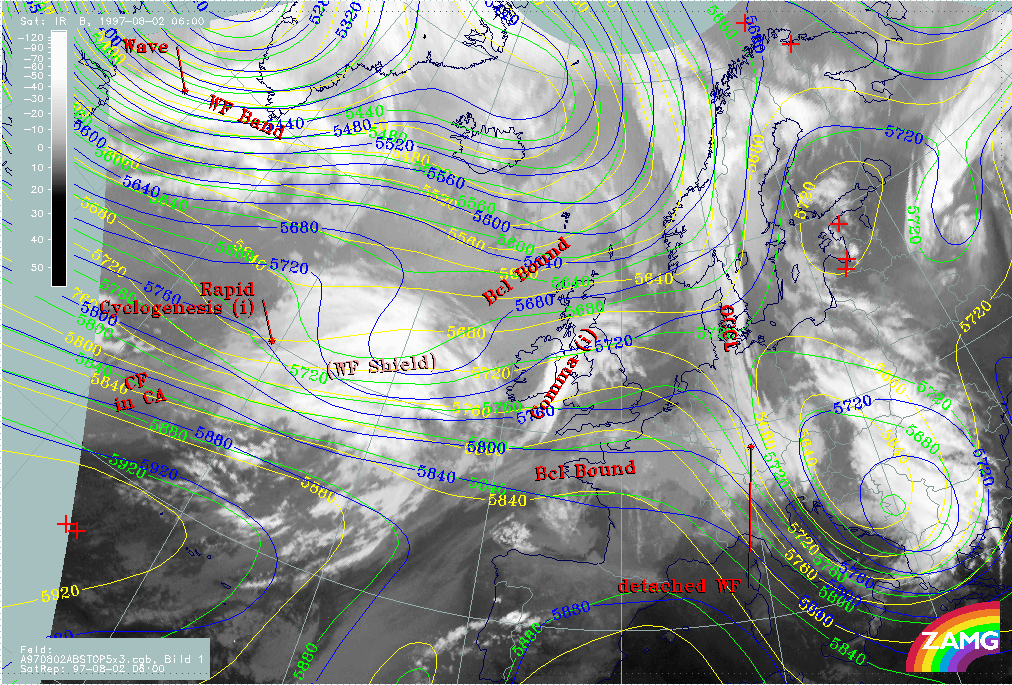
02 August 1997/06.00 UTC - Meteosat IR image; SatRep overlay: names of conceptual models
|
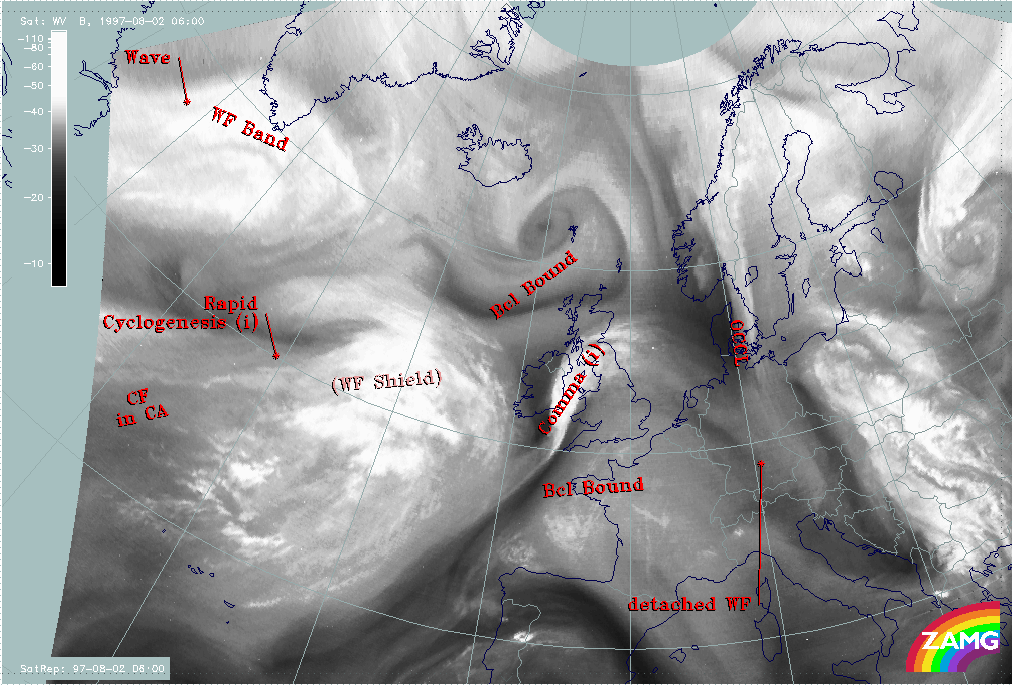
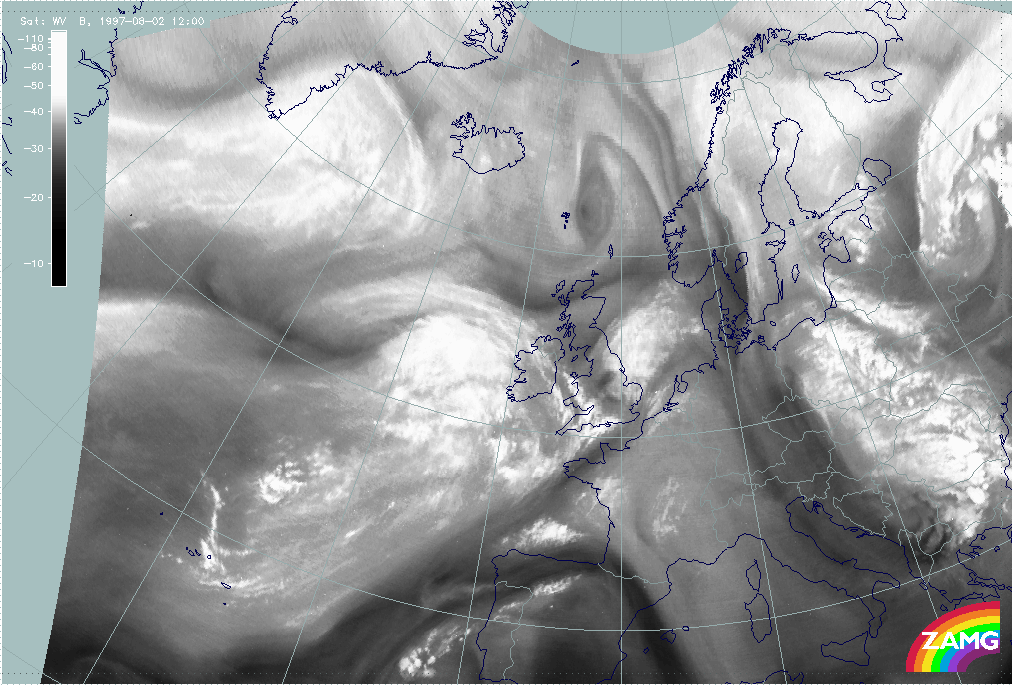
02 August 1997/06.00 UTC - Meteosat WV image; SatRep overlay: names of conceptual models
|
|
|
|
|
|
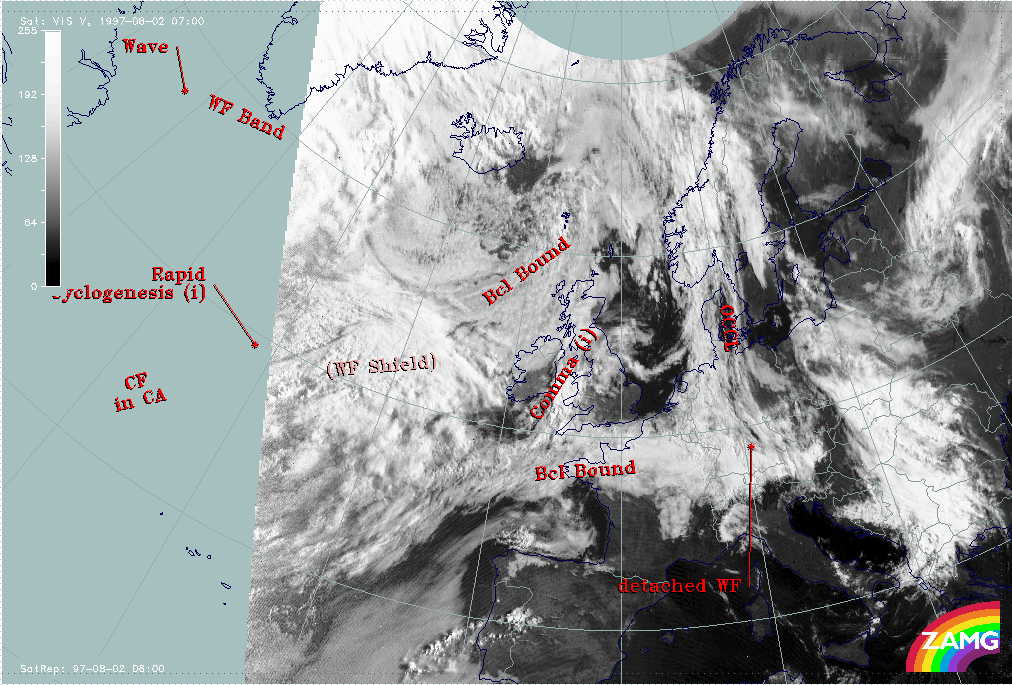
02 August 1997/07.00 UTC - Meteosat VIS image; SatRep overlay: names of conceptual models
|
|
The images show the SatRep of this day by means of the identified conceptual models superimposed on all three Meteosat channels. The following conceptual models will be discussed:
- Comma feature (Comma) over Ireland and England:
This consists of thick multilayered cloudiness with a stripe of very dry air at its rear side (compare Conceptual Models: Comma ). - Warm Front Shield (WF Shield) west of Ireland:
The cloud shield is very significant and well-developed in the IR and VIS image and is represented by thick multilayered cloudiness. In the WV imagery the typical warm conveyor belt structure can be detected (compare Conceptual Models: Warm Front Shield ). - Cold Front in Cold Advection (CF in CA) near the western edge of the image panel:
In the IR image a cloud band with rather low, warm tops can be noticed; the WV features correspond much more to the warm conveyor belt in the east and to the jet feature in the north (compare Conceptual Models: Cold Front in Cold Advection ). - Rapid Cyclogenesis (Rapid Cyclogenesis) west of the Warm Front Shield:
There are some indications from satellite imagery for a Rapid Cyclogenesis taking place:- There are two cloud layers, especially a lower one protruding from below a higher one, and
- In the WV imagery a black dry stripe extends parallel to the edge of the higher cloud system.
02 - 03 August 1997 - Key Parameters On Isobaric Surfaces For 02 August 06.00 UTC
|
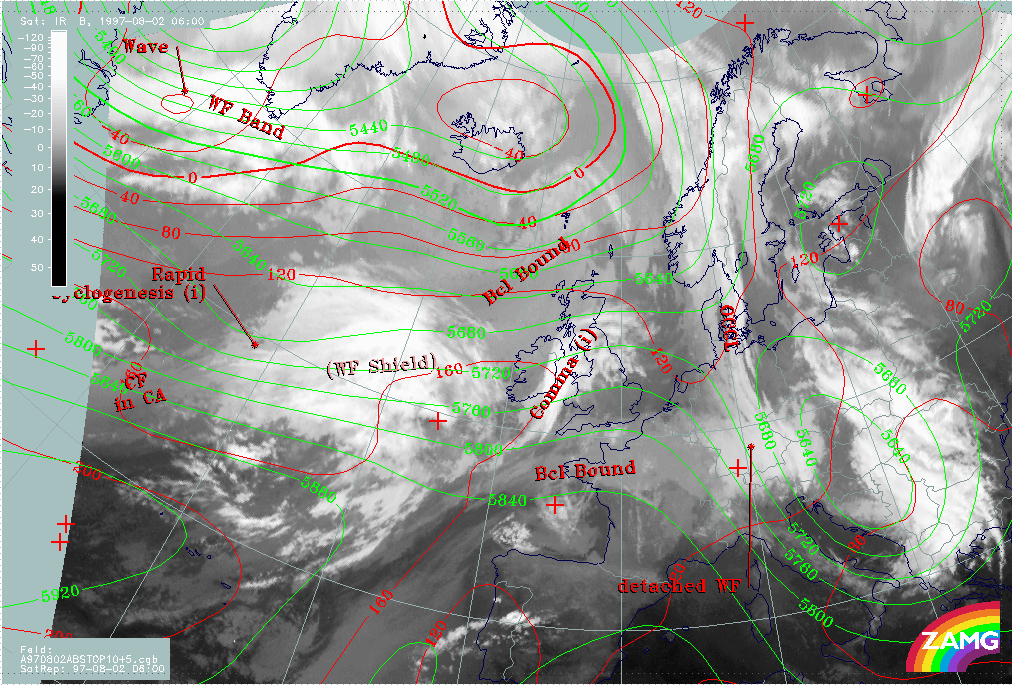
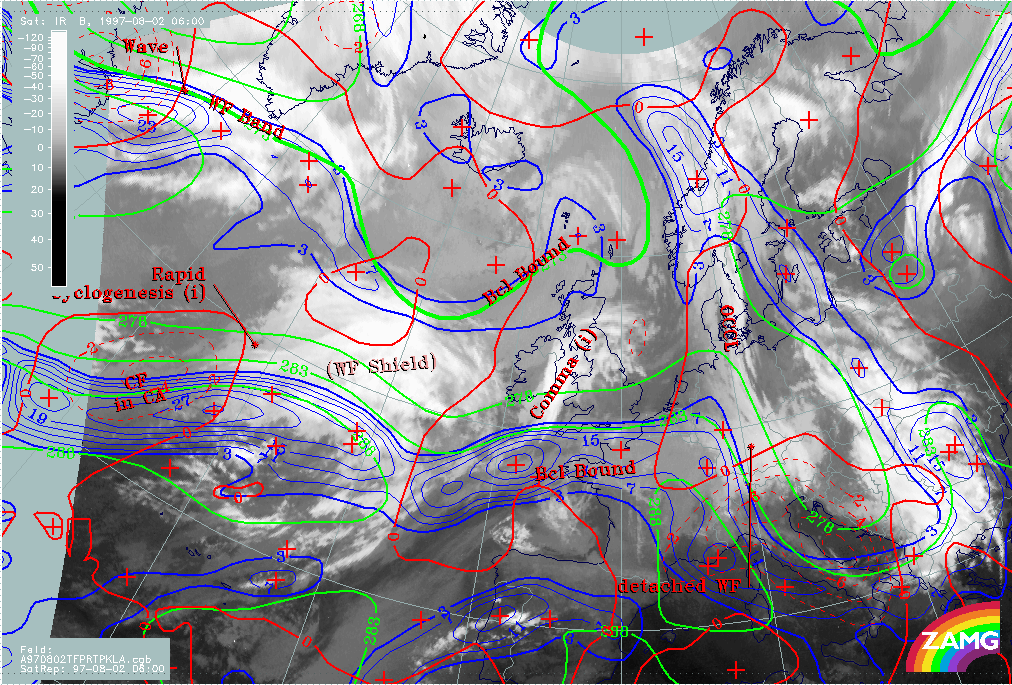
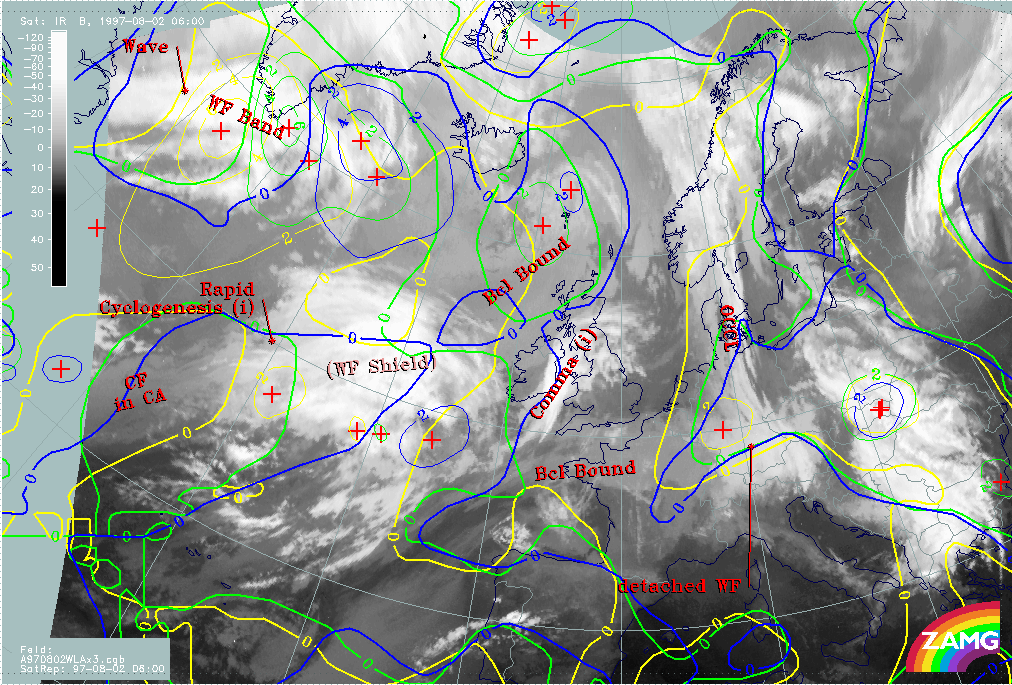
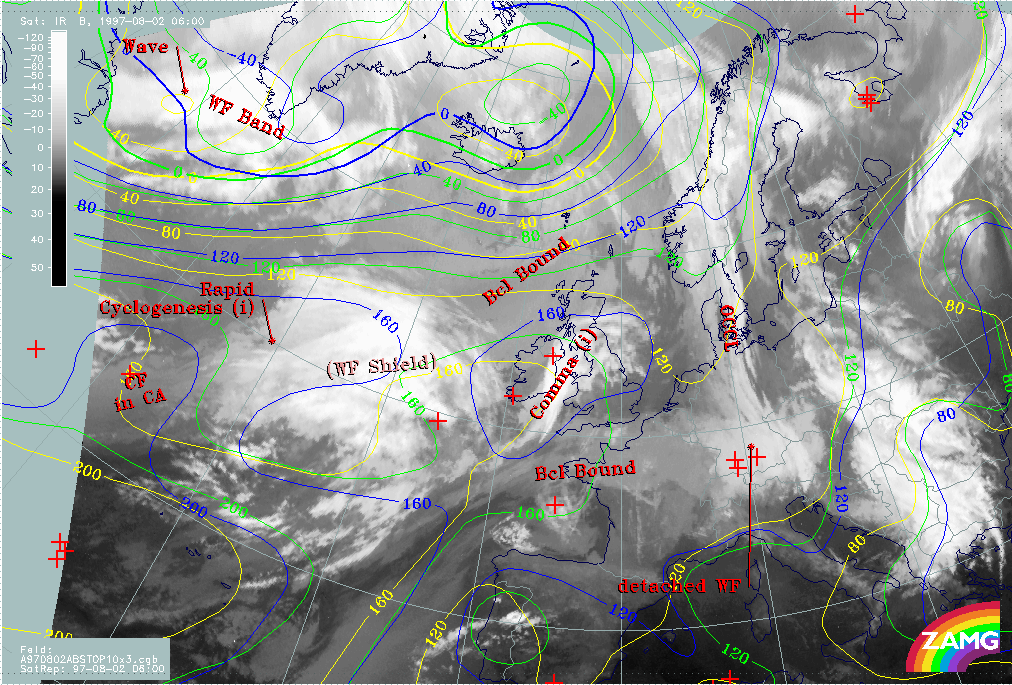
02 August 1997/06.00 UTC - Meteosat IR image; red: height contours 1000 hPa, green: height contours 500 hPa; SatRep overlay: names of
conceptual models
|
02 August 1997/06.00 UTC - Meteosat IR image; blue: thermal front parameter (TFP) 500/850 hPa, green: equivalent thickness 500/850
hPa, red: temparature advection - WA 1000 hPa; SatRep overlay: names of conceptual models
|
|
|
|
|
|
02 August 1997/06.00 UTC - Meteosat IR image; blue: thermal front parameter (TFP) 500/850 hPa, green: equivalent thickness 500/850
hPa, red: temparature advection - CA 1000 hPa; SatRep overlay: names of conceptual models
|
|
To enhance the existence of the conceptual models mentioned above relevant numerical key parameters have to be inspected.
Diagnosis of frontal systems (WF shield, CF in CA) and comma over Ireland
For the frontal systems and the Comma over Ireland the following parameters are indicative: upper level height at 1000 and 500 hPa (left image top), as well as a combination of thickness, thermal front parameter (TFP) and temperature advection TA (right image top and left image bottom).
There is a well-developed west - east oriented zone of high thickness gradients and a maximum of the TFP at the southern edge of the CF in CA and the WF shield. Although there is warm advection (WA) accompanying the biggest part of the Warm Front cloud shield the relative WA maximum, which is a very prominent feature for Warm Fronts, is not very intensive neither from its configuration nor from its absolute values (right image top); the diagnosis as Warm Front is therefore mostly based on the satellite features. There is a distinct maximum of cold advection (CA) superimposed on the Cold Front cloud band with low tops (left image bottom). Also the Comma feature is under the influence of CA which fits to the classical ideas of this conceptual model.
The most important features in the height fields (left image top) can be seen in the upper level (500 hPa) with two small scale upper level troughs. The eastern one is at the rear side of the Comma which consequently can be regarded as an upper level feature caused by PVA indicating the movement of cyclonic vorticity (curvature vorticity in connection with the upper level trough). The western trough is at the rear side of the frontal cloud shield and will be discussed together with the Rapid Cyclogenesis below.
Summarizing, one can say that frontal characteristics do exist but that temperature advection is rather weak. Therefore there is more the situation of an air mass boundary than the situation of an active moving frontal system. The biggest deviations can be noticed for the conceptual model of the Warm Front Shield which is accompanied by a huge cloud shield but only by very weak WA. Small scale upper level troughs seem to be of interest for non-frontal features like the Comma and will be discussed below.
Diagnosis of Rapid Cyclogenesis
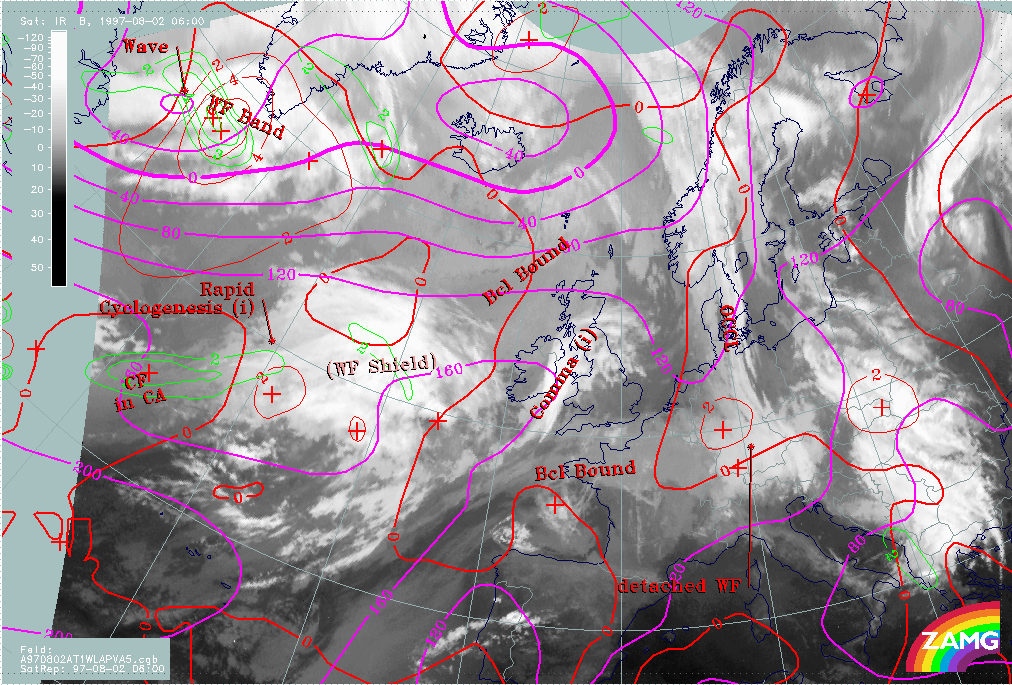
|
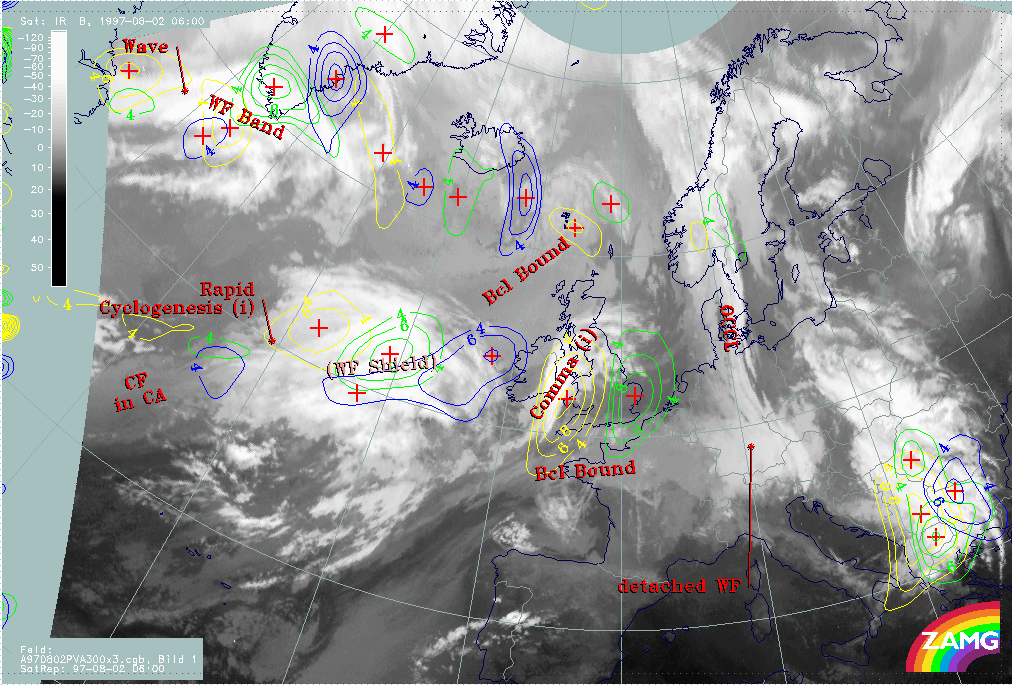
02 August 1997/06.00 UTC - Meteosat IR image; magenta: height contours 1000 hPa, green: positive vorticity advection (PVA) 500 hPa,
red: temparature advection - WA 1000 hPa; SatRep overlay: names of conceptual models
|
02 August 1997/06.00 UTC - Meteosat WV image; yellow: isotachs 300 hPa, black: shear vorticity 300 hPa; SatRep overlay: names of
conceptual models
|
|
|
As already mentioned, there are some distinct indications for Rapid Cyclogenesis in the cloud features. Key parameters and their combinations resulting from the numerical model have to support two different qualities of the conceptual model Rapid Cyclogenesis:
- A Wave development represented by a surface minimum (1000 hPa), a PVA maximum at 500 hPa and the juxtaposition of CA and WA (left image)
- A jet streak with a PVA maximum in the left exit region indicating sinking dry air on the cyclonic side of the jet axis as well as upward motion in the left exit region (right image).
The parameters indicative of Wave development (left image) are not incompatible with Rapid Cyclogenesis development; characteristic features of the parameters exist to the right position of the cloud features. But the surface low is rather weak compared to the ideal situation of this conceptual model. The jet parameters (right image) support a Rapid Cyclogenesis process, too, showing the existence of a jet streak parallel to the higher cloudiness and a PVA maximum in the left exit region. But there are also some deviations: compared with the WV image the jet axis (zeroline of shear vorticity at 300 hPa) is too far to the south, a fact which is even more pronounced in the area of the Warm Front Shield. A northward shift of this zeroline would also result in a northward shift of the PVA maximum in the direction of the higher cloud tops.
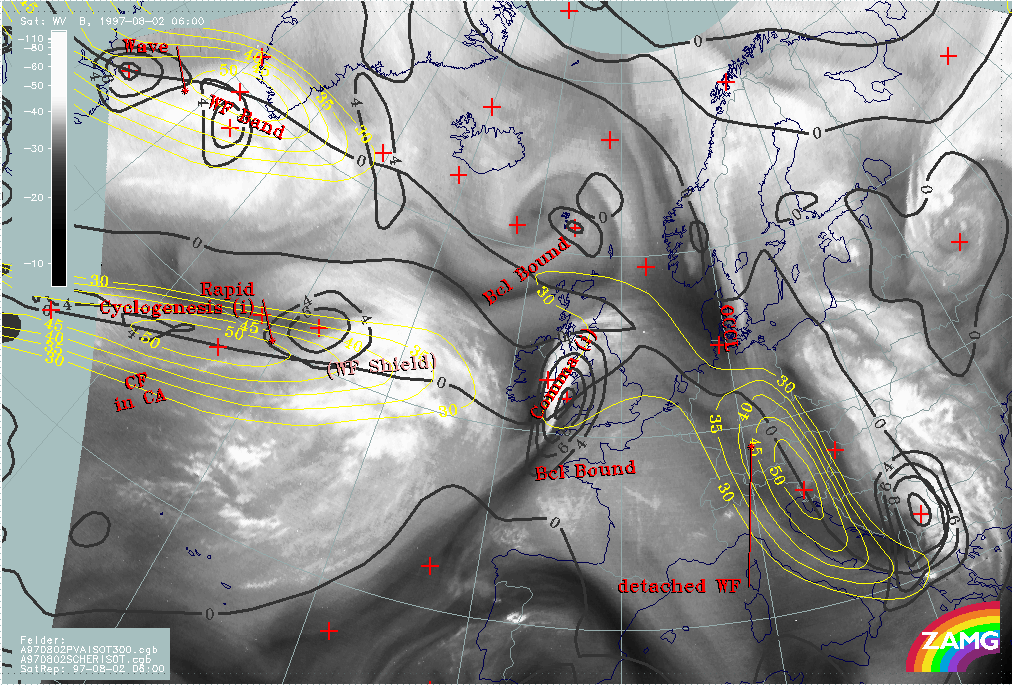
|
02 August 1997/06.00 UTC - Meteosat WV image; brown: curvature vorticity 300 hPa, blue: shear vorticity 300 hPa; SatRep overlay: names
of conceptual models
|
|
|
In the image above vorticity is split into its shear and curvature part. Shear vorticity (blue) is very dominant but there is also a curvature vorticity maximum (brown) more to the north-west. This is in accordance with the small scale upper level trough mentioned previously in the frontal diagnosis paragraph.
02 - 03 August 1997 - Relative Streams And Conveyor Belts For 02 August 06.00 UTC
For the conceptual model Rapid Cyclogenesis there are also typical parameters relating to isentropic surfaces. Typical relative streams can be observed:
- A rising and splitting relative stream from southern directions on low isentropic surfaces
- A dry intrusion on high isentropic surfaces.
|
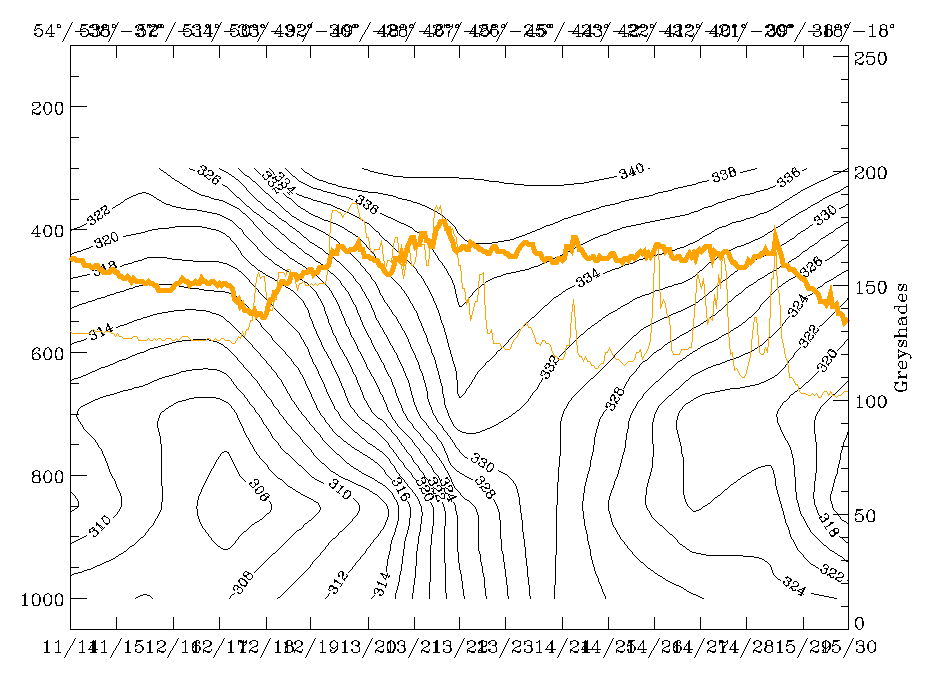
02 August 1997/06.00 UTC - Meteosat WV image; position of vertical cross section indicated; SatRep overlay: names of conceptual models
|
02 August 1997/06.00 UTC - Vertical cross section; black: isentropes (ThetaE), orange thin: IR pixel values, orange thick: WV pixel
values
|
|
|
The left image shows the vertical cross section line which is chosen perpendicular to the western part of the Rapid Cyclogenesis area. The vertical cross section itself (right image) contains a distinct downward inclined cold front zone with a surface front line close to 45N/25W. The high satellite pixel values of the front can be found on the rear side of the surface front. The WV minimum at 50N/32W represents the Black Stripe of dry air involved in the Rapid Cyclogenesis process. The isentropic surface 330K is on the top of the frontal surface.
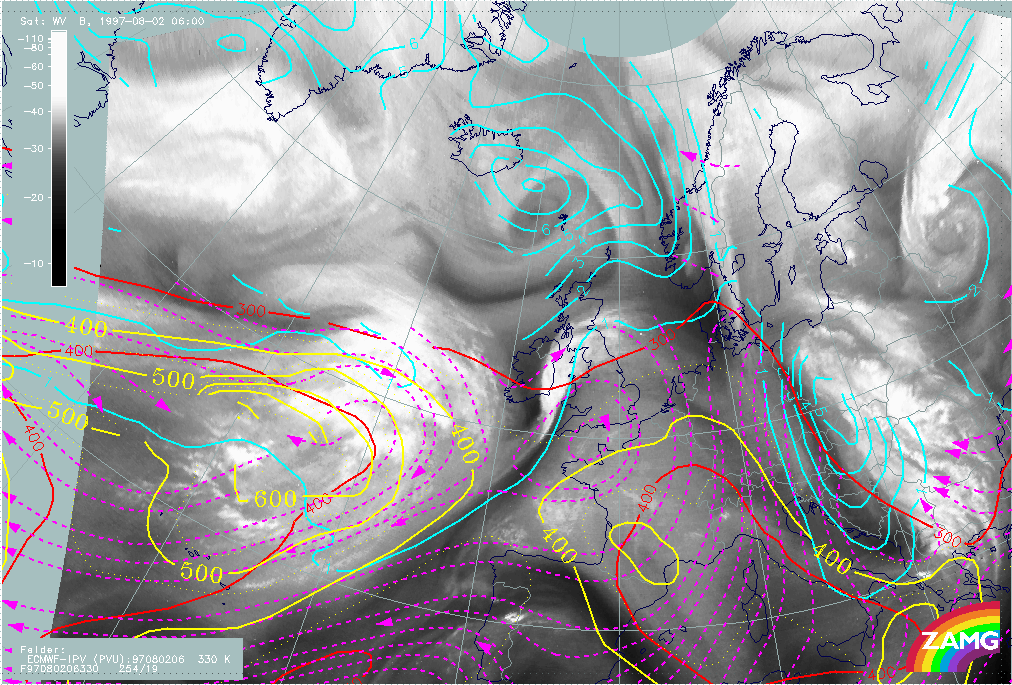
|
02 August 1997/06.00 UTC - Meteosat WV image; cyan: potential vorticity 330K, red: isobars for potential vorticity, magenta:
relative streams 330K - system velocity 254° 19 m/s, yellow: isobars for relative streams
|
|
|
Relative streams on this surface clearly show a strongly rising Warm Conveyor Belt in the area of the Warm Front Shield. In the area of the Black Stripe the relative stream is from the rear side of the cloud system, which is in good accordance with the distribution in an ideal case. In this area the isentropic surface is higher than 400 hPa but relative streams do not transport stratospheric air there. Bearing in mind that the jet axis in the numerical model has to be shifted northward in order to correlate better with the WV features, such a movement would also lead to a better discrimination between the warm conveyor belt and the relative stream from behind compared to the cloud features.
Summarizing these facts, the physical background necessary for a Rapid Cyclogenesis is supported by isobaric and isentropic parameters, but some of the main parameters are weaker than described in the classical case of such a conceptual model. This is especially true for the surface minimum which is weak and extended over a large area, and also for the WA maximum.
02 - 03 August 1997 - Introduction For Upper Level Low And Rapid Cyclogenesis
In the chapter of the diagnosis of conceptual models for 02 August at 06.00 UTC (compare Overview of satellite imagery for 02 August 06.00 UTC) the conceptual model Rapid Cyclogenesis was acceptable over the Atlantic west of Ireland (approximately 50N/30W). But there were some discrepancies to the behaviour of key parameters in the ideal case. These differences referred especially to a weaker surface trough and WA maximum. This chapter deals with further development of the rapid cyclogenesis, as well as other conceptual models in this area, till 03 August at 18.00 UTC.
02 - 03 August 1997 - Very Short Range Forecast From 02 August 06.00 UTC - 18.00 UTC
|
02 August 1997/06.00 UTC - Meteosat IR image; yellow: thermal front parameter (TFP) 500/850 hPa 06.00 UTC, green: thermal front
parameter (TFP) 500/850 hPa 12.00 UTC, blue: thermal front parameter (TFP) 500/850 hPa 18.00 UTC; SatRep overlay: names of conceptual
models
|
02 August 1997/06.00 UTC - Meteosat IR image; yellow: temperature advection - WA 1000 hPa 06.00 UTC, green: temperature advection - WA
1000 hPa 12.00 UTC, blue: temperature advection - WA 1000 hPa 18.00 UTC; SatRep overlay: names of conceptual models
|
|
|
|
|
|
02 August 1997/06.00 UTC - Meteosat IR image; yellow: positive vorticity advection (PVA) 300 hPa 06.00 UTC, green: positive vorticity
advection (PVA) 300 hPa 12.00 UTC, blue: positive vorticity advection (PVA) 300 hPa 18.00 UTC; SatRep overlay: names of conceptual
models
|
|
The images show the displacement of the key parameters TFP (left image top), WA (right image top), PVA at 300 hPa (left image bottom), surface (left image below) and finally upper level minimum (right image below). The TFP remains nearly stationary as a whole, which supports the idea of an air mass boundary, but shows rather strong eastward displacement of TFP waves within the west - east oriented zone. Strong eastward propagation can also be seen in the fields of the WA maximum and the PVA maximum which is already very close to Ireland at 18.00 UTC. Both parameters maintain their intensity which could imply that no intensification or decay takes place during the VSRF period. The same is true for the surface minimum which is very indistinct at all times. In contrast to this the upper level height minimum intensifies distinctly during its eastward propagation.
|
02 August 1997/06.00 UTC - Meteosat IR image; yellow: height contours 1000 hPa 06.00 UTC, green: height contours 1000 hPa 12.00 UTC,
blue: height contours 1000 hPa 18.00 UTC; SatRep overlay: names of conceptual models
|
02 August 1997/06.00 UTC - Meteosat IR image; yellow: height contours 500 hPa 06.00 UTC, green: height contours 500 hPa 12.00 UTC,
blue: height contours 500 hPa 18.00 UTC; SatRep overlay: names of conceptual models
|
|
|
In particular, the latter two parameters contradict the classical development of a Rapid Cyclogenesis, which in the ideal case shows a dramatic intensification of the surface but a less distinct one for the upper level minimum. This means that although even at 18.00 UTC the existence of Rapid Cyclogenesis cannot be denied, a different conceptual model is developing in the area of the Rapid Cyclogenesis and thereby surpassing its development. It is the development of an Upper Level Low.
02 - 03 August 1997 - Development Of Cloud Configurations During Very Short Range Forecast
|
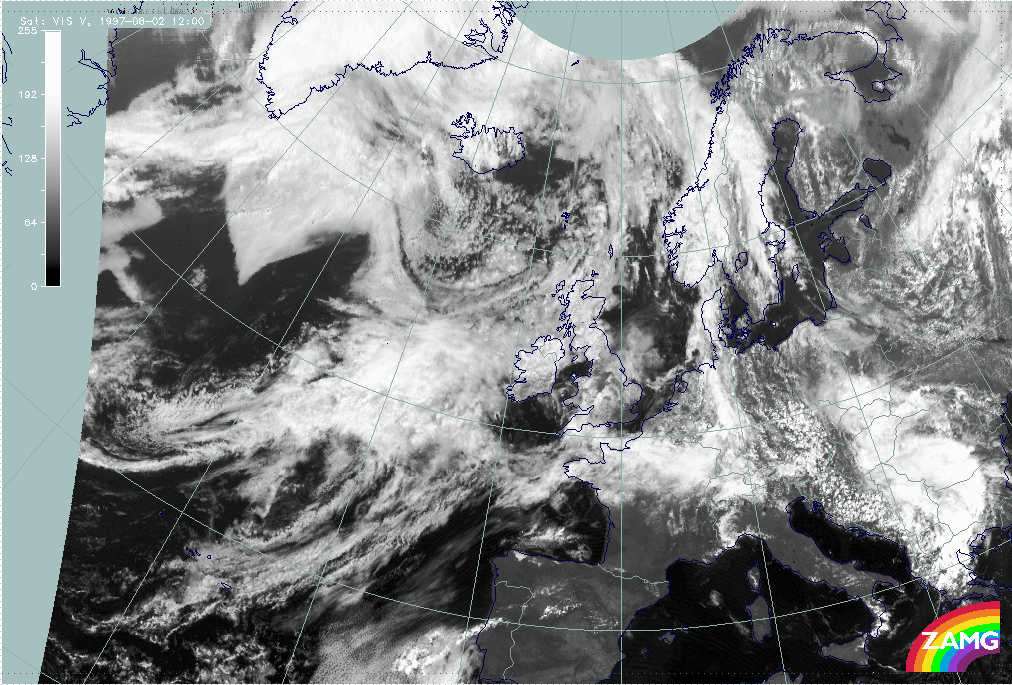
02 August 1997/12.00 UTC - Meteosat VIS image
|
|
|
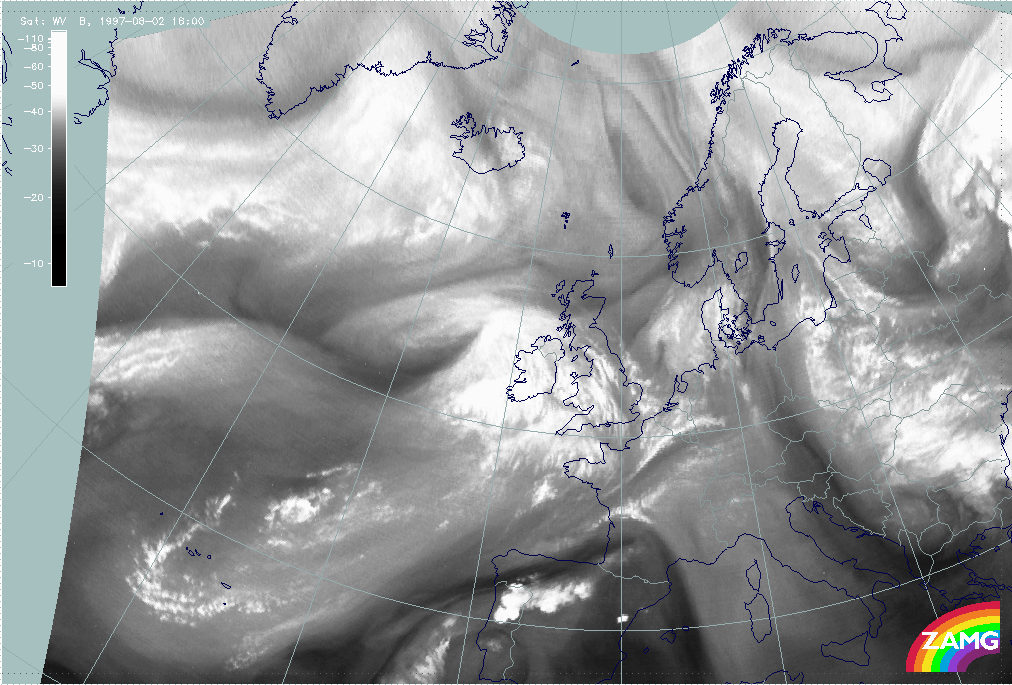
The image above is the visible image for 12.00 UTC. Apart from the eastward movement, no important change can be noticed in the cloud structures: there is still a pronounced Warm Front cloud shield and a distinct south-west - north-east oriented line separating the two cloud layers at different heights.
|
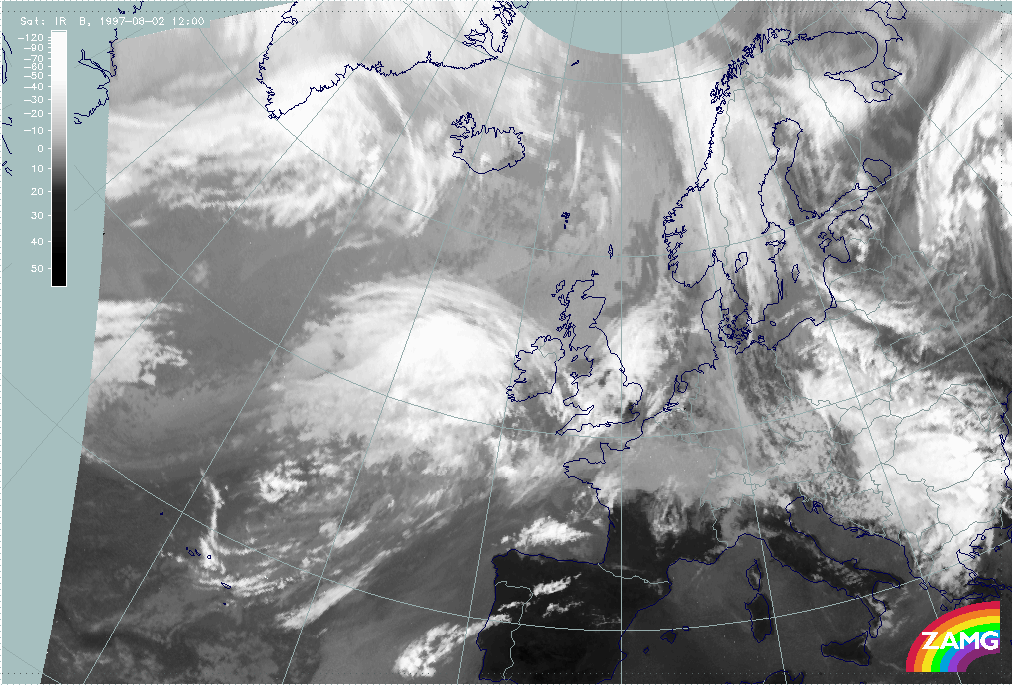
02 August 1997/12.00 UTC - Meteosat IR image
|
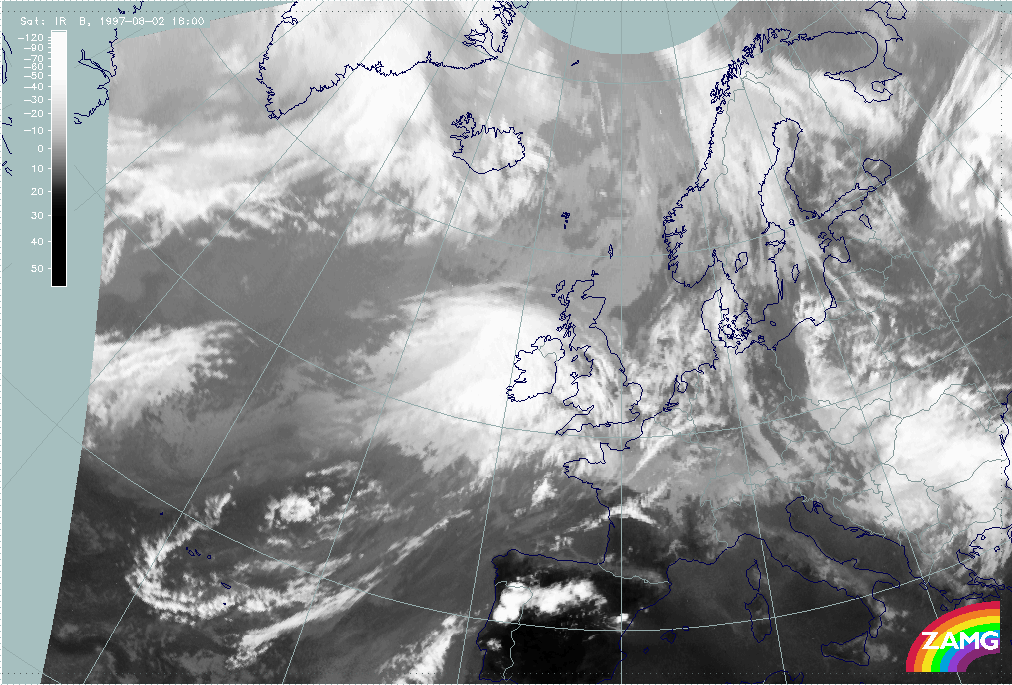
02 August 1997/18.00 UTC - Meteosat IR image
|
|
|
The images above are the relevant IR images, which support these results even more: the Warm Front cloud shield is well-pronounced, moves eastward and reaches Ireland at 18.00 UTC; there is no notable change in the two cloud layers at different heights.
Both the VIS and IR channels reveal a configuration which has some similarities with Rapid Cyclogenesis in an initial stage but does not show any development during this time. On the other hand also do not show the cloud features typical of an Upper Level Low development as it is recognized in the numerical model fields.
|
02 August 1997/12.00 UTC - Meteosat WV image
|
02 August 1997/18.00 UTC - Meteosat WV image
|
|
|
As the configurations for upper level lows are very distinct in the WV images, the 12.00 UTC image (left) and 18.00 UTC image (right) should give some hints; and indeed there is a broadening and increasing cyclonic curvature of the Black Stripe on the rear side of the intensive Warm Front Shield. But this Black Stripe and the cyclonic structure has no effect on the cloud structure in the VIS and IR images.
The typical cloud and WV features of an Upper Level Low are respectively two cloud and WV bands cyclonically curved against each other, leaving a dry area in the centre. In this case the superposition of two different CMs does not allow the development of those distinct features, but the WV band on the north-west side of the broadening Black Stripe, and the black area itself, can be regarded as typical Upper Level Low WV features.
|
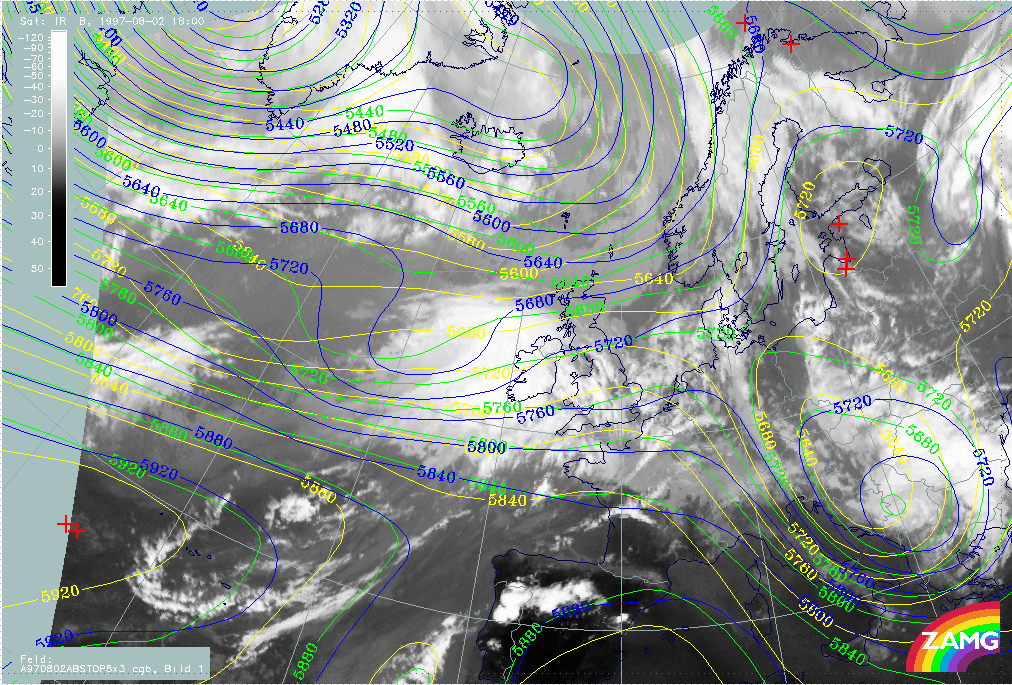
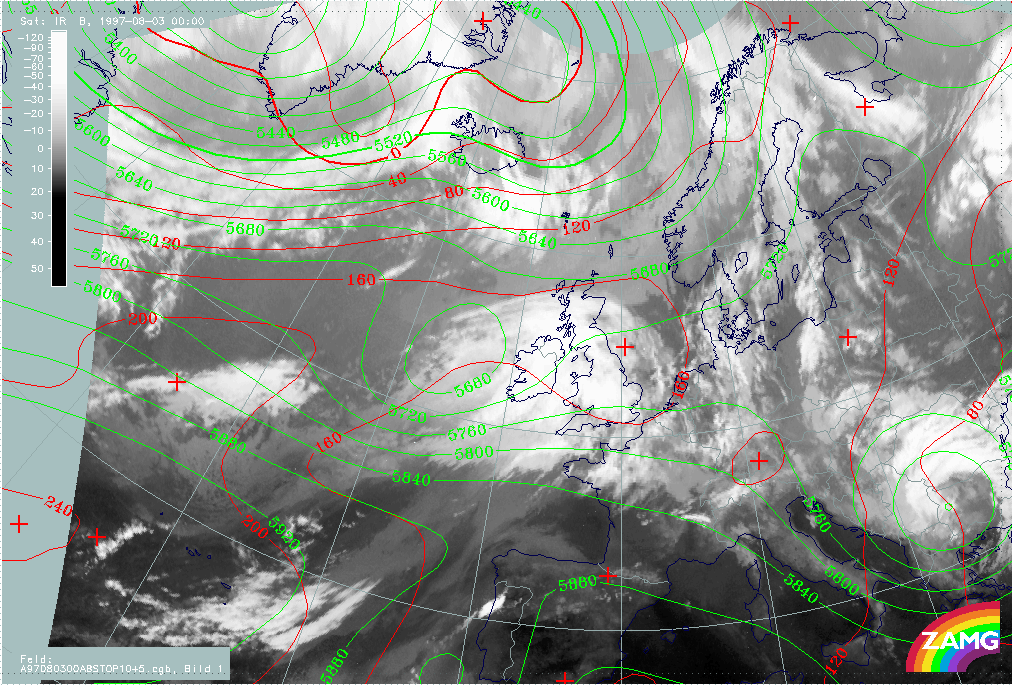
02 August 1997/18.00 UTC - Meteosat IR image; yellow: height contours 500 hPa 06.00 UTC, green: height contours 500 hPa 12.00 UTC,
blue: height contours 500 hPa 18.00 UTC
|
|
|
The image shows a perfect correlation between the upper level trough, which is nearly cut off, and the low cloud tops with a dry WV slot above (compare right image above) as well as a WV band on the rear side.
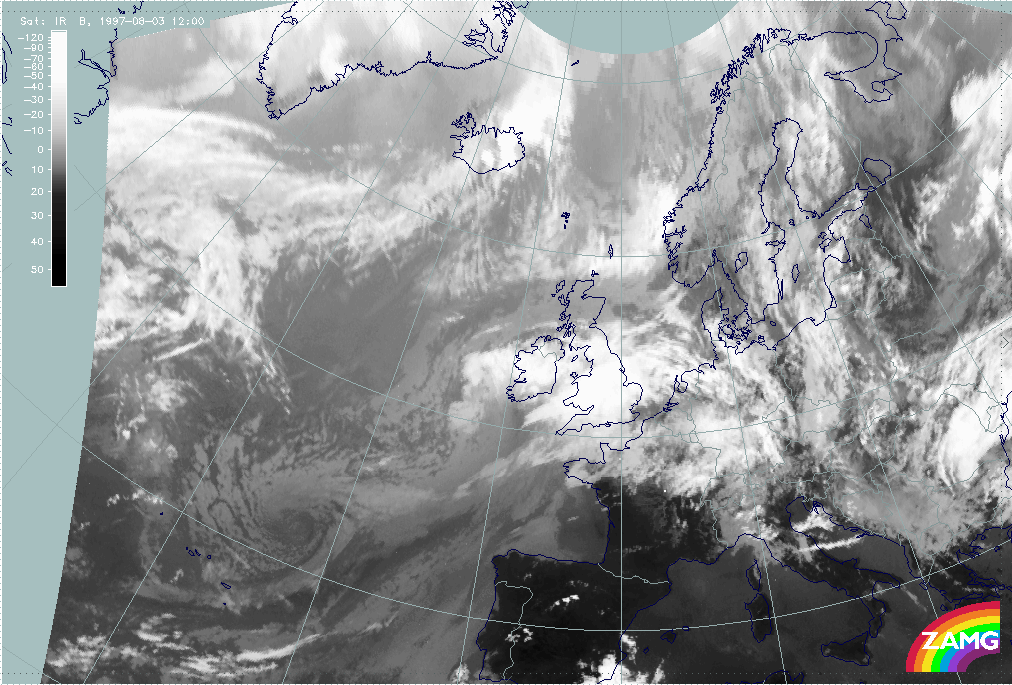
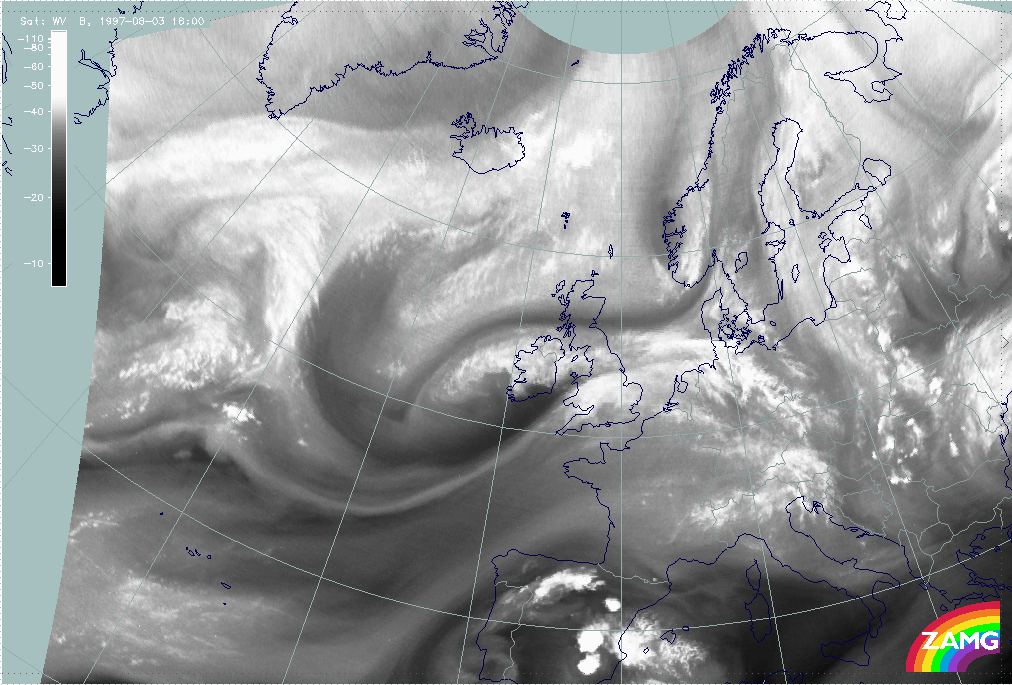
02 - 03 August 1997 - Overview Of Satellite Imagery For 03 August 00.00 UTC
|
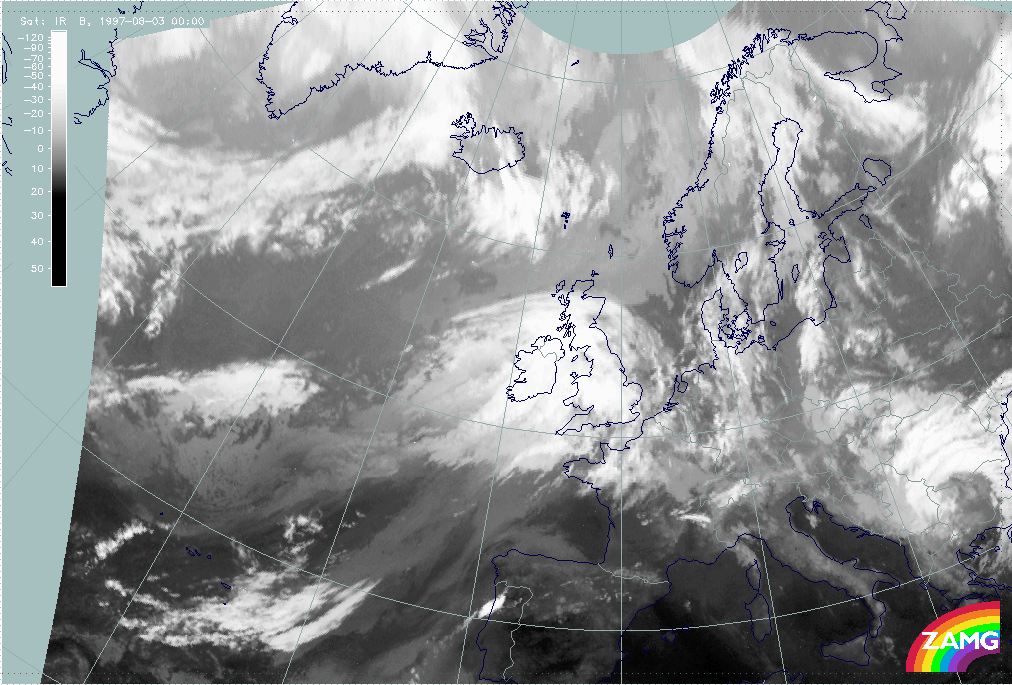
03 August 1997/00.00 UTC - Meteosat IR image
|
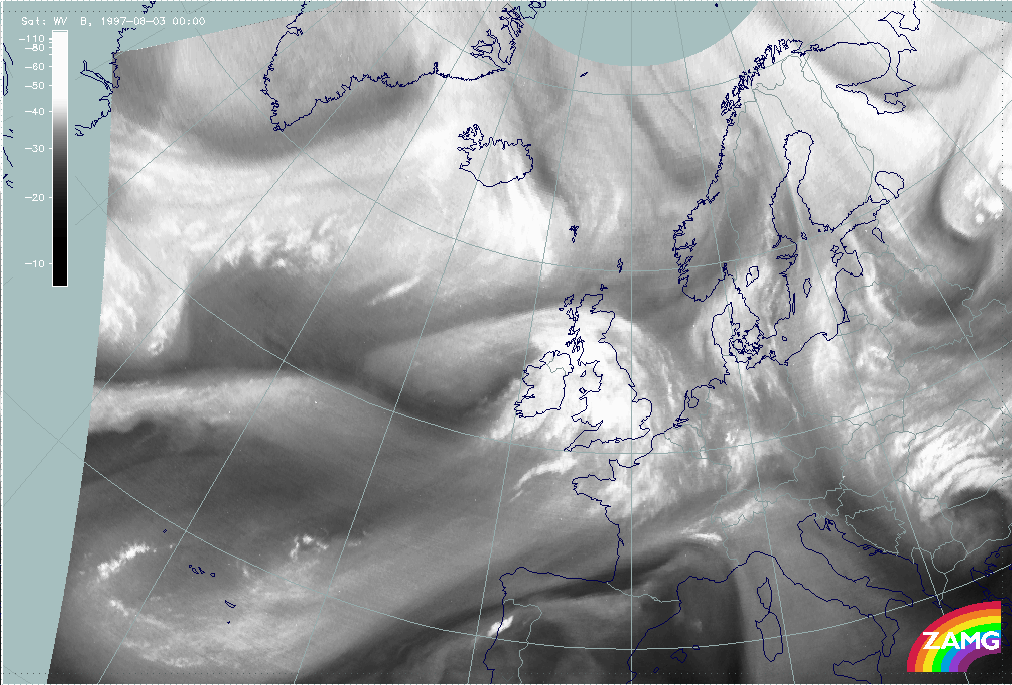
03 August 1997/00.00 UTC - Meteosat WV image
|
|

|
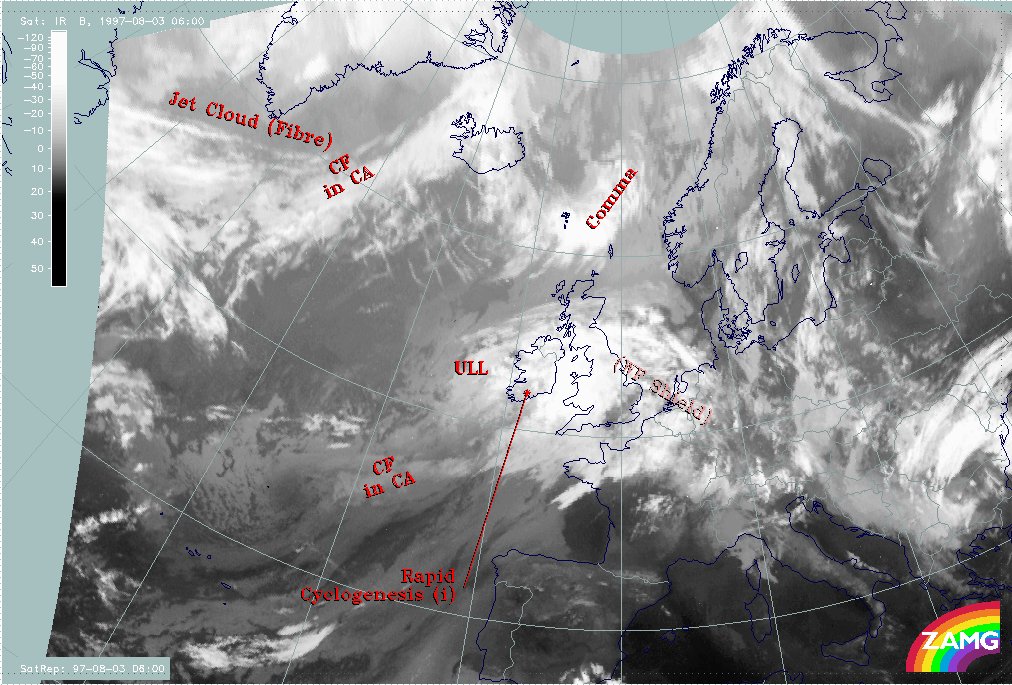
The cloud configurations six hours later can be seen in the IR (left image) and WV images (right image). Generally speaking there is still no dramatic change in the cloud features. The Warm Front Shield has moved eastward over the British Isles, the leading cloud edge of the Upper Level Low is located over Ireland and the dry Upper Level Low centre just west of Ireland.
02 - 03 August 1997 - Key Parameters On Isobaric Surfaces For 03 August 00.00 UTC
|
03 August 1997/00.00 UTC - Meteosat IR image; blue: thermal front parameter (TFP) 500/850 hPa, green: equivalent thickness 500/850 hPa,
red: temparature advection - WA 1000 hPa
|
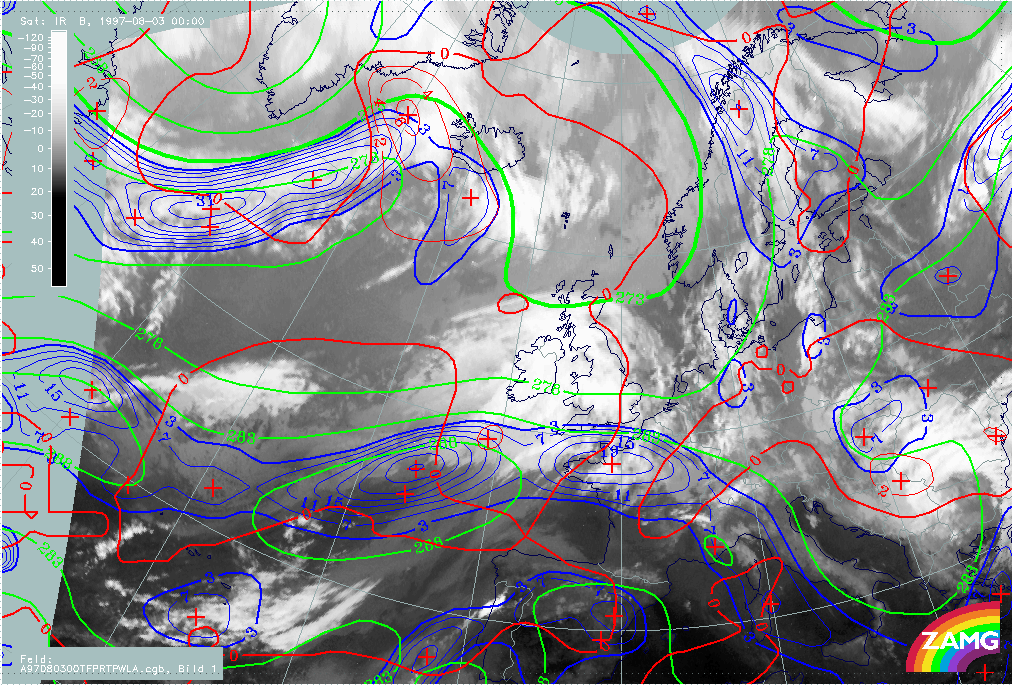
03 August 1997/00.00 UTC - Meteosat IR image; red: height contours 1000 hPa, green: height contours 500 hPa
|
|
|
|
|
|
03 August 1997/00.00 UTC - Meteosat WV image
|
|
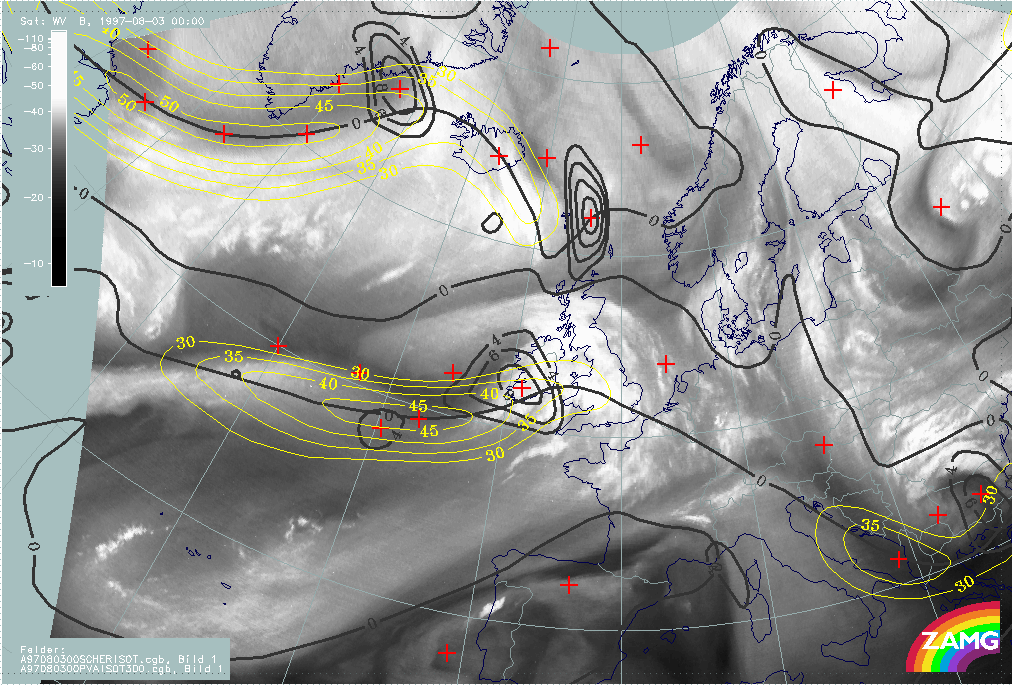
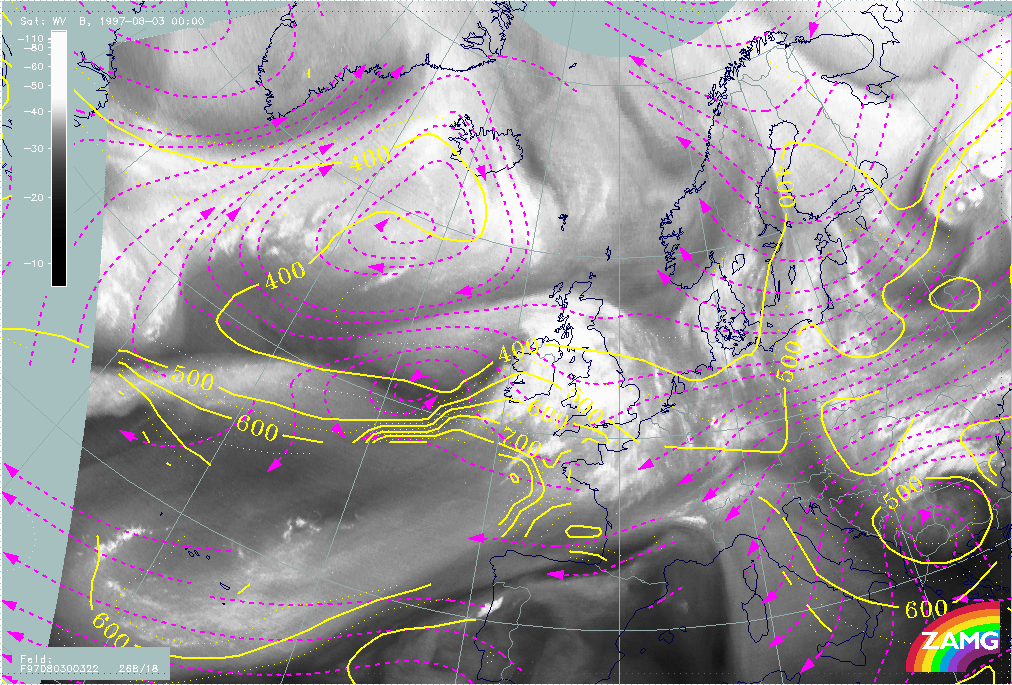
Numerical model fields relevant for the frontal situation (left image top) as well as for the Upper Level Low situation (right image top) complete the conceptual model diagnosis. The frontal situation (left image top) is unchanged since the beginning of this case study: a west - east oriented thickness gradient very similar to an air mass boundary and a well-developed TFP accompany the southern edge of the cloud bands. WA is still very weak and is in some contradiction to the well-developed cloud shield.
In contrary to this, distinct developments have taken place in the upper level height field (right image): the tie-off stage of a cut-off process has now been reached. The closed Upper Level Low circulation is in good agreement with the WV features (left image bottom). The surface (1000 hPa) height field does not show any distinct features of a low there.
|
03 August 1997/00.00 UTC - Meteosat IR image; magenta: height contours 1000 hPa, green: positive vorticity advection (PVA) 500 hPa,
red: temparature advection - WA 1000 hPa
|
03 August 1997/00.00 UTC - Meteosat IR image; yellow: isotachs 300 hPa, black: shear vorticity 300 hPa
|
|
|
Both images above contain the numerical model parameters relevant for Rapid Cyclogenesis. As before, the Wave situation (left image) is demonstrated by the surface height, the WA and the PVA at 500 hPa; the jet situation (right image) is demonstrated by the isotachs, zeroline of shear vorticity and PVA at 300 hPa. The physical background has remained the same since the beginning of the case study. A weak Wave but a distinct jet situation can be noticed. As before there is a discrepancy between the model jet axis and the WV features.
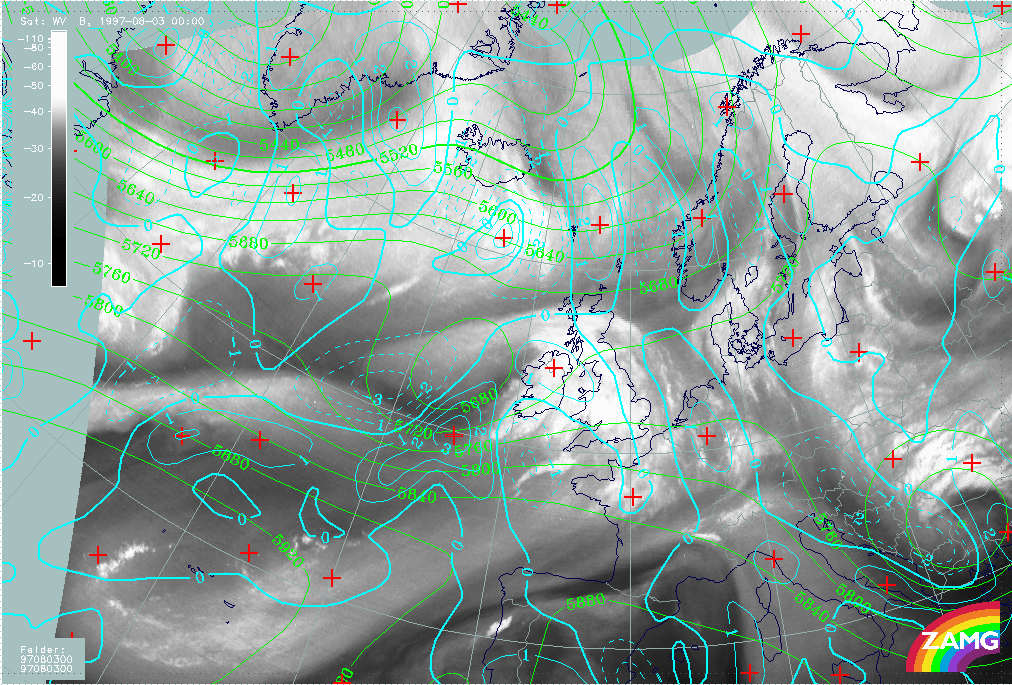
|
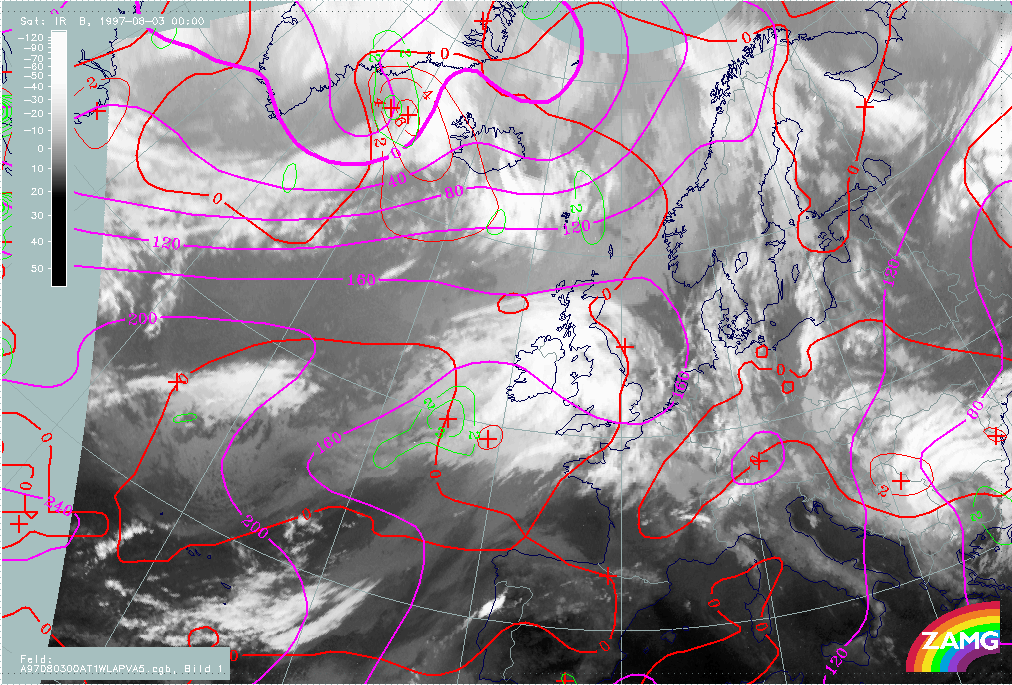
03 August 1997/00.00 UTC - Meteosat WV image; cyan: positive vorticity advection (PVA) 500 hPa, green: height contours 500 hPa
|
|
|
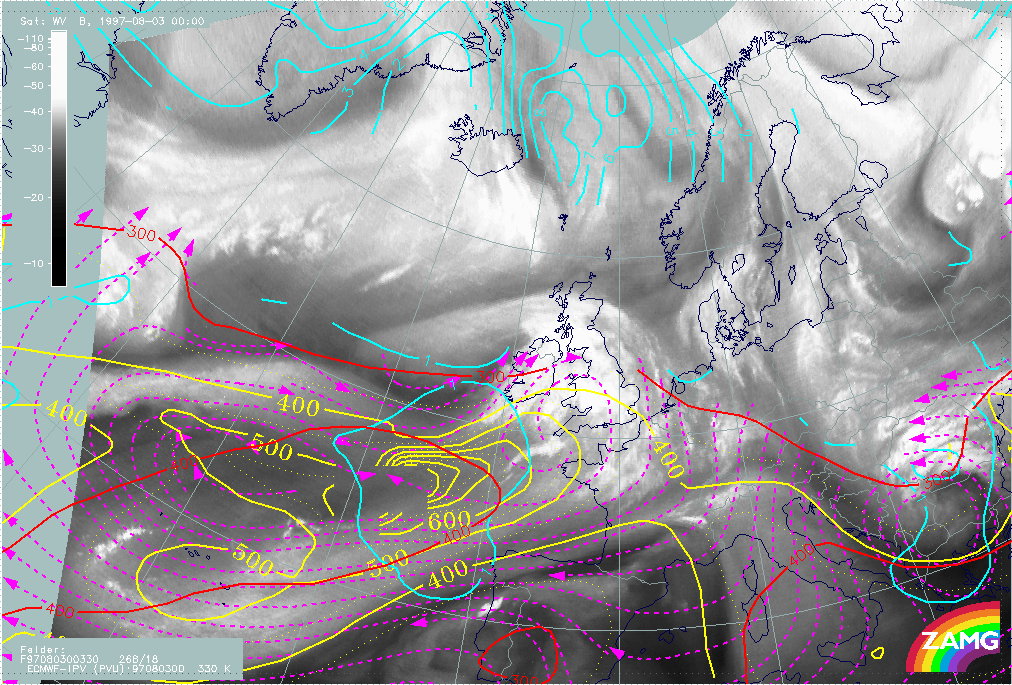
A fact which seems to become clearer at this point of time is that the upper level features dominate the cloud structures more and more. There is a pronounced PVA maximum at 300 hPa in the left exit region over Ireland, accompanied by an intensified cloud area. The image above shows the PVA fields at 500 hPa: the dominant maximum at this height is more to the south-west of both Ireland and the PVA maximum at 300 hPa. A comparison with the Upper Level Low height field clearly indicates that the PVA maximum at 500 hPa is connected to the curvature vorticity of the Upper Level Low and indicates the propagation of this low.
02 - 03 August 1997 - Relative Streams And Conveyor Belts For 03 August 00.00 UTC
|
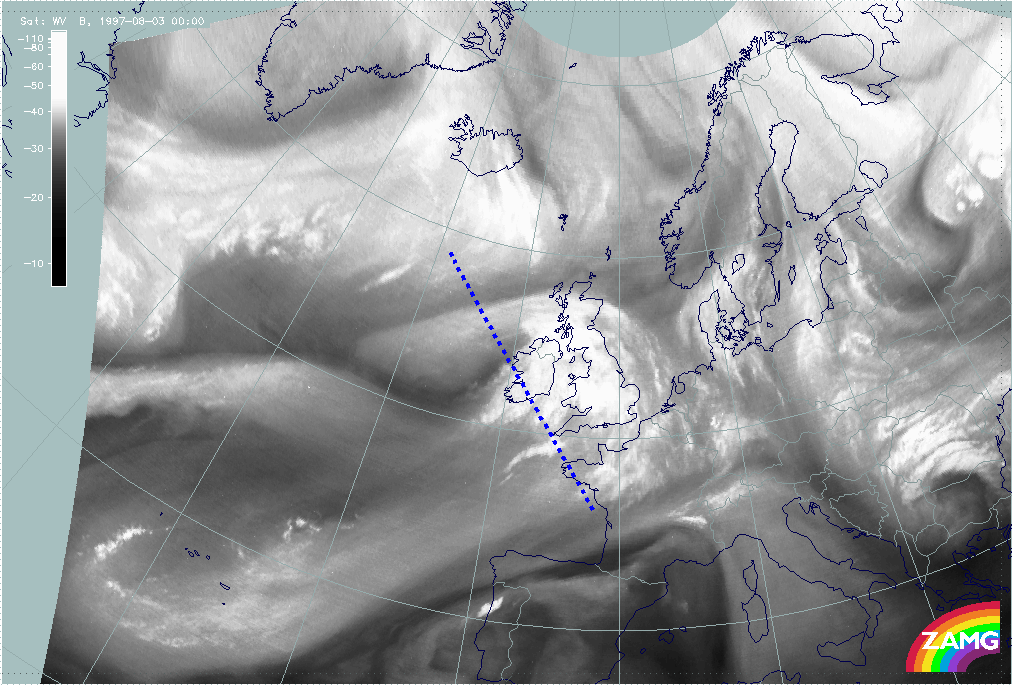
03 August 1997/00.00 UTC - Meteosat WV image; position of vertical cross section indicated
|
|
|
In the image above a vertical cross section line is chosen which crosses the WV band at the rear side of the upper level low, the dry slot, the cloudiness over Ireland intensified by the PVA maximum in the left exit region of the jet streak and the southernmost part of the Warm Front Shield.
|
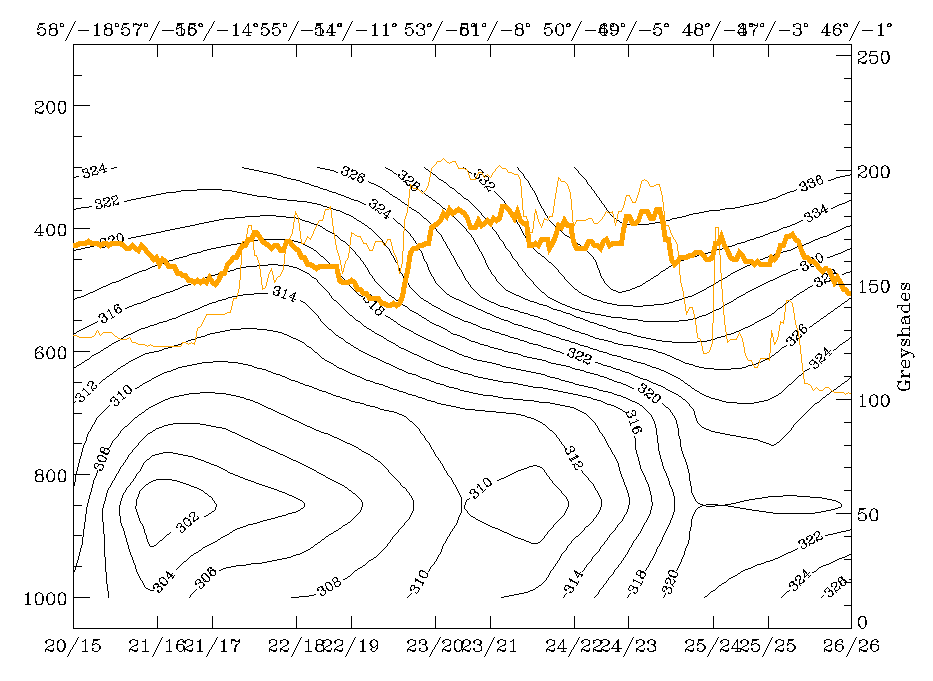
03 August 1997/00.00 UTC - Vertical cross section; black: isentropes (ThetaE), orange thin: IR pixel values, orange thick: WV pixel
values
|
|
|
Isentropes and IR + WV pixel values show a typical upper level low situation around 55N/14W where a peak in the WV signal identifies the rear side of the Upper Level Low. The WV minimum around 53N/10W corresponds to the Dark Stripe, while the broad maximum to the south represents the Warm Front Shield. Isentropes show a Baroclinic Boundary of the Upper Level Low; isentropes of 322K and 330K represent surfaces respectively within and above this Baroclinic Boundary.
|
03 August 1997/00.00 UTC - Meteosat IR image; magenta: relative streams 322K - system velocity 268° 18 m/s, yellow: isobars
|
03 August 1997/00.00 UTC - Meteosat IR image; cyan: potential vorticity 330K, red: isobars for potential vorticity, magenta: relative
streams 330K - system velocity 268° 18 m/s, yellow: isobars for relative streams
|
|
|
Relative streams on these surfaces show a lot of typical features for both the Upper Level Low and Rapid Cyclogenesis. At the lower surface of 322K (left image) a rising stream over the British Isles from south-east to north-west is a typical phenomenon on low surfaces for Rapid Cyclogenesis; however, the pronounced cyclonic circulation in the area of the Dark Stripe corresponds to the Upper Level Low. At the higher surface of 330K (right image) a typical frontal situation can be noticed over west Ireland with a strongly rising Warm Conveyor Belt accompanying the Warm Front Shield and the dry intrusion from north-west in the area of the Dark Stripe. This is again a situation which typically appears with Rapid Cyclogenesis.
02 - 03 August 1997 - Summary
Summarizing, one can say that two different upper level phenomena exist in this region:
- The jet streak with a PVA maximum in the left exit region - a phenomenon which is not only connected with the intensified cloudiness and weather over Ireland but possesses also the potential for further Rapid Cyclogenesis development;
- A small scale cut off low (Upper Level Low) immediately at the rear which is recognised by wet and dry upper level features and shows a somewhat different propagation direction indicated by a PVA maximum at 500 hPa.
While the development of a Rapid Cyclogenesis has stagnated, during the last 18 hours the development of an Upper Level Low was quite intensive. But the physical situation, especially on isentropic surfaces, cannot exclude the possibility of a Rapid Cyclogenesis development in the next time period.
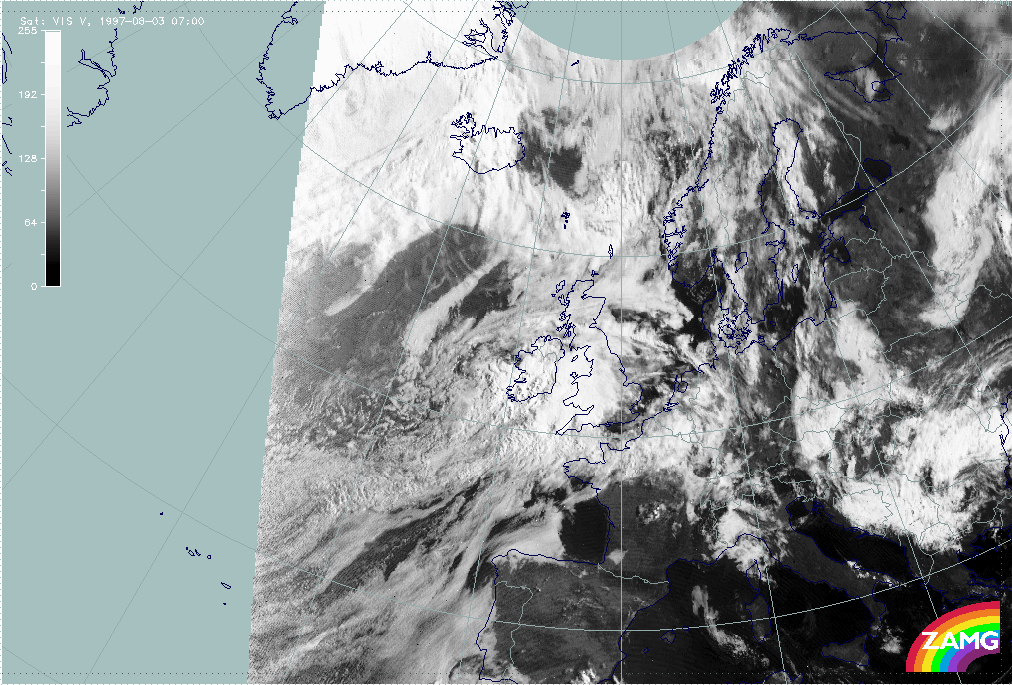
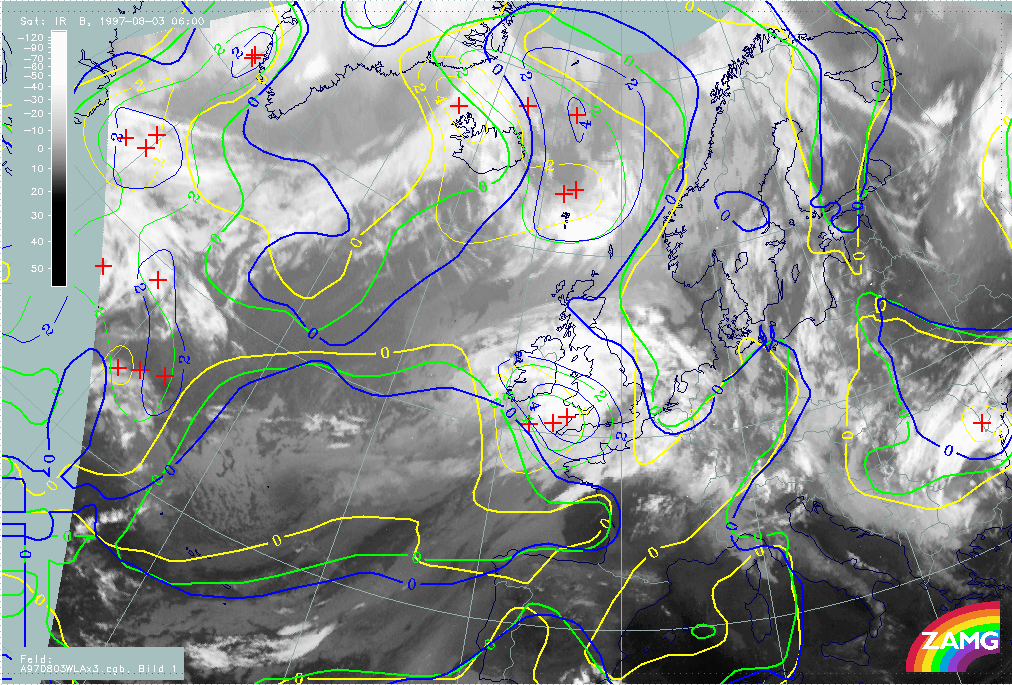
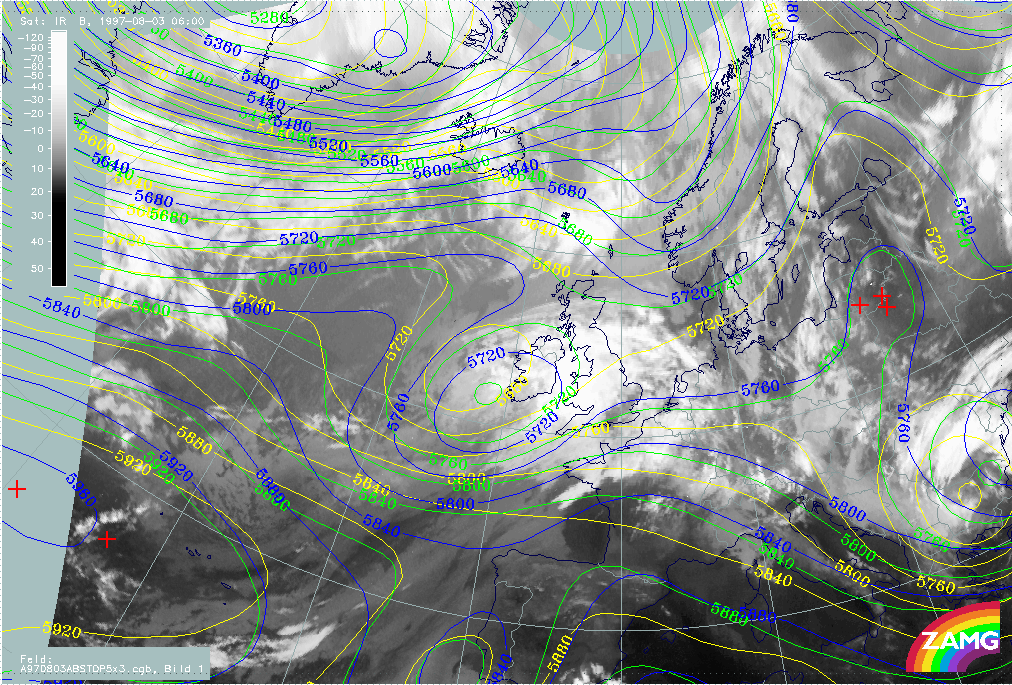
02 - 03 August 1997 - Overview Of Satellite Imagery For 03 August 06.00 UTC
|
03 August 1997/06.00 UTC - Meteosat IR image; SatRep overlay: names of conceptual models
|
03 August 1997/06.00 UTC - Meteosat WV image
|
|
|
|

|
|
03 August 1997/06.00 UTC - Meteosat VIS image
|
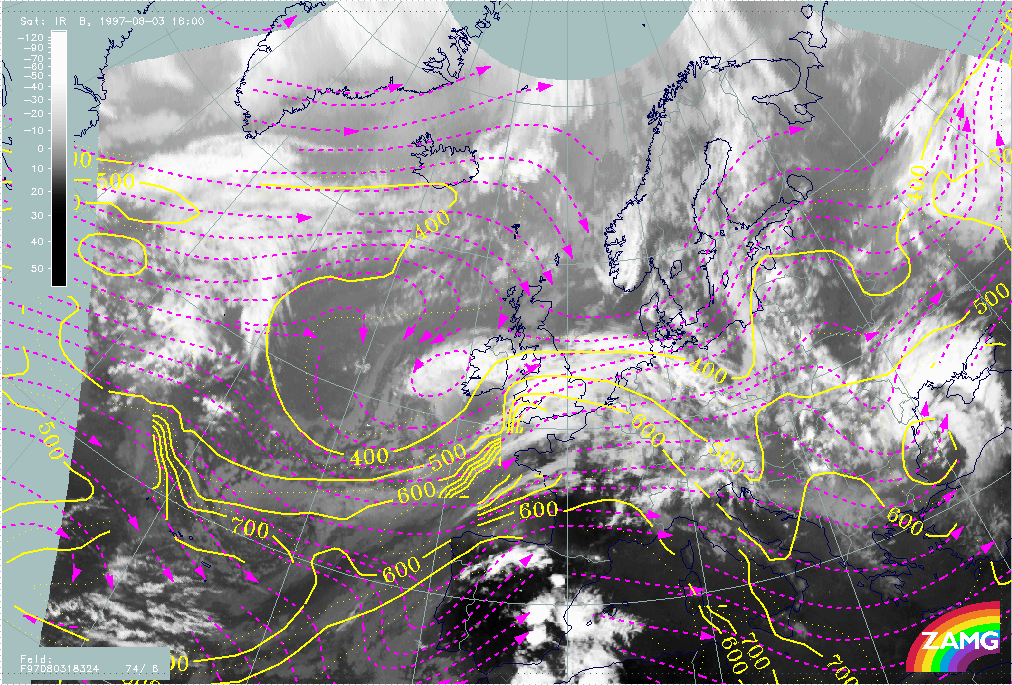
03 August 1997/06.00 UTC - Meteosat IR image; red: height contours 1000 hPa, green: height contours 500 hPa
|
The images show the cloud configurations in the three Meteosat channels. Although the Upper Level Low (ULL) is now indicated in the SatRep (superimposed on the IR image), clear indications of an Upper Level Low cannot be extracted from the IR image alone (left image top). Only WV and VIS structures together with the numerical model key parameters (right image bottom) contribute to this diagnosis. In the VIS image (left image bottom) a circulation centre with two cyclonically curved cloud bands can be identified around 53N/25W; this is the region where also a circulation centre can be noticed within the WV band (right image top).
The intensive dry Black Stripe in the WV is now clearly to the south of the Upper Level Low spiral structure just mentioned; it moved to south Ireland and is connected with the intensified cloud area east of Ireland and a newly developed cellular cloud area over Ireland. This is a new aspect during this case study which could be recognised only now: the encouplement of the spiral feature of the Upper Level Low and the Dark Stripe at the rear of the frontal cloud bands might be an additional factor for an imminent Rapid Cyclogenesis.
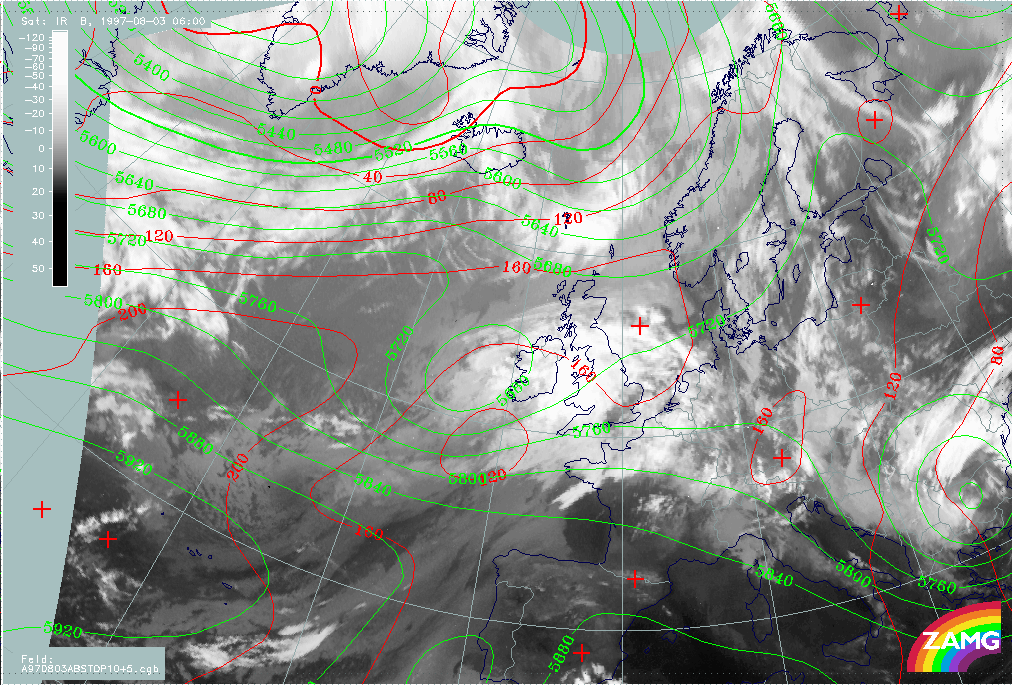
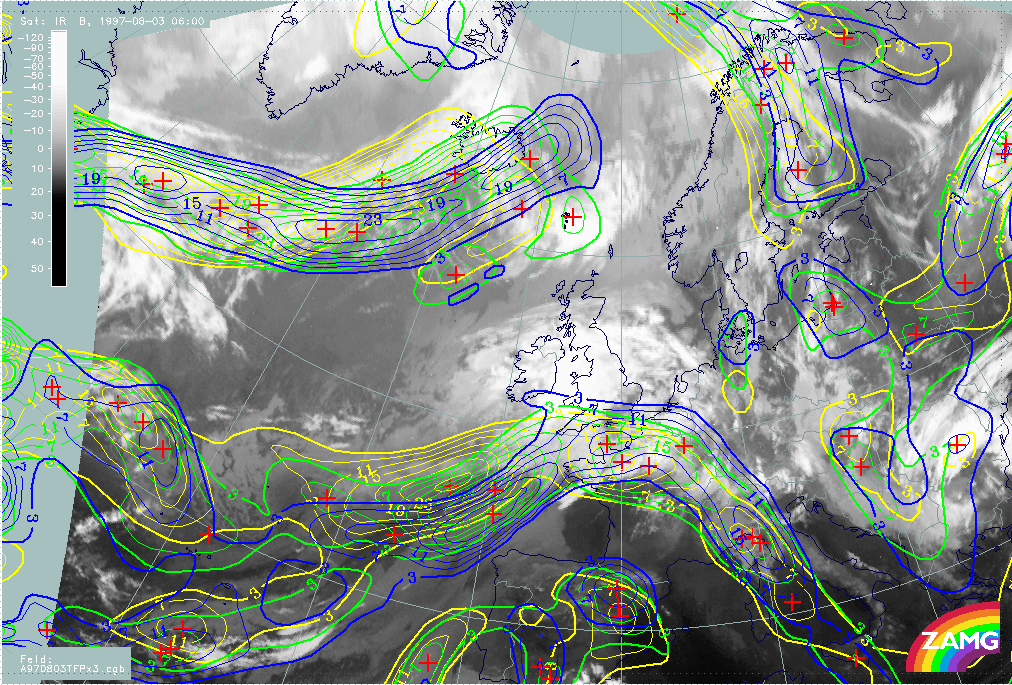
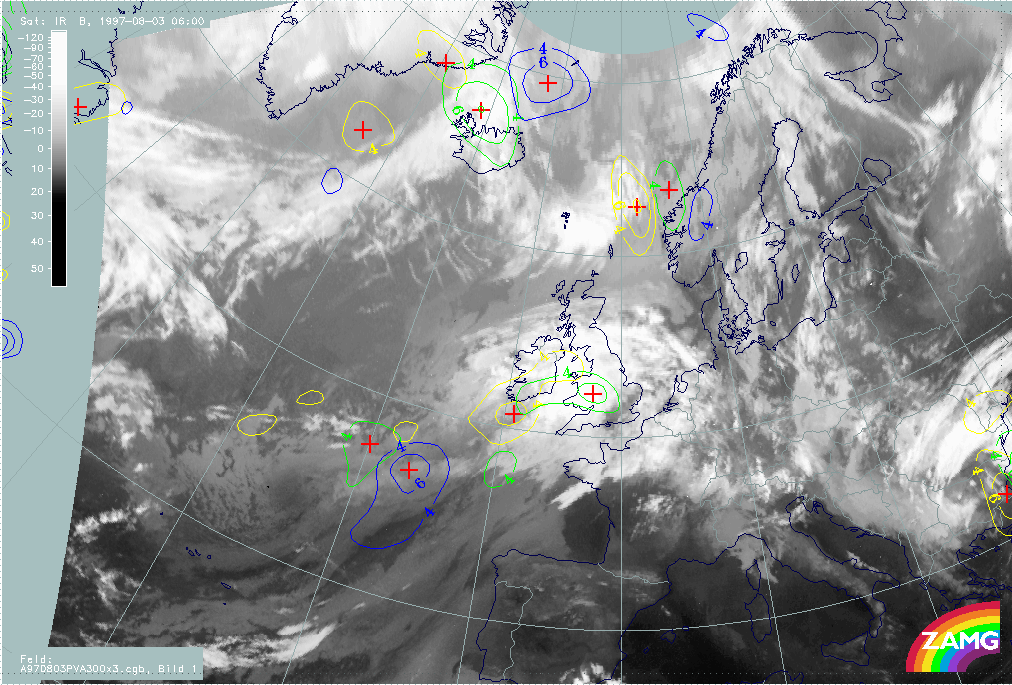
02 - 03 August 1997 - Key Parameters On Isobaric Surfaces For 03 August 06.00 UTC
|
03 August 1997/06.00 UTC - Meteosat IR image; red: height contours 1000 hPa, green: height contours 500 hPa
|
|
|
The site of the Upper Level Low has already been discussed together with the typical cloud features (image above - compare Overview of satellite imagery for 03 August 06.00 UTC).
|
03 August 1997/06.00 UTC - Meteosat IR image; magenta: height contours 1000 hPa, green: positive vorticity advection (PVA) 500 hPa,
red: temparature advection - WA 1000 hPa
|
03 August 1997/00.00 UTC - Meteosat WV image; black: positive vorticity advection (PVA) 300 hPa, yellow: isotachs 300 hPa, black: shear
vorticity 300 hPa
|
|
|
The images above present the key parameters for a Rapid Cyclogenesis. Generally speaking all necessary conditions are fulfilled as before, but there are also two new aspects:
- The surface low and the WA maximum are more distinct now;
- All parameters fit better together than before.
So there is a strong indication of Rapid Cyclogenesis developing in the next time period. To check this possibility, the parameters for the next 12 hours, i.e. for the VSRF, are inspected.
02 - 03 August 1997 - Introduction For Very Short Range Forecast
|
02 August 1997/06.00 UTC - Meteosat IR image; yellow: thermal front parameter (TFP) 500/850 hPa 06.00 UTC, green: thermal front
parameter (TFP) 500/850 hPa 12.00 UTC, blue: thermal front parameter (TFP) 500/850 hPa 18.00 UTC
|
02 August 1997/06.00 UTC - Meteosat IR image; yellow: temperature advection - WA 1000 hPa 06.00 UTC, green: temperature advection - WA
1000 hPa 12.00 UTC, blue: temperature advection - WA 1000 hPa 18.00 UTC
|
|
|
|
|
|
02 August 1997/06.00 UTC - Meteosat IR image; yellow: positive vorticity advection (PVA) 300 hPa 06.00 UTC, green: positive vorticity
advection (PVA) 300 hPa 12.00 UTC, blue: positive vorticity advection (PVA) 300 hPa 18.00 UTC
|
02 August 1997/06.00 UTC - Meteosat IR image; yellow: height contours 1000 hPa 06.00 UTC, green: height contours 1000 hPa 12.00 UTC,
blue: height contours 1000 hPa 18.00 UTC
|
The images show the displacement of the key parameters TFP (left image top), WA (right image top), PVA at 300 hPa (left image bottom), surface (right image bottom) and finally upper level height (image below).
|
03 August 1997/06.00 UTC - Meteosat IR image; yellow: height contours 500 hPa 06.00 UTC, green: height contours 500 hPa 12.00 UTC,
blue: height contours 500 hPa 18.00 UTC
|
|
|
Some of the key parameters clearly support the development of Rapid Cyclogenesis, such as the TFP which for the first time during this case study develops an Occlusion - like configuration extending from Cornwall to south-east Ireland for 18.00 UTC. Also the WA maximum intensifies markedly by 18 UTC over Cornwall and Ireland. On the other hand the surface low retains its strength without any intensification during its eastward movement, as does the PVA maximum. As can be seen, the upper level low moves slowly south-south-eastwards, while its vertical axis becomes more perpendicular.
Summarizing, from the diagnosis of the 06.00 UTC situation and the VSRF of all relevant key parameters, many clues can be found for the occurence of Rapid Cyclogenesis. This will be verified by the sequence of images.
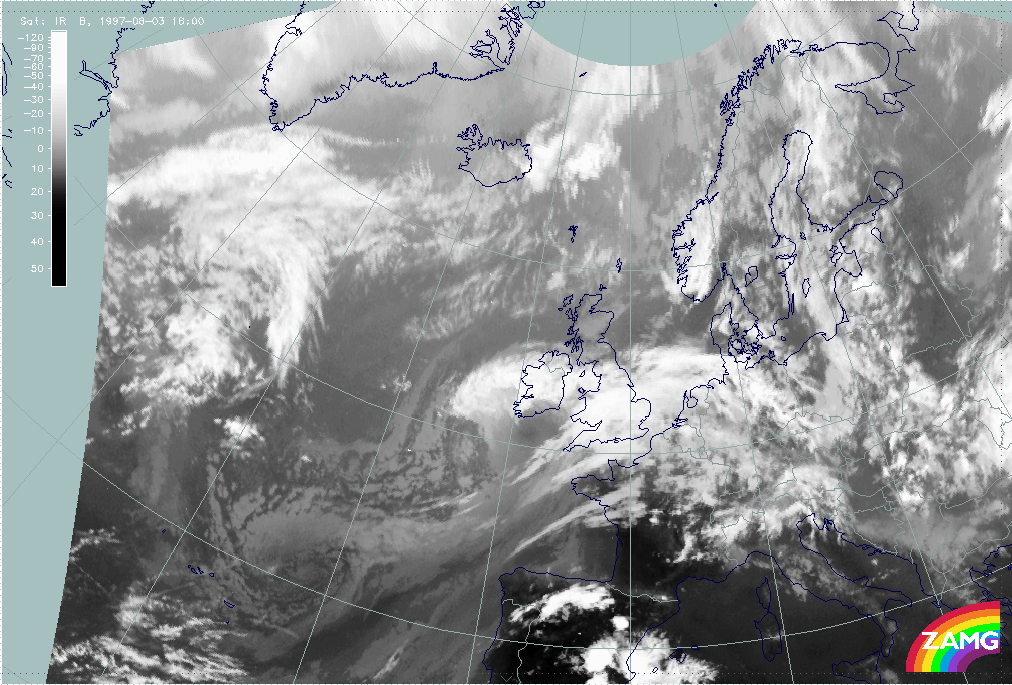
02 - 03 August 1997 - Development Of Cloud Configurations During Very Short Range Forecast For 03 August 06.00 UTC - 18.00 UTC
|
02 August 1997/12.00 UTC - Meteosat IR image
|
02 August 1997/18.00 UTC - Meteosat IR image
|
|
|
|
|
|
02 August 1997/12.00 UTC - Meteosat WV image
|
02 August 1997/18.00 UTC - Meteosat WV image
|
As can be seen from the IR (left and right image top) and WV images (left and right image bottom) a very intensive Rapid Cyclogenesis develops between 12.00 and 18.00 UTC. The most pronounced features are the intensive broadening of the WV Dark Stripe and the lowering of the cloud tops there; this happens in an area immediately to the south of Ireland. On the other hand there is a dramatic intensification of the cloudiness mostly in cellular convective form over and north-west of Ireland.
The latter fact will be emphasised with the help of relevant key parameters on isentropic surfaces (compare Diagnosis for 03 August 18.00 UTC with parameters on isentropic surfaces).
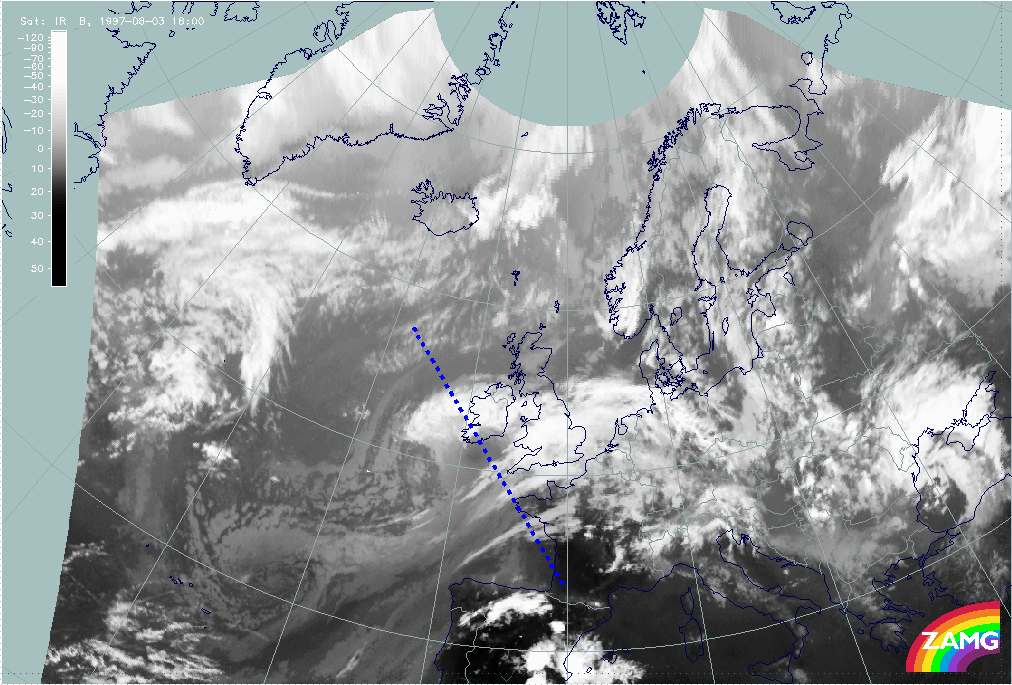
02 - 03 August 1997 - Diagnosis For 03 August 18.00 Utc With Parameters On Isentropic Surfaces
|
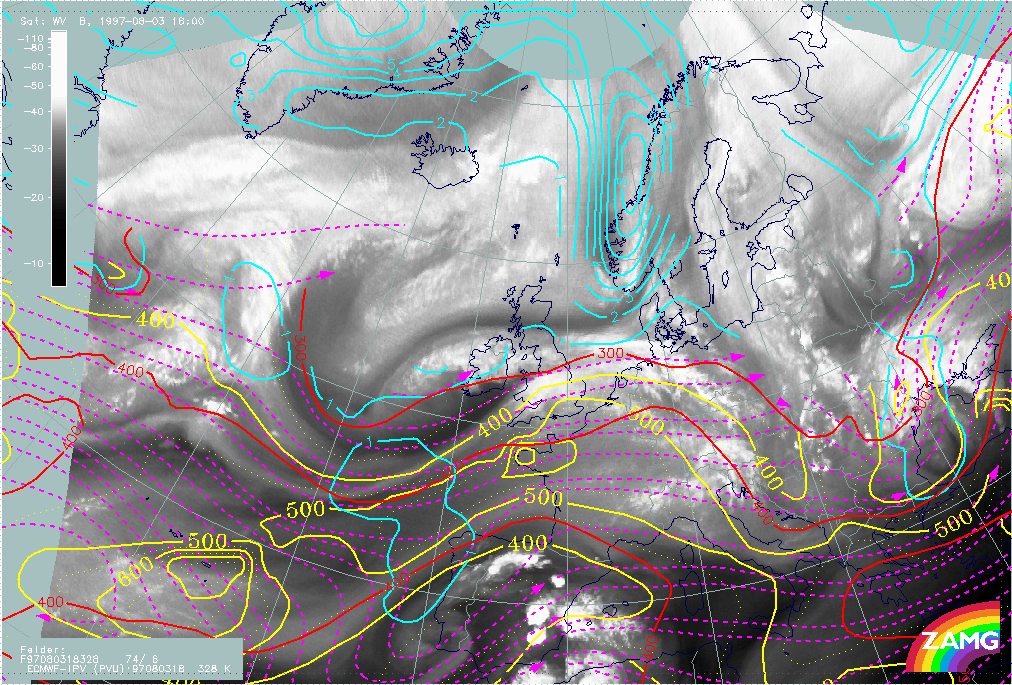
03 August 1997/18.00 UTC - Meteosat IR image; position of vertical cross section indicated
|
|
|
In this chapter the intensification of cloudiness, especially convective cloudiness over and north-west of Ireland at 18.00 UTC, is related to relative streams. The vertical cross section line crosses this area of cloudiness as well as the area of cloud dissolution south of Ireland.
|
03 August 1997/18.00 UTC - Vertical cross section; black: isentropes (ThetaE), orange thin: IR pixel values, orange thick: WV pixel
values
|
|
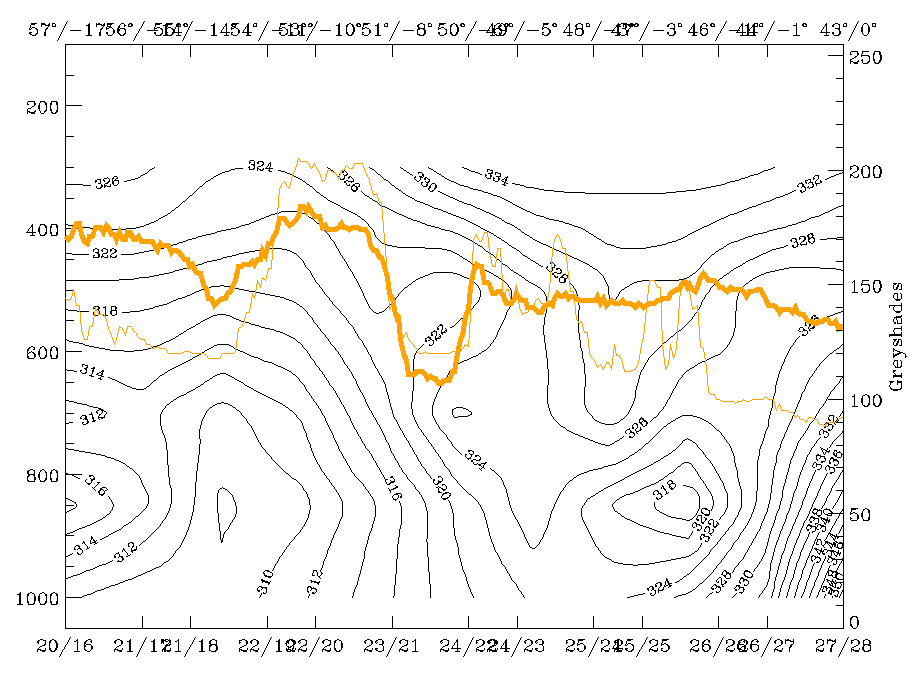
|
The vertical cross section shows a cold frontal zone inclined downward from approximately 400 hPa at 54N/11W down to the surface at approximately 50N/07W. The high pixel values are on top of this frontal zone while the minimum around 50N/05W corresponds to the dry WV Black Stripe.
Isentropic surfaces 320K, 324K and 328K have been selected, representing respectively one surface within the frontal zone and two surfaces above.
Relative streams on these surfaces show many of the typical features of Rapid Cyclogenesis development and indicate clearly the area most probable for cloud development.
|
03 August 1997/18.00 UTC - Meteosat IR image; magenta: relative streams 320K - system velocity 74° 8 m/s, yellow: isobars
|
03 August 1997/18.00 UTC - Meteosat IR image; magenta: relative streams 324K - system velocity 74° 8 m/s, yellow: isobars
|
|
|
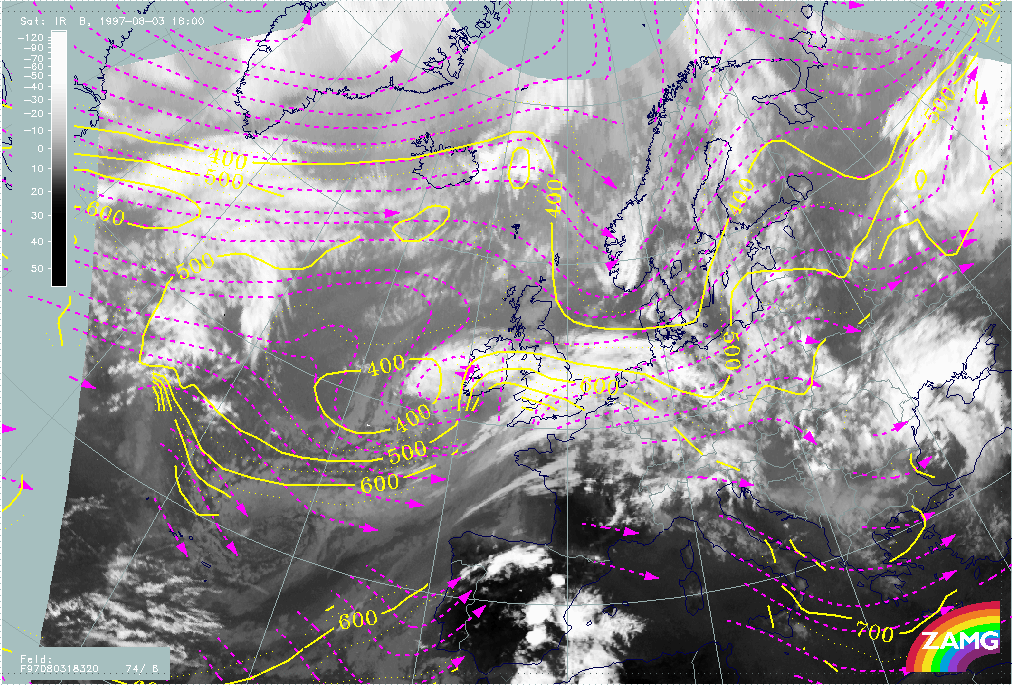
On the lowest isentropic surface of 320 K (left image) the typically rising and splitting stream can be identified exactly over Ireland. Rising is very pronounced there. On the 324K surface (right image), which is above the frontal surface, relative streams from the north-west represent the dry intrusion. This is also a typical distribution for rapid cyclogenesis situations; as it should be in the ideal case, this relative stream is sinking and thereby supporting the cloud dissolution area south of Ireland.
|
03 August 1997/18.00 UTC - Meteosat IR image; cyan: potential vorticity 328K, red: isobars for potential vorticity, magenta: relative
streams 320K - system velocity 74° 8 m/s, yellow: isobars for relative streams
|
|
|
On the still higher surface of 328K the same sinking relative stream from north-west can be noticed. As can be seen from the values of PV, dry but not stratospheric air is transported.