Authors
DWDWilfried Jacobs
ZAMG
Jarno Schipper
KNMI
Rob Groenland
Introduction
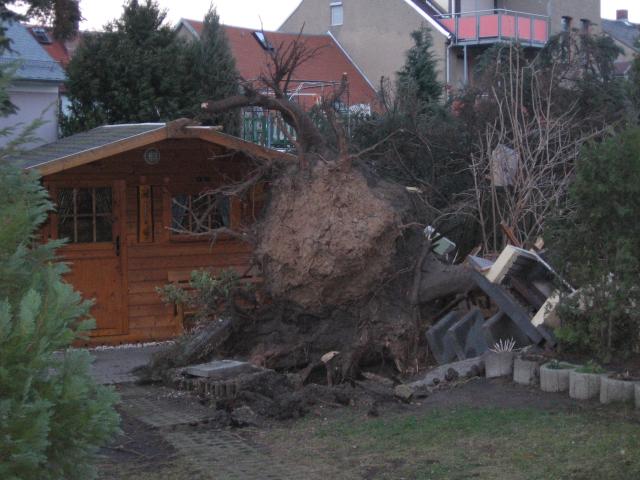
Many thunderstorms, graupel/hail were observed and severe (gusts were measured, e.g., Saarbrücken (Saarland, 65 kn), Chemnitz (Saxonia, 83 kn), Ansbach and Mühldorf (Bavaria, 72 kn and 75 kn, respectively). Also in Austria heavy gusts were registered, e.g., Salzburg and Vienna 77 kn. In the Netherlands (without Islands) gusts of up to 60 kn happened. Several tornados developed (2 F1-tornados and 28 (suspicion) over Germany, (more: www.tornadoliste.de, in German). In Austria, expecially in the so-called "Salzkammergut" severe damages happened that fits well to the F2-level (taken from Felix Welzenbach, www.wetteran.de/analysen/emma-und-fee.html, in German).
 |
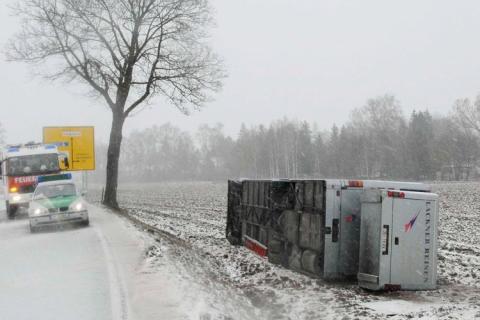 |
| Damages near Zwickau (taken from "Feuerwehr Meerane") | Gusts pushed a bus off the slippery road (Photo: DPA) |
 |
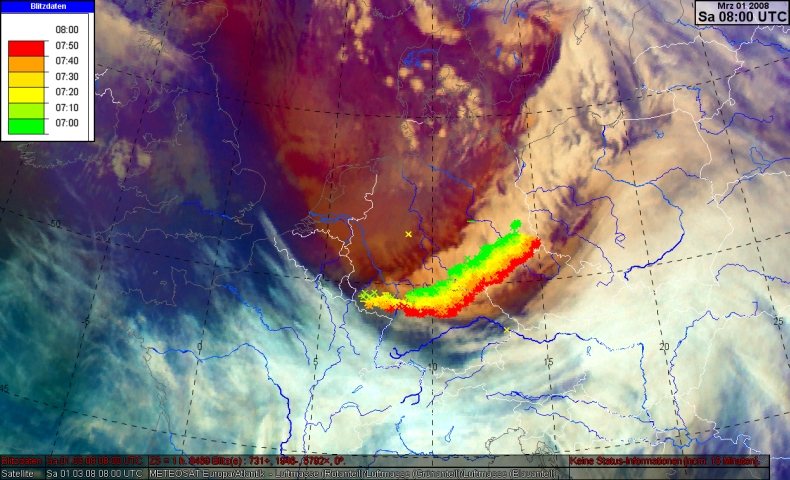 |
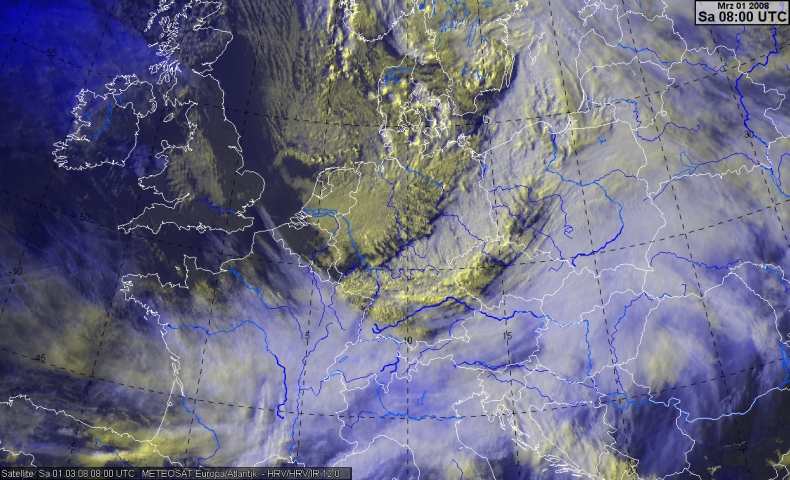
| Meteosat-8 RGB HRV/HRV/IR10.8 (01 March 2008, 08 UTC) | Meteosat RGB "Airmass" and lightning detection (last hour) (01 March 2008, 08 UTC) |
- Convection in cold air
- Convective line
- Zones of high probability to heavy gusts
Parameters used in this case study:
- Satellite imagery:
- IR10.8 Enhanced
- RGB Composites:
- Airmass RGB
- Convective Storms RGB
- High Resolution Visible RGB
- Basic Synoptic Parameters:
- Geopotential height 300 hPa
- Wind in 300 hPa
- Surface pressure and temperature in 850 hPa
- Surface pressure tendencies
- Maximum wind speeds during the last 3 hour
- Surface observations
- Lightning observations during the last hour
- Radar:
- DWD RX (national composite, highly resolved)
- 1h-precipitation (derived from radar)
- Derived parameters:
- CAPE in combination with vertical motion in 500 hPa
- Potential vorticity in 310 K
- Soundings (field distribution):
- Measurements from 1000 to 500 hPa
Preconditions likely for thunderstorms:
- Potential instability
- Upward motion
Cylogenesis and storm development:
The following conditions should be checked
- Strong frontal zone
- relatively warm and humid air involved
- Surface low superimposed by positive vorticity advection
- Wind speed and gusts
- Intensification of surface pressure gradient
- High vertical temperature gradient and strong winds in higher levels (e.g., 850 hPa)
We will discuss these phenomena with several basic meteorological parameters and derived model parameters in relation to Meteosat images. Radar data and lightning detection will be additionally used.
Following conceptual models are considered:
- Cyclogenesis (according to Hoskins-Theory)
- Convective line
- Derecho (definition by John and Hurts, 1987)