Table of Contents
- I. Introduction
- II. Physical Background enlightened with help of relative streams
- III. Physical Background enlightened with help of parameters on isobaric surfaces
- Absolute Topography at 500 hPa and 1000 hPa
- Temperature Advection
- Thermal Front Parameter and Equivalent Thickness
- Vertical Motion and Divergence
- Jet streak and Vorticity Advection
- Weather
Introduction
|
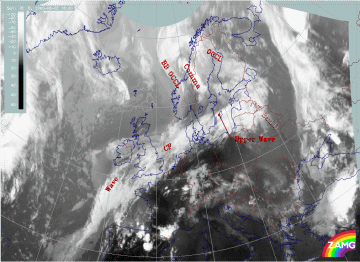
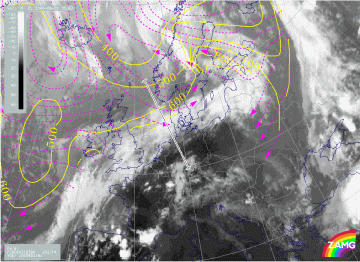
02 June 2000/18.00 UTC - Meteosat IR image; SatRep overlay: names of conceptual models
|
|
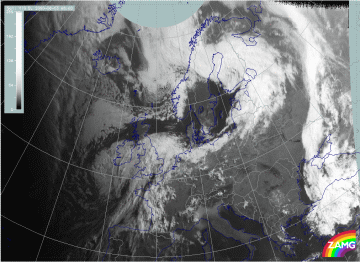
This case study is dominated by a pronounced cloud band stretching from the Atlantic west of Portugal across the British Isles and further
north-eastwards to Russia and finally backwards to the Norwegian coast.
In the IR image above the Satellite Report (Sat Rep) is superimposed. The SatRep indicates a Wave in a developed stage SW of the British Isles,
a CF over the North Sea and Denmark and an Upper Wave over the Baltic Sea. The Warm Front, which is marked as such over the Baltic States, is
not accompanied by extensive cloudiness and can only be analysed with the help of model parameter fields (not shown here). The occlusion cloud
band belonging to the system is situated over Finland and Central Scandinavia and a Back bent Occlusion has been identified at the northern end
of the system.
|
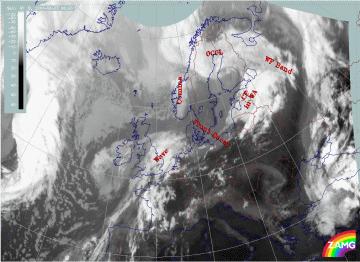
03 June 2000/06.00 UTC - Meteosat IR image; SatRep overlay: names of conceptual models
|
|
Twelve hours later (03/06.00 UTC) there is a distinct dissipation of the Cold Front over Northern Europe. This effect is the subject of this case study.
Diagnosis from satellite features
The area of dissipation of the frontal cloud band over Northern Europe can more easily be analysed with the help of loops of satellite imagery in IR, WV, and VIS:
|
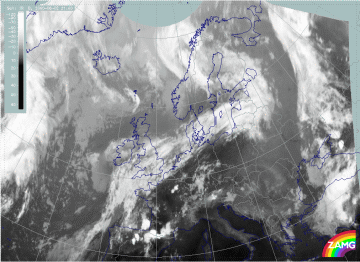
02 June 2000/21.00 UTC - Meteosat IR image; 02/21.00 - 03/07.00 UTC hourly image Loop
|
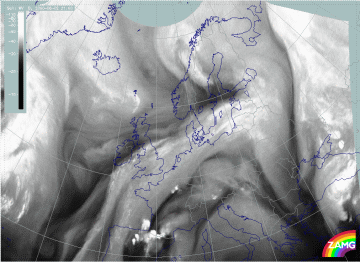
02 June 2000/21.00 UTC - Meteosat WV image; 02/21.00 - 03/07.00 UTC hourly image Loop
|
|
03 June 2000/06.00 UTC - Meteosat VIS image; 06.00 - 13.00 UTC hourly image Loop
|
|
Summary of typical and important features seen in the loops above:
- From 22.00 UTC, in the IR image a gap in the cloud starts extending over the North Sea to the rear of the Cold Front and within the frontal cloud band. In the WV image loop, the beginning of the decay can be observed from 22.00 UTC and over the following two hours.
- During the next 6 hours, the gap widens and the dissipation zone increases over the North Sea, except for a small band of low clouds remaining over Poland; this is seen in the loop of the VIS images at 05.00 UTC.
- In the WV imagery the growing dissipation zone over Northern Europe and the North Sea is indicated by a darker area within the WV cloud band.
- Also in the WV images, a thin Dark Stripe develops to the rear of the frontal zone, over the North Sea, at 22.00 UTC.
- The low clouds over Poland finally dissipate during the process, as observed in the VIS images between 06.00 UTC and 13.00 UTC
Such a process is very similar to the conceptual model "Front Decay" for which the main characteristics are described below:
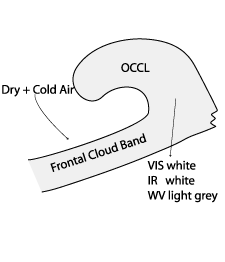
- During the initial stage of the process, there is a multi layered frontal cloud band within a developed system consisting of Cold Front, Warm Front, and Occlusion which appear white in IR and VIS and light grey in WV images
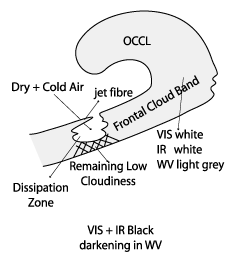
- The dissipation of high clouds starts at the rear of the frontal cloud band and a resulting gap in the cloud grows within the front, however, low clouds remain
- At the mature stage of the process, the remaining low clouds will often dissappear
|
|
|
The process of Front Decay can be further studied by making use of several relevant physical key parameters, which will be subject of the following chapter.
Physical Background enlightened with help of relative streams
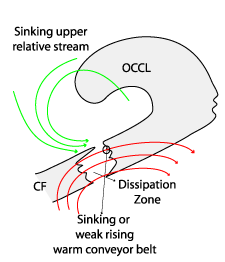
The physics of a Front Decay is well described using relative streams (see Conceptual Models: Front Decay - Meteorological physical background ). One of the three typical configurations show the involvement of air rotating around the centre of the main low attached to the frontal system. A sinking upper relative stream from the rear (upper relative stream and/or dry intrusion) develops, which flows at nearly right angles to the frontal cloud band at low and middle levels, leading to the characteristic dissipation of cloudiness. At upper levels, a sinking or only very weakly rising Warm Conveyor Belt can be observed.
|
|
|
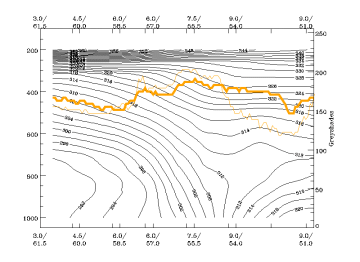
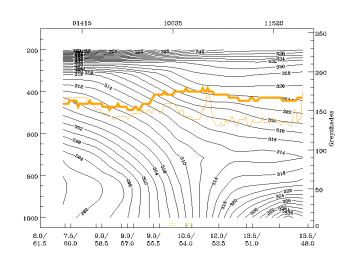
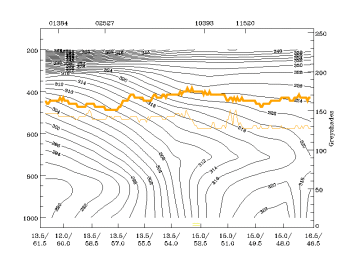
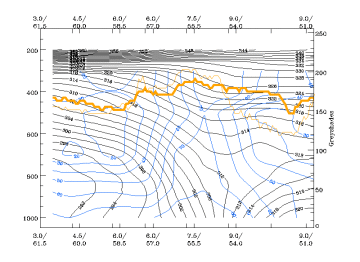
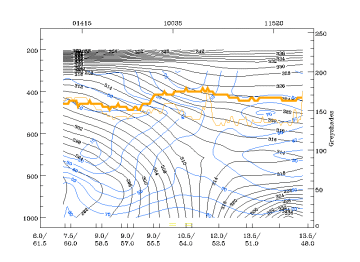
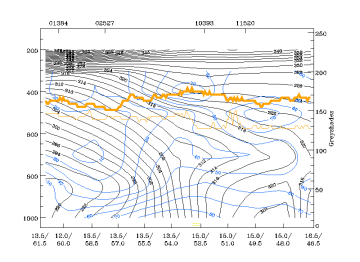
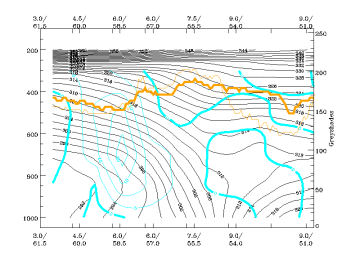
In order to more easily identify of the frontal surfaces and the selection of appropriate indicative isentropic surfaces, vertical cross sections are presented below (for exact location of isentropic surfaces see satellite images below).
|
02 June 2000/18.00 UTC - Vertical cross section; black: isentropes (ThetaE), orange thin: IR pixel values, orange thick: WV pixel values
|
03 June 2000/00.00 UTC - Vertical cross section; black: isentropes (ThetaE), orange thin: IR pixel values, orange thick: WV pixel values
|
|
03 June 2000/06.00 UTC - Vertical cross section; black: isentropes (ThetaE), orange thin: IR pixel values, orange thick: WV pixel values
|
|
The above vertical cross sections cover the area of the dissipation zone at three consecutive times. To the left of all 3 cross sections the frontal gradient zone of a CF can be seen, which remains more or less constant over the 12 hours of observation. On the basis of the information presented the following isentropic surfaces for relative streams are chosen:
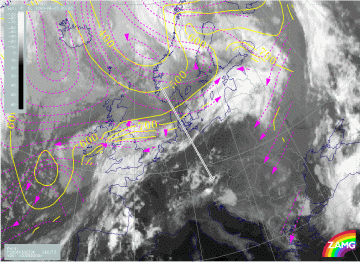
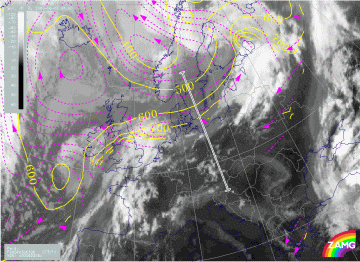
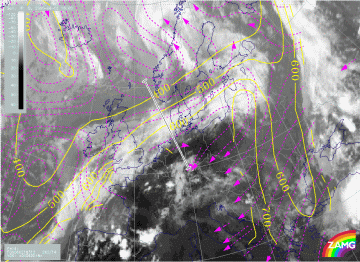
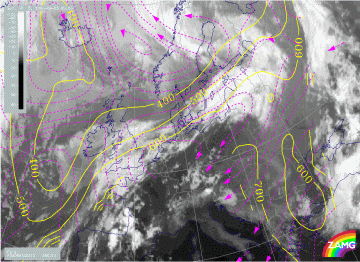
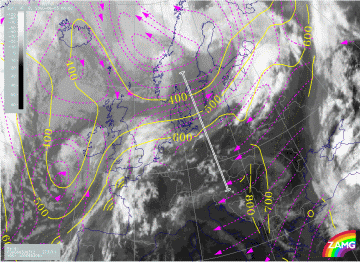
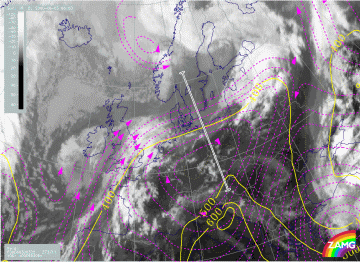
Relative streams at low levels
306K is an isentropic surface which represents low levels within the front. The air mass involved with the dry intrusion originates near the
centre of the main low. At 02/18.00 UTC a relative stream from behind the front crosses the cloud band at nearly right angles and descends from
550 hPa down to 800 hPa. At 03/00.00 UTC, the angle between the dry intrusion and the frontal cloud band becomes more acute. Air is still
sinking from 500 hPa to about 850 hPa. The descent indicated by the relative streams has reached its lowest level. At 03/12.00 UTC the cloud
dissipation has reached a mature stage. The Wave upstream, over Great Britain and the North Sea, has developed into a new system with Cold
Front and Warm Front, and a relative stream associated with the Warm Front is now dominant. The dry intrusion relative stream has moved to the
rear side of the frontal cloud band and has no more relevance for the mechanism of Front Decay.
The observed relative flow pattern at low levels support the physical concept of Front Decay very well.
|
02 June 2000/18.00 UTC - Meteosat IR image; magenta: relative streams 306K - system velocity: 262° 14 m/s, yellow: isobars,
position of vertical cross section indicated
|
03 June 2000/00.00 UTC - Meteosat IR image; magenta: relative streams 306K - system velocity: 260° 13 m/s, yellow: isobars,
position of vertical cross section indicated
|
|
03 June 2000/06.00 UTC - Meteosat IR image; magenta: relative streams 306K - system velocity: 273° 11 m/s, yellow: isobars,
position of vertical cross section indicated
|
|
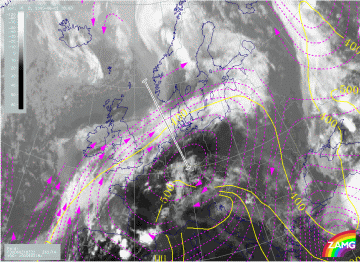
Relative streams at middle levels
By 18.00 UTC on the 02 June 2000, the isentropic surface of 312K shows a distinctly sinking upper relative stream. The relative stream related
to the main low, and responsible for cloud dissipation at lower levels is now situated more to the rear of the frontal cloud band. To the south
of the front band the relative streams indicate a sinking Warm Conveyor Belt over Denmark.
At 03/00.00 UTC both the upper relative stream and the Warm Conveyor Belt are becoming more pronounced, downward motion from 450 hPa to 650 hPa
over the dissolution zone of the Front Decay. At 06.00 UTC the Warm Conveyor Belt is dominating the whole frontal cloud band and reaches far
behind the front.
The Warm Conveyor Belt is rising over the area of the Warm Front over Great Britain and the North Sea, as well as over the area of the Cold
Front in Warm Advection over the Baltic Sea and the Baltic States. However, the relative stream over the dissipation zone still shows downward
motion.
|
02 June 2000/18.00 UTC - Meteosat IR image; magenta: relative streams 312K - system velocity: 262° 14 m/s, yellow: isobars,
position of vertical cross section indicated
|
03 June 2000/00.00 UTC - Meteosat IR image; magenta: relative streams 312K - system velocity: 260° 13 m/s, yellow: isobars,
position of vertical cross section indicated
|
|
03 June 2000/06.00 UTC - Meteosat IR image; magenta: relative streams 312K - system velocity: 273° 11 m/s, yellow: isobars,
position of vertical cross section indicated
|
|
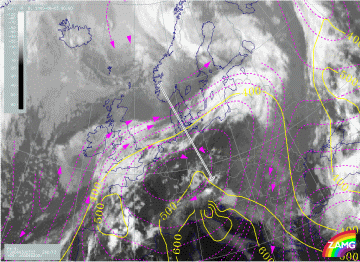
Relative streams at high levels
A very weak sinking Warm Conveyor Belt dominates the front at 18.00 UTC.
The sinking motion becomes more intense by 03/00.00 UTC associated with the dissipation of the frontal cloud band. At this time, a sinking Warm Conveyor Belt seems to be the driving force for the complete dissolution of the frontal clouds.
At 03/12.00 UTC, the sinking motion over Northern Europe and the Baltic Sea is still well shown by the relative streams of the isentropic
surface of 322K.
|
02 June 2000/18.00 UTC - Meteosat IR image; magenta: relative streams 322K - system velocity: 262° 14 m/s, yellow: isobars,
position of vertical cross section indicated
|
03 June 2000/00.00 UTC - Meteosat IR image; magenta: relative streams 322K - system velocity: 260° 13 m/s, yellow: isobars,
position of vertical cross section indicated
|
|
03 June 2000/06.00 UTC - Meteosat IR image; magenta: relative streams 322K - system velocity: 273° 11 m/s, yellow: isobars,
position of vertical cross section indicated
|
|
The distribution of relative streams at various levels demonstrates well the physical processe behind the significant dissipation of cloud dissolution observed in the satellite image loops. Furthermore, the case of 02/03 June 2000 is a good example of Front Decay; especially for that type of Front Decay where air masses at low and middle levels originate from near the centre of the main low.
The drying process causing the cloud dissipation can be related to the sinking upper relative streams to the rear of the frontal cloud band.
This is well seen in the vertical cross section of relative humidity:
A dry maximum, with 20% relative humidity on 02/18.00 UTC, is positioned to the rear of the frontal cloud band and extends at higher levels
during the next 12 hours over the complete frontal gradient zone; This can be associated with lower IR and WV pixel values. This mechanism
coincides with the observed reduction in cloudiness at higher levels during the initial stages of Front Decay.
|
02 June 2000/18.00 UTC - Vertical cross section; black: isentropes (ThetaE), blue: relative humidity, orange thin: IR pixel values,
orange thick: WV pixel values
|
03 June 2000/00.00 UTC - Vertical cross section; black: isentropes (ThetaE), blue: relative humidity, orange thin: IR pixel values,
orange thick: WV pixel values
|
|
03 June 2000/06.00 UTC - Vertical cross section; black: isentropes (ThetaE), blue: relative humidity, orange thin: IR pixel values,
orange thick: WV pixel values
|
|
Absolute Topography at 500 hPa and 1000 hPa
The conceptual model "Front Decay" also shows up very well using some parameters on isobaric surfaces. These rather basic parameters are available from model fields, and can be used operationally.
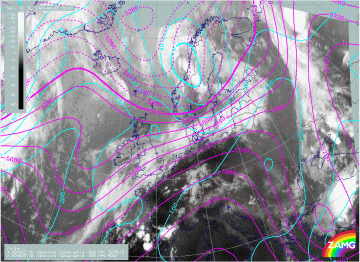
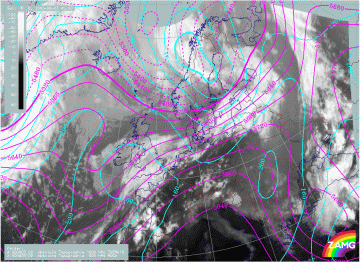
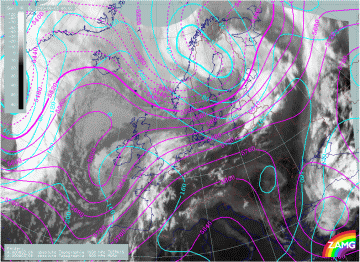
Height contours at 500 hPa and 1000 hPa
An extended upper level trough and a narrow low level depression with its associated frontal system generally persist at all stages of the Front Decay of the 02/03 June 2000. The acute angle between isolines of surface low and Upper Level Low indicates cold advection to the rear of and over the cloud band at 02/18.00 UTC. The angle between the isolines of the 1000 hPa and the 500 hPa height contours is decreasing a little during the life cycle, indicating a decrease in the intensity of CA during the following stages. The upper level isolines indicate a strong jet streak parallel to the frontal cloud band.
|
02 June 2000/18.00 UTC - Meteosat IR image; magenta: height contours 1000 hPa, cyan: height contours 500 hPa
|
03 June 2000/00.00 UTC - Meteosat IR image; magenta: height contours 1000 hPa, cyan: height contours 500 hPa
|
|
03 June 2000/06.00 UTC - Meteosat IR image; magenta: height contours 1000 hPa, cyan: height contours 500 hPa
|
|
Temperature Advection
In addition to the parameters on isentropic surfaces the conceptual model "Front Decay" shows up very well in some parameters on isobaric surfaces. These partly rather basic parameters are available in forecast fields, and therefore be used operationally. The case study is in very good agreement with the basic findings.
Temperature Advection
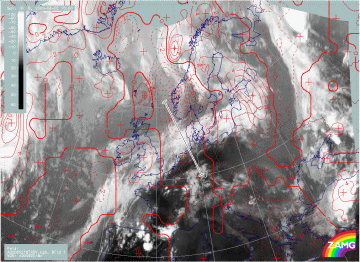
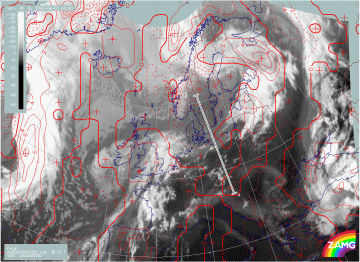
At 02/18.00 UTC there is marked CA over the frontal cloud band. The zero line of temperature advection (TA) appears almost at right angles to
the front line.
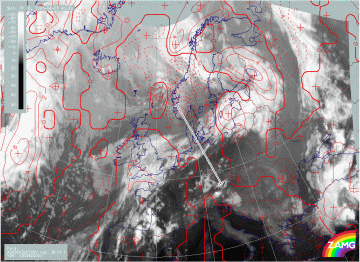
In the right image below, six hours later, the effect of this CA can already be seen as the dissipation zone of the frontal cloud band and
there is very good agreement between the CA zone and the cloud gap. By 06.00 UTC the CA is weakening. Upstream, the maximum of WA is associated
with the newly developed Warm Front over Great Britain and the North Sea. Downstream of the dissipation zone, a Cold Front in Warm Advection
has developed.
|
02 June 2000/18.00 UTC - Meteosat IR image; red dashed: temperature advection - CA 700 hPa, red solid: temperature advection - WA 700
hPa, position of vertical cross section indicated
|
03 June 2000/00.00 UTC - Meteosat IR image; red dashed: temperature advection - CA 700 hPa, red solid: temperature advection - WA 700
hPa, position of vertical cross section indicated
|
|
03 June 2000/06.00 UTC - Meteosat IR image; red dashed: temperature advection - CA 700 hPa, red solid: temperature advection - WA 700
hPa, position of vertical cross section indicated
|
|
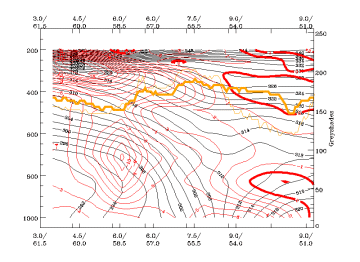
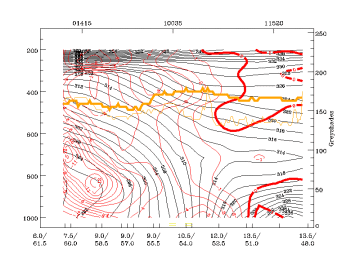
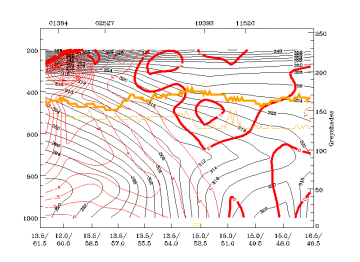
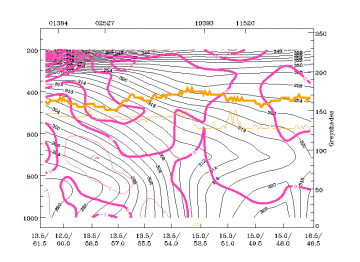
In addition to TA at 700 hPa, vertical cross sections of TA also support the conceptual model for Front Decay: The positions of the vertical cross sections are indicated in the satellite images above.
|
02 June 2000/18.00 UTC - Vertical cross section; black: isentropes (ThetaE), red thin: temperature advection - CA, red thick:
temperature advection - WA, orange thin: IR pixel values, orange thick: WV pixel values
|
03 June 2000/00.00 UTC - Vertical cross section; black: isentropes (ThetaE), red thin: temperature advection - CA, red thick:
temperature advection - WA, orange thin: IR pixel values, orange thick: WV pixel values
|
|
03 June 2000/06.00 UTC - Vertical cross section; black: isentropes (ThetaE), red thin: temperature advection - CA, red thick:
temperature advection - WA, orange thin: IR pixel values, orange thick: WV pixel values
|
|
At 18.00 UTC the decaying part of frontal cloud band is located in CA at all levels with a strong maximum at middle levels around 700 hPa. At 00.00 UTC the maximum of CA is at middle and lower levels, indicating strong descent over the previous six hours, also shown by the relative streams. At 06.00 UTC CA is weaker. WA at higher levels leads to stabilisation within the air column.
Thermal Front Parameter and Equivalent Thickness
In addition to the parameters on isentropic surfaces the conceptual model "Front Decay" shows up very well in some parameters on isobaric surfaces. These partly rather basic parameters are available in forecast fields, and therefore be used operationally. The case study is in very good agreement with the basic findings.
Thermal Front Parameter and Equivalent Thickness
|
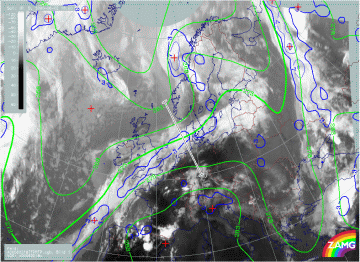
02 June 2000/18.00 UTC - Meteosat IR image; blue: thermal front parameter (TFP) 500/850 hPa, green: equivalent thickness 500/850 hPa,
position of vertical cross section indicated
|
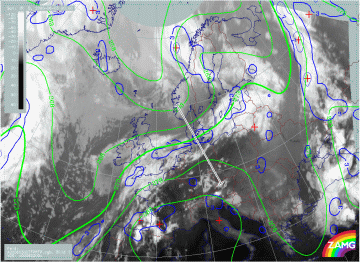
03 June 2000/00.00 UTC - Meteosat IR image; blue: thermal front parameter (TFP) 500/850 hPa, green: equivalent thickness 500/850 hPa,
position of vertical cross section indicated
|
|
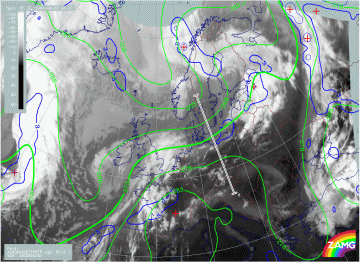
03 June 2000/06.00 UTC - Meteosat IR image; blue: thermal front parameter (TFP) 500/850 hPa, green: equivalent thickness 500/850 hPa,
position of vertical cross section indicated
|
|
In the 3 images above the dissipation of the frontal cloud band (FD) is clearly indicated by the equivalent thickness and the thermal front
parameter. At 02/18.00 UTC the gradient of isolines of the equivalent thickness, over the North Sea, to the rear of the cloud band, can be
clearly seen, and a continuos line of TFP accompanies the frontal cloud band, indicating a well developed baroclinic zone.
Although the lines of equivalent thickness show an even tighter gradient at 00.00 UTC, the thermal front parameter (TFP) is not as well
developed. At 06.00 UTC, the isolines of equivalent thickness still have a tight gradient but there is, no longer, any significant TFP over the
dissipation zone.
Vertical Motion and Divergence
In addition to the parameters on isentropic surfaces the conceptual model "Front Decay" shows up very well in some parameters on isobaric surfaces. These partly rather basic parameters are available in forecast fields, and therefore be used operationally. The case study is in very good agreement with the basic findings.
Vertical Motion and Divergence
|
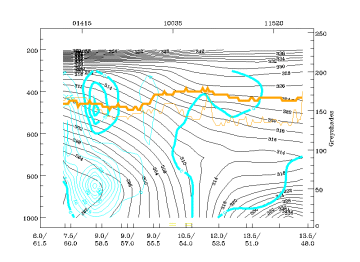
02 June 2000/18.00 UTC - Vertical cross section; black: isentropes (ThetaE), cyan thick: vertical motion (omega) - upward motion, cyan
thin: vertical motion (omega) - downward motion, orange thin: IR pixel values, orange thick: WV pixel values
|
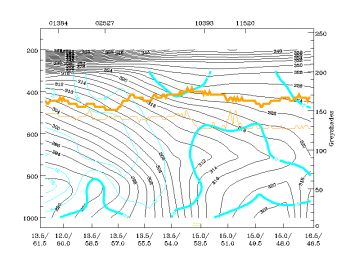
03 June 2000/00.00 UTC - Vertical cross section; black: isentropes (ThetaE), cyan thick: vertical motion (omega) - upward motion, cyan
thin: vertical motion (omega) - downward motion, orange thin: IR pixel values, orange thick: WV pixel values
|
|
03 June 2000/06.00 UTC - Vertical cross section; black: isentropes (ThetaE), cyan thick: vertical motion (omega) - upward motion, cyan
thin: vertical motion (omega) - downward motion, orange thin: IR pixel values, orange thick: WV pixel values
|
|
At 02/18.00 UTC the field of vertical motion indicates positive values within the frontal gradient zone implying descent. This is in contrast
with a classical Cold Front (see
Conceptual Models: Cold Front
). At 00.00 UTC, the descent becomes very strong to the rear of the frontal gradient zone at low levels, and has a secondary maximum above the
front. The appearance of this field of vertical motion is in general agreement with observations of the behaviour of relative streams in the
previous chapter.
By 06.00 UTC, there is a broad zone of downward motion at all levels within the frontal zone, supporting the observed complete dissipation of
the cloud band, as seen within the satellite loops.
|
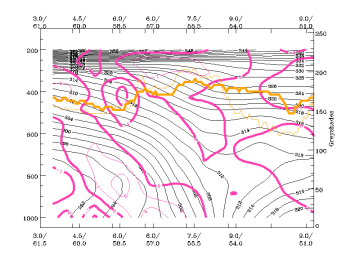
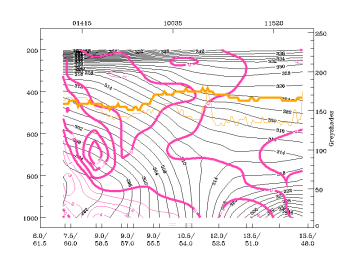
02 June 2000/18.00 UTC - Vertical cross section; black: isentropes (ThetaE), magenta thin: divergence, magenta thick: convergence,
orange thin: IR pixel values, orange thick: WV pixel values
|
03 June 2000/00.00 UTC - Vertical cross section; black: isentropes (ThetaE), magenta thin: divergence, magenta thick: convergence,
orange thin: IR pixel values, orange thick: WV pixel values
|
|
03 June 2000/06.00 UTC - Vertical cross section; black: isentropes (ThetaE), magenta thin: divergence, magenta thick: convergence,
orange thin: IR pixel values, orange thick: WV pixel values
|
|
The above sequence of vertical cross sections shows the distribution of divergence and convergence over 12 hours and, in particular, a pronounced zone of divergence below and within the frontal surface. In contrast, convergence above the frontal zone does not imply a classic Cold Front, however, there is a relationship with previously mentioned paramteter fields.
Jet streak and Vorticity Advection
In addition to the parameters on isentropic surfaces the conceptual model "Front Decay" shows up very well in some parameters on isobaric surfaces. These partly rather basic parameters are available in forecast fields, and therefore be used operationally. The case study is in very good agreement with the basic findings.
Jet streak and Vorticity Advection
|
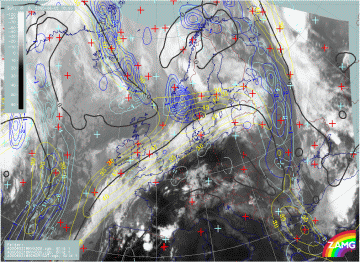
02 June 2000/18.00 UTC - Meteosat IR image; blue: negative vorticity advection (NVA) 500 hPa, cyan: negative vorticity advection (NVA)
300 hPa, yellow: isotachs 300 hPa, black: shear vorticity 300 hPa
|
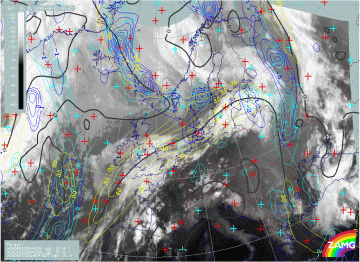
03 June 2000/00.00 UTC - Meteosat IR image; blue: negative vorticity advection (NVA) 500 hPa, cyan: negative vorticity advection (NVA)
300 hPa, yellow: isotachs 300 hPa, black: shear vorticity 300 hPa
|
|
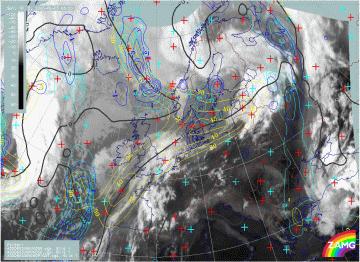
03 June 2000/06.00 UTC - Meteosat IR image; blue: negative vorticity advection (NVA) 500 hPa, cyan: negative vorticity advection (NVA)
300 hPa, yellow: isotachs 300 hPa, black: shear vorticity 300 hPa
|
|
The combination of the following parameters provides a different insight into the mechanisms of the cloud dissipation:
On 02 June 2000/18.00 UTC, isotachs at 300 hPa show a pronounced jet streak along and parallel to the rear edge of the frontal cloud band.
There are several weak maxima of negative vorticity advection at 300 hPa and 500 hPa. NVA associated with sinking motion can be observed in the
right exit region of a secondary jet streak maximum over Great Britain.
By 00.00 UTC the NVA maxima at 500 hPa and 300 hPa become more distinct over the cloud gap. This is the time when cloud dissipation starts. The most of the cloud gap is positioned near the anticyclonic side of the jet axis.
By 06.00 UTC there is still an NVA maximum at 500 hPa and a distinct NVA maximum at 300 hPa, extending from the rear of the front into a large
cloud gap. A jet streak maximum is also positioned above the northern boundary of the cloud dissipation zone.
The appearance of these parameters also supports the physical concept of Front Decay, but from a different point of view.
Overview and new aspects
In addition to the parameters on isentropic surfaces the conceptual model "Front Decay" shows up very well in some parameters on isobaric surfaces. These partly rather basic parameters are available in forecast fields, and therefore be used operationally. The case study is in very good agreement with the basic findings.
Jet streak and Vorticity Advection
|
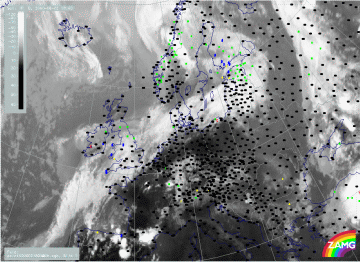
02 June 2000/18.00 UTC - Meteosat IR image; weather events (green: rain and showers, blue: drizzle, cyan: snow, purple: freezing rain,
red: thunderstorm with precipitation, orange: hail, black: no actual precipitation or thunderstorm with precipitation)
|
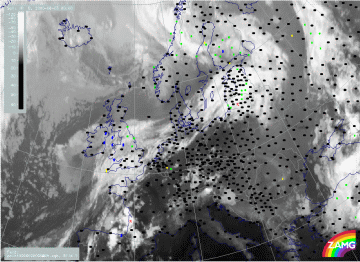
03 June 2000/00.00 UTC - Meteosat IR image; weather events (green: rain and showers, blue: drizzle, cyan: snow, purple: freezing rain,
red: thunderstorm with precipitation, orange: hail, black: no actual precipitation or thunderstorm with precipitation)
|
|
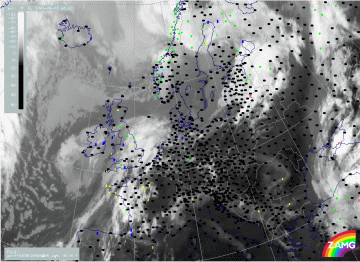
03 June 2000/06.00 UTC - Meteosat IR image; weather events (green: rain and showers, blue: drizzle, cyan: snow, purple: freezing rain,
red: thunderstorm with precipitation, orange: hail, black: no actual precipitation or thunderstorm with precipitation)
|
|
In this case study, the demonstration of a probable weakening of reported weather phenomena associated with cloud dissipation of Front Decay is
hindered by the fact that much of the cloud band lies over the North Sea and the Baltic Sea. At 02/18.00 UTC, weather reports from the British
Isles, Denmark and the Baltic States imply that the frontal cloud band is quite active, mostly accompanied by precipitation.
As a result of the dissipation of frontal clouds over Denmark at 00.00 UTC there are no more reports of precipitation over this region. By
06.00 UTC, the Front Decay is clearly seen, however there are only a few surface reports in this mainly maritime region.
