Table of Contents
- I. Introduction and Short Description of the Case
- Introduction
- The situation over the Arctic Sea before the development
- II. Analysis for 29 January 1998 06.00 UTC - Early Wave Stage
- 06.00 UTC - Satellite Overview
- 06.00 UTC - Frontal, Wave and Jet Streak diagnosis
- 06.00 UTC - Cross sections
- III. Analysis for 29 January 1998 12.00 UTC - Developing Wave Stage
- 12.00 UTC - Satellite Overview
- 12.00 UTC - Frontal and Wave diagnosis
- 12.00 UTC - Cross sections
- IV. Analysis for 29 January 1998 18.00 UTC - 30 January 1998 06.00 UTC - Rapid Development
- Rapid Development - Introduction
- Rapid Development - Satellite Overview
- Diagnosis of surface and Upper Level Lows
- Diagnosis of frontal parameters
- PVA and jet streak diagnosis
- Rapid Development - Cross sections
- Diagnosis of precipitation patterns with help of relative streams and NORDRAD radar
- V. Overview of Period 30 January 06.00 UTC - 18.00 UTC - Further Development of the Occlusion and ECMWF - HIRLAM Model Comparison
- Further development of the Occlusion
- Additional invesstigation: Comparison of HIRLAM fields vs. ECMWF fields of isotachs and PVA at 300 hPa
Introduction
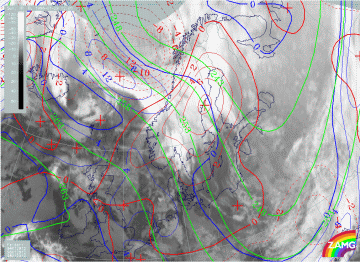
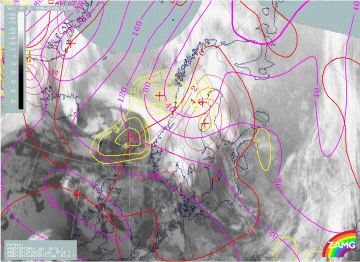
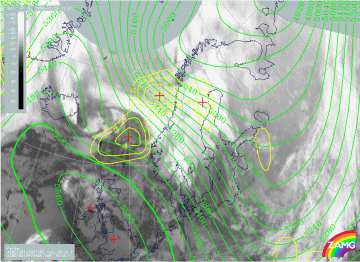
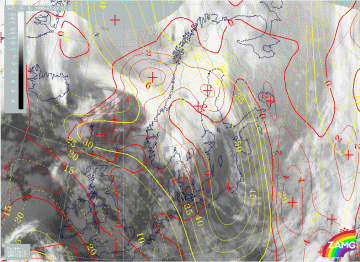
Scandinavian countries frequently experience passages of intensive low pressure systems originating over the Arctic areas. These depressions are challenging both forecasters and numerical models. This is because the depressions deepen in data-sparse regions. Depressions can also bring intensive weather with them, such as heavy snowfall and strong winds. The structure and development of these arctic depressions can be somewhat different from the classical mid-latitude cyclones.
This case study illustrates rapid the development of a low pressure system in a cold air stream over Scandinavia on 29 - 30 January 1998. The development can briefly be described as follows:
- A fresh northerly air stream is blowing on the Arctic Sea. An Arctic Front separating the polar air mass from extremely cold arctic air extends from east of Greenland towards northern Norway. A minor low pressure system forms on this front (north of the Lofoten Islands) early on 29 January, within an area of enhanced convection.
- A Wave forms along the Arctic Front.
- Associated with an upper trough moving south from the Arctic, the low pressure begins to deepen. The deepening is at first only gradual, but becomes more rapid later.
- As the low pressure deepens, it moves further south-east and occludes.
- Some moderate or heavy snowfall is observed especially during the Occlusion process, in particular on the south-east side of the low pressure centre. The most intensive weather is observed, however, during the late stages of development at the rear side of the system with extremely strong winds and heavy snow showers.
The situation over the Arctic Sea before the development
|
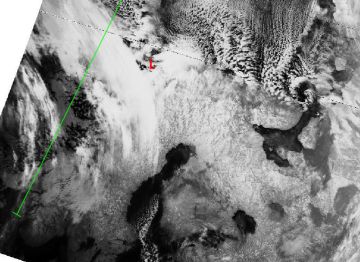
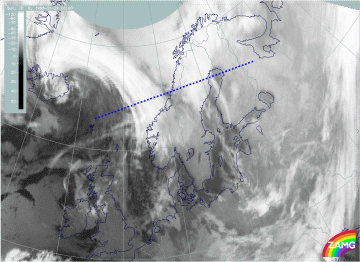
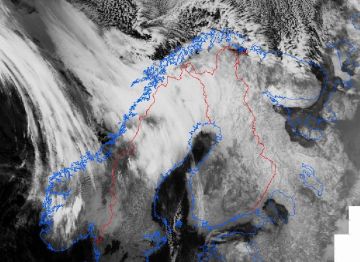
29 January 1998/01.44 UTC - NOAA CH4 image; red: location of the surface low; position of vertical cross section indicated
|
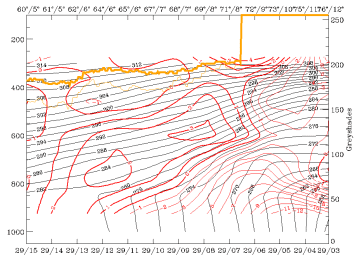
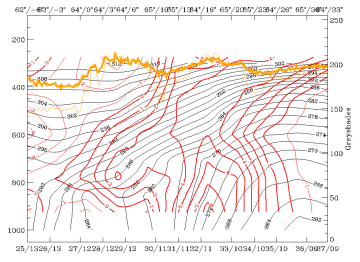
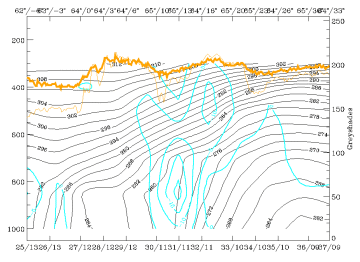
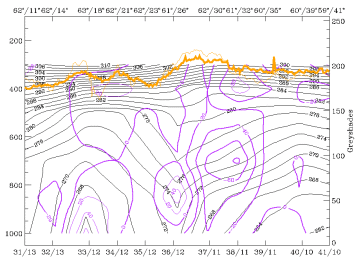
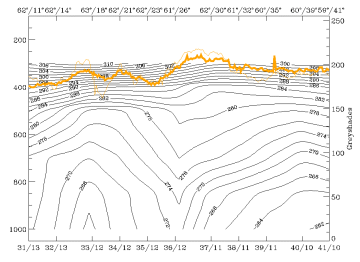
29 January 1998/00.00 UTC - Vertical cross section; black: isentropes (ThetaE), red thin: temperature advection - CA, red thick:
temperature advection - WA, orange thin: IR pixel values, orange thick: WV pixel values
|
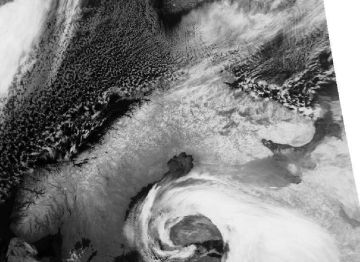
The NOAA image shows the typical signs for an outbreak of arctic air, such as numerous cloud streets oriented north-southwards. The area with enhanced convection is clearly seen as separate, white cloud masses north-west of Norway. A band of jet fibre cirrus extends from northern Sweden to the north-west.
The cross section shows the shallow nature of the fresh arctic cold advection. Around the area of interest (approximately 70N/10E) the cold advection is limited to the lowest 2 - 3 kilometres, which is a typical feature for arctic systems. Therefore stretching of the scale in the lowest 2 -3 kilometres would be appropriate when analyzing the cross sections of arctic (shallow) systems.
Another typical feature for the Arctic Front is the notable temperature gradient across the front. In this case the surface temperature difference was large (up to 20 degrees per 300 km on the area south of Bear Island).
06.00 UTC - Satellite Overview
|
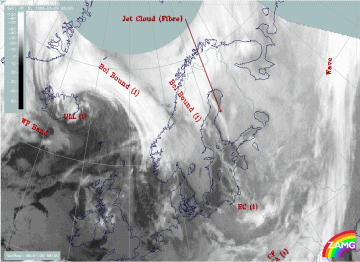
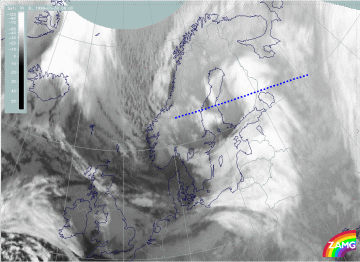
29 January 1998/06.00 UTC - Meteosat IR image; SatRep overlay: names of conceptual models
|
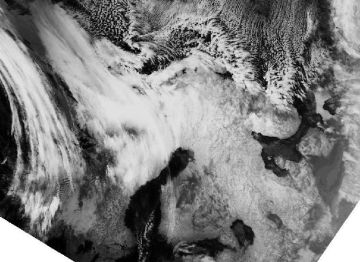
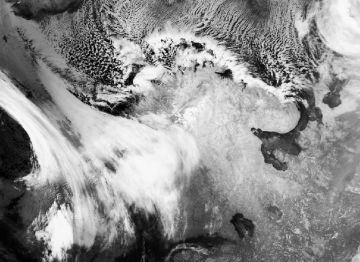
29 January 1998/06.24 UTC - NOAA CH4 image
|
|
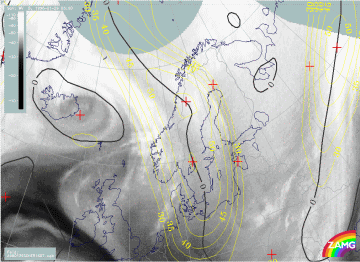
An overview of the satellite features together with the SatRep conceptual models show two Baroclinic Boundaries. The south-western one extends from Iceland to south Norway, while the north-eastern one is located over north Norway and Sweden. A possible development area over 71N/18E is not mentioned here. The NOAA image of the same time reveals much more details, especially of the northern cloud system. The notable cloud streets generated by the outbreak of arctic air over the open sea are clearly seen. The north-eastern cloud system is beginning to have a Wave - like appearance; this essential development is impossible to see if only data from a geostationary satellite are used.
06.00 UTC - Frontal, Wave and Jet Streak diagnosis
|
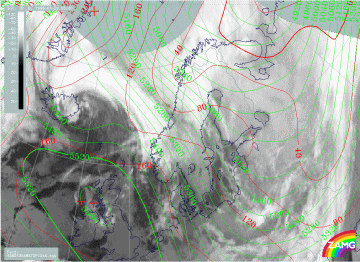
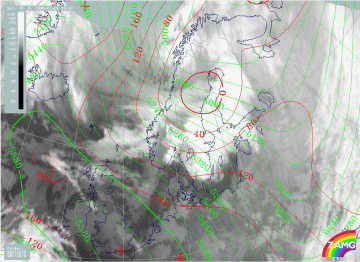
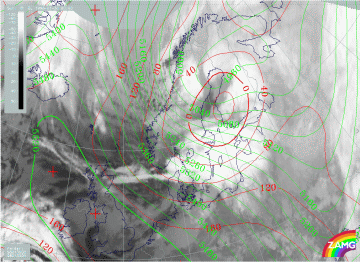
29 January 1998/06.00 UTC - Meteosat IR image; red: height contours 1000 hPa, green: height contours 500 hPa
|
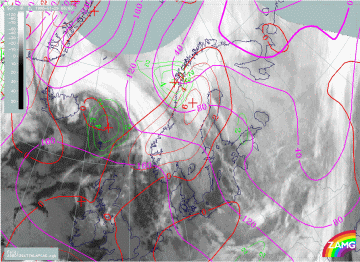
29 January 1998/06.00 UTC - Meteosat IR image; magenta: height contours 1000 hPa, green: positive vorticity advection (PVA) 500 hPa,
red: temperature advection - WA 1000 hPa
|
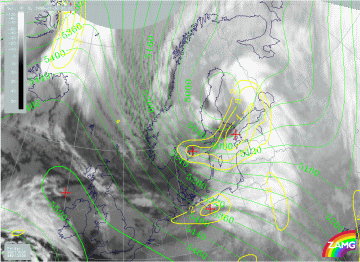
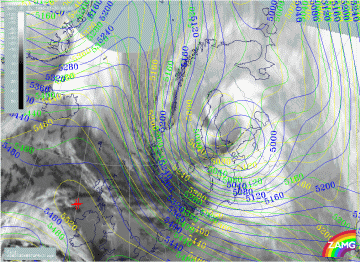
The locations of surface trough and upper trough indicate a configuration for a developing low with trough axis tilting backwards.
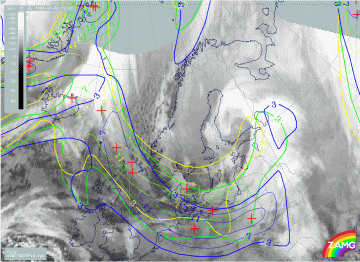
All numerical key parameters for wave development (positive vorticity advection at 500 hPa as well as warm advection) are fulfilled quite well around the Lofoten Islands.
|
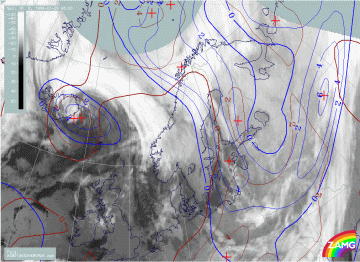
29 January 1998/06.00 UTC - Meteosat IR image; brown: curvature vorticity 500 hPa, blue: shear vorticity 500 hPa
|
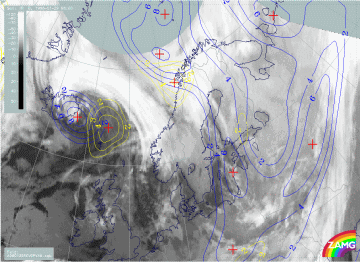
29 January 1998/06.00 UTC - Meteosat IR image; blue: relative vorticity 500 hPa, yellow: positive vorticity advection (PVA) 500 hPa
|
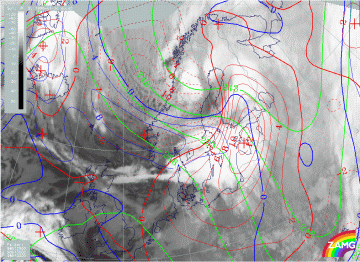
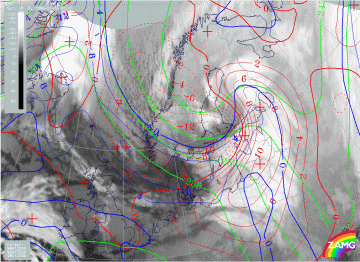
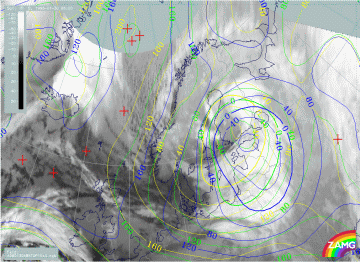
The PVA distribution at 500 hPa shows two distinct maxima. The first one is associated with the Icelandic upper level trough, while the other is connected to the upper trough and developing Wave over the Lofoten Islands. The inspection of vorticity components, shear and curvature shows that the resulting PVA is due to both vorticity and curvature vorticity north-west of the Lofoten Islands.
|
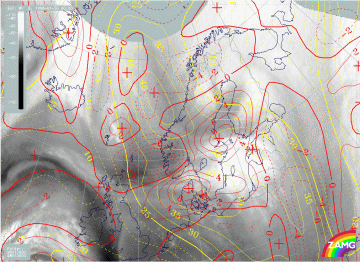
29 January 1998/06.00 UTC - Meteosat WV image; yellow: isotachs 300 hPa, black: shear vorticity 300 hPa
|
|
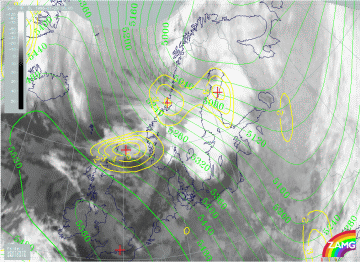
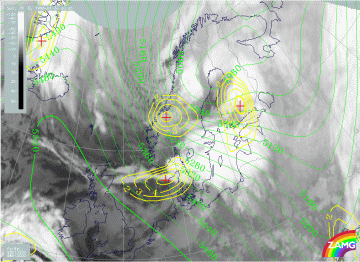
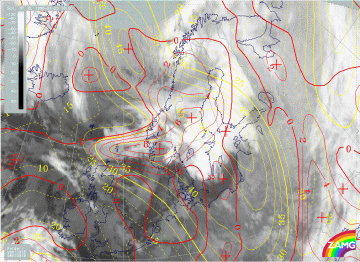
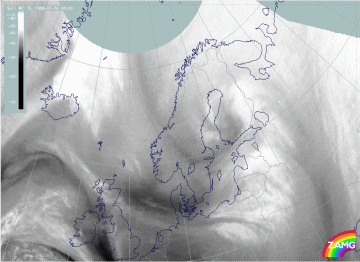
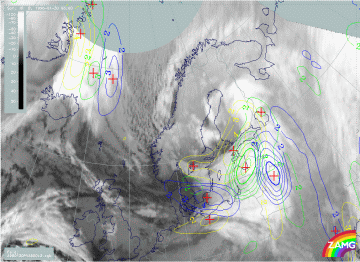
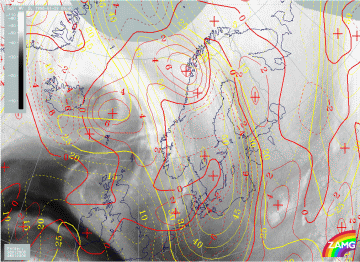
The model indicates one distinct very broad jet streak from the north-west across Scandinavia to north Germany and Poland. However, inspection of the WV image reveals two Dark Stripes, indicating two separate jet axes. The western one extends from the north-west to west Sweden and is associated with the south-western cloud band. The second stripe extends from the north-west to west Finland. However, the model jet axis is in the middle between the two Black Stripes in the WV image. It seems quite clear that the ECMWF model does not resolve the two jet axes satisfactorily, even though the model vaguely indicates a double structure with two separate jet maxima over south and north Sweden. The actual soundings around the Bay of Bothnia at 06.00 UTC (not shown) actually indicated that the jet stream and, accordingly, the shear on the cyclonic side of the jet were more intensive than the model suggested.
06.00 UTC - Cross sections
|
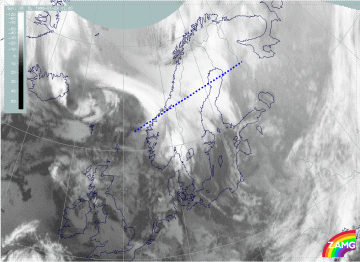
29 January 1998/06.00 UTC - Meteosat IR image; position of vertical cross section indicated
|
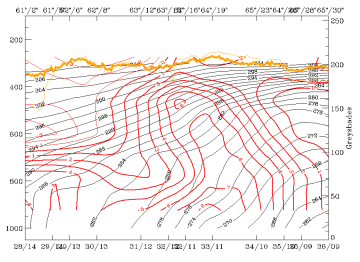
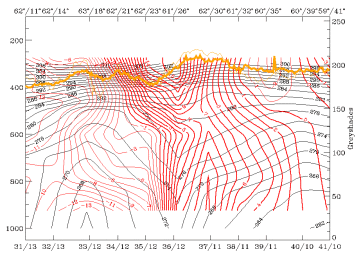
29 January 1998/06.00 UTC - Vertical cross section; black: isentropes (ThetaE), red thin: temperature advection - CA, red thick:
temperature advection - WA, orange thin: IR pixel values, orange thick: WV pixel values
|
|
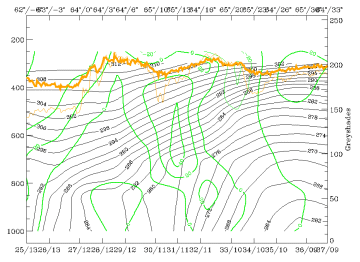
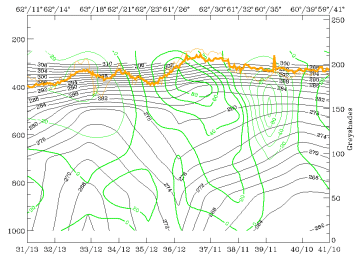
29 January 1998/06.00 UTC - Vertical cross section; black: isentropes (ThetaE), green thick: vorticity advection - PVA, green thin:
vorticity advection - NVA, orange thin: IR pixel values, orange thick: WV pixel values
|
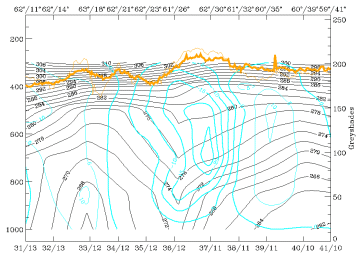
29 January 1998/06.00 UTC - Vertical cross section; black: isentropes (ThetaE), cyan thick: vertical motion (omega) - upward motion,
cyan thin: vertical motion (omega) - downward motion, orange thin: IR pixel values, orange thick: WV pixel values
|
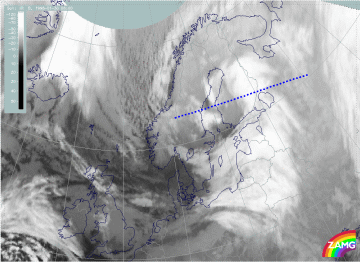
The cross section of temperature advection (right image top) across both cloud systems shows that there is a broad frontal zone in the isentropes with two surface fronts. The first one is located around 62N/06W (leftmost edge of the cross section) and the second around 65N/13W (in the middle of the cross section). Two separate zones of maximum warm advection for both frontal zones can be seen.
The increase of PVA with height (left image bottom) is evident in the north-eastern cloud band, but the PVA maximum is found at untypically low heights, at around 600 hPa.
The maximum upward motion (right image bottom) can be found at around 65N/13E, where also snowfall was observed. The location of the maximum is probably an indication of orographic effects. (Mountain tops are around 850 - 800 hPa over the area).
As a summary it can be said that the north-eastern cloud band was more developed and active than the south-western cloud band. Later this south-western band became weaker and finally merged with the developing north-eastern cloud band. The presence of two frontal areas close to each other makes the analysis complex. It is evident, though, that the role of the south-western cloud band in the development of Lofoten Islands low pressure was minor. For this reason the analysis concentrates from this point on mainly on the north-eastern cloud band and its development.
12.00 UTC - Satellite Overview
|
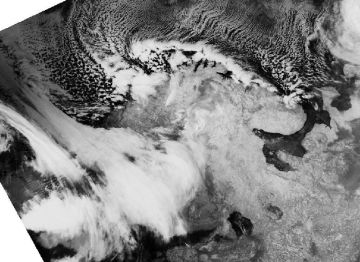
29 January 1998/08.24 UTC - NOAA CH5 image
|
29 January 1998/11.36 UTC - NOAA CH4 image
|
|
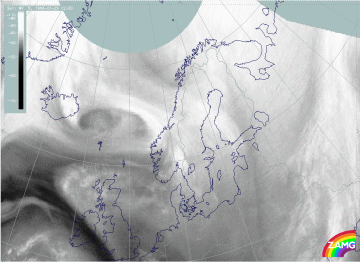
29 January 1998/12.00 UTC - Meteosat WV image
|
|
The evolution of the wave can be followed best with NOAA imagery (left and right images top). In the morning the wavy appearance is becoming clearer, and around noon the classical appearance of a Wave is evident. A structure which can be called a cloud head can be noticed over Sweden and Finland, centred around 65N/23E. The Meteosat water vapour image reveals a distinct higher WV cloud edge extending from 68N/10E - 65N/25E and a lower WV cloud bulge penetrating from below over Sweden and Finland around 66N/22E. A dry Dark Stripe extends from 72N/05E into northern Norway.
12.00 UTC - Frontal and Wave diagnosis
|
29 January 1998/12.00 UTC - Meteosat IR image; blue: thermal front parameter (TFP) 500/850 hPa, green: equivalent thickness 500/850
hPa, red: temperature advection 1000 hPa
|
29 January 1998/12.00 UTC - Meteosat IR image; magenta: height contours 1000 hPa, green: positive vorticity advection (PVA) 500 hPa,
red: temperature advection - WA 1000 hPa
|
|
29 January 1998/12.00 UTC - Meteosat IR image; green: height contours 500 hPa, yellow: positive vorticity advection (PVA) 500 hPa
|
29 January 1998/12.00 UTC - Meteosat IR image; yellow: isotachs 300 hPa, red: positive vorticity advection (PVA) 300 hPa
|
Frontal and Wave analyses show that both warm advection and cold advection have increased substantially. Cold advection especially is very strong and extensive over the Norwegian Sea.
The Wave parameters fit relatively well over north Sweden and coincide with the cloud structures. However, two PVA maxima can be found; the western one south-west of Lofoten is a result of curvature vorticity. Surface pressure contours are stretching southwards, the low pressure centre only slowly deepening and having a minimum pressure in north Sweden of about 1000 hPa.
The upper level trough and the western PVA maximum (67N/09E) are well correlated; the upper level trough coincides with cold air cloudiness. The PVA maximum is superimposed on the cloud band; the eastern PVA maximum over north Sweden is correlated with the developing Wave. Height contours do not show any notable trough for this PVA maximum, which possibly takes over the leading role in the Wave development.
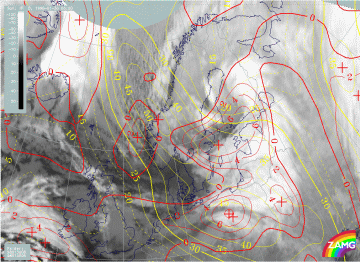
The double structure of PVA can be seen at both 300 hPa and 500 hPa. The western maximum at 67N/09E is located in the entrance region of the jet. The maximum over Sweden and Finland doesn't have the usual relation to the jet streak; the reason for this is unclear.
12.00 UTC - Cross sections
|
29 January 1998/12.00 UTC - Meteosat IR image; position of vertical cross section indicated
|
29 January 1998/12.00 UTC - Vertical cross section; black: isentropes (ThetaE), red thin: temperature advection - CA, red thick:
temperature advection - WA, orange thin: IR pixel values, orange thick: WV pixel values
|
The cross section is across the wave cloud band (left image) within the warm advection area of the Wave. The isentropes show a distinct warm advection maximum in the Wave area (right image). Warm advection extends throughout the troposphere. Two Warm Front - like zones with surface fronts can be seen; these frontal zones merge in middle altitudes in the centre of the cross section. The cold advection on top of warm advection in the left part of the cross section is associated with the south-western cloud band, and shows the unstable developments taking place near the coast of Norway. This process is due to the approach of an upper level low from east of Iceland.
|
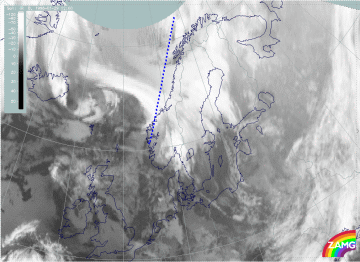
29 January 1998/12.00 UTC - Meteosat IR image; position of vertical cross section indicated
|
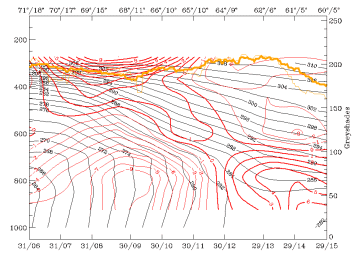
29 January 1998/12.00 UTC - Vertical cross section; black: isentropes (ThetaE), red thin: temperature advection - CA, red thick:
temperature advection - WA, orange thin: IR pixel values, orange thick: WV pixel values
|
Another cross section taken perpendicular to the Cold Front over the Norwegian Sea shows the temperature advection across the front. The cold air outbreak has spread as far as latitude 65N, and comparison with the respective cross section 12 hours earlier (compare The synoptic situation over the Arctic Sea before the development; note reversed viewing angle) shows that the cold advection has grown significantly in depth, although the intensity in the lowest layers has somewhat decreased. This is a typical example of a transformation of a shallow Arctic Front into a one containing deeper baroclinity.
Rapid Development - Introduction
During the next 12 hours rapid development took place. The upper level trough sharpened and a closed circulation formed. The surface low pressure began to deepen rapidly while it moved from north Sweden to west Finland and further towards south-east Finland. The intensive Wave development led to occlusion by the early hours of 30 January. The accompanying snowfall with the passage of the Occlusion was quite intensive, especially in south-east Finland, as will be shown later. The most notable weather events were observed, however, only later during 30 January (compare Diagnosis of precipitation patterns with help of the relative streams and NORDRAD radar composites).
Rapid Development - Satellite Overview
As the most striking cloud structure features were still located north of 60° latitude, the geostationary satellite data is not the best tool for visualizing the development of cloud systems. For this reason a series of consecutive NOAA satellite passes are shown in the following:
|
29 January 1998/14.36 UTC - NOAA CH4 image
|
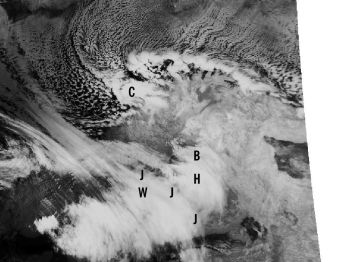
29 January 1998/16.16 UTC - NOAA CH4 image; B: cloud bulge, C: Comma, H: cloud head, J: Jet Fibre Cloudiness, W: Wave
|
|
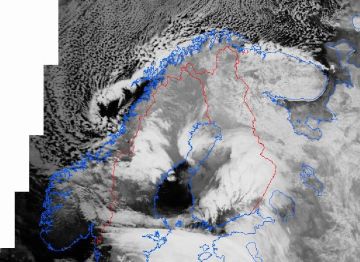
30 January 1998/01.29 UTC - NOAA CH5 image
|
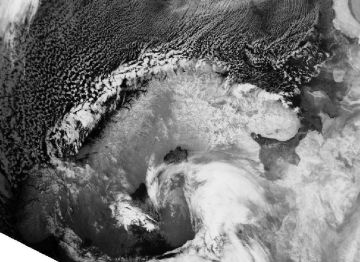
30 January 1998/06.02 UTC - NOAA CH4 image
|
The sequence of four NOAA IR channel (channel 4 or channel 5) images are shown to visualize the evolution of the wave cloud into a spiral-formed mature occluded storm. The first two images show the development a few hours after 12.00 UTC. These images show quite complex structures in the developing Wave (marked with W in 16.16 UTC image (right image top)). The cloud head (marked respectively with H) is becoming more and more pronounced. The images show also yet another cloud bulge emerging from beneath the cloud head (marked with B). The Jet Fibre Cloudiness indicating the location of the jet streak is also clearly seen (marked with J). A distinct Comma cloud pattern (marked with C) associated with the upper level trough can be seen north of the Lofoten Islands.
Unfortunately there is a several hours gap in NOAA passes during the evening and night. However, the first image for 30 January at 01.29 UTC (left image bottom) indicates that during the evening and night the system has developed considerably from a Wave into a cyclone with spiral cloudiness rotating around the vortex (centred in west Finland). The former head of the cloud is most probably seen almost as a separate hammer-like feature around 65N/22E.
The continuing development can be seen in the 06.02 UTC image (right image bottom) for the same day. This image indicates that the cloud vortex is very intensive. The cloud mass with the brightest tops has moved further south-east. The former head of the cloud is now moving southwards in a strong northerly air stream.
Diagnosis of surface and Upper Level Lows
|
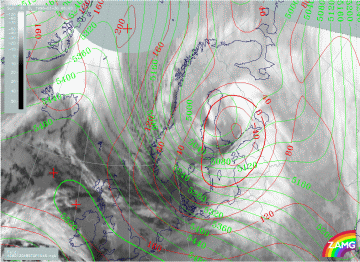
29 January 1998/18.00 UTC - Meteosat IR image; red: height contours 1000 hPa, green: height contours 500 hPa
|
30 January 1998/00.00 UTC - Meteosat IR image; red: height contours 1000 hPa, green: height contours 500 hPa
|
|
30 January 1998/06.00 UTC - Meteosat IR image; red: height contours 1000 hPa, green: height contours 500 hPa
|
|
The development of both the upper trough and surface low was quite rapid. At 18.00 UTC on 29 January (left image top) the inclination of the upper trough-surface low is typical for a developing baroclinic Wave with Upper Wave lagging behind the surface low. At 00.00 UTC on 30 January (right image top) a closed circulation is about to form on the upper flow over the Bay of Bothnia. Six hours later (left image bottom) a closed upper level low is found over west Finland, while an intensive surface low pressure centre can be found still some distance ahead of the Upper Level Low, over south Finland. An Occlusion - like cloud spiral is becoming more and more easy to recognize even in Meteosat IR images. The Comma cloud seen on 29 January 18.00 UTC (left image top) near the Lofoten Islands seems to travel quite fast and - though weakening - the cloud mass is still identifiable at 06.00 UTC on 30 January (left image bottom) over the Sea of Bothnia.
Diagnosis of frontal parameters
|
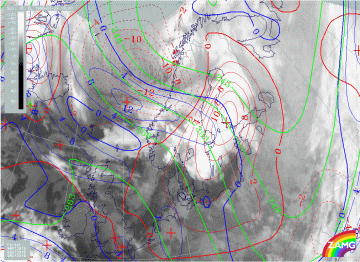
29 January 1998/18.00 UTC - Meteosat IR image; blue: thermal front parameter (TFP) 500/850 hPa, green: equivalent thickness 500/850
hPa, red: temperature advection 1000 hPa
|
30 January 1998/00.00 UTC - Meteosat IR image; blue: thermal front parameter (TFP) 500/850 hPa, green: equivalent thickness 500/850
hPa, red: temperature advection 1000 hPa
|
|
30 January 1998/06.00 UTC - Meteosat IR image; blue: thermal front parameter (TFP) 500/850 hPa, green: equivalent thickness 500/850
hPa, red: temperature advection 1000 hPa
|
|
The temperature advection pattern becomes very intensive during the stage of the most Rapid Cyclogenesis. Warm advection over Finland with a distinct cloudiness shield increases in the early hours of 30 January. A distinct Warm Front does not, however, exist. On the contrary the Cold Front is well developed over the Norwegian Sea within an area of cold advection. The front marks the boundary between the original arctic and polar air masses. The arctic air mass has gone through a lot of transformation due to its long journey over a relatively warm ocean. The difference between the air masses is, however, clearly identifiable even in geostationary satellite IR images, where extensive convection and convective lines oriented parallel to the thermal wind/thickness isolines at the rear of Cold Front are evident, while ahead of the front the convection seems to be absent.
Towards 06.00 UTC on 30 January (left image bottom) the typical appearance of an Occlusion is very clear: TFP associated with thickness ridge and associated warm advection beneath mark the location of the Occlusion. A lot of EC cloudiness (with also the aforementioned Comma cloud) is seen in the area of the thickness trough.
PVA and jet streak diagnosis
|
29 January 1998/18.00 UTC - Meteosat IR image; green: height contours 500 hPa, yellow: positive vorticity advection (PVA) 500 hPa
|
30 January 1998/00.00 UTC - Meteosat IR image; green: height contours 500 hPa, yellow: positive vorticity advection (PVA) 500 hPa
|
|
30 January 1998/06.00 UTC - Meteosat IR image; green: height contours 500 hPa, yellow: positive vorticity advection (PVA) 500 hPa
|
|
Some interesting features can be seen in PVA at 500 hPa. At 18.00 UTC on 29 January (left image top) two distinct PVA maxima can be found; the western one centred at 64N/10E is associated with the upper trough, while the eastern one over the Quark (61N/21E) is, according to its history, connected with the Wave but without any pronounced upper level trough. The third maxima (which is actually the most intensive, though not within the scope of this study) on the coast of south-west Norway is associated with the former Upper level Low, in front of an upper level trough.
By 00.00 UTC on 30 January (right image top) all three PVA maxima are distinct. The PVA maximum associated with the occluding system over Finland has increased due to the formation of the Upper level Low over the Bay of Bothnia. Therefore curvature vorticity is a driving factor. The PVA maximum over Norway (63N/10E) is also connected with an upper level trough and superimposed on the cold frontal band.
The double structure of PVA at 500 hPa holds until 06.00 UTC on 30 January (left image bottom), though the individual PVA maxima are merging.
|
29 January 1998/18.00 UTC - Meteosat IR image; yellow: isotachs 300 hPa, red: positive vorticity advection (PVA) 300 hPa
|
30 January 1998/06.00 UTC - Meteosat IR image; yellow: isotachs 300 hPa, red: positive vorticity advection (PVA) 300 hPa
|
The isotachs at 300 hPa show that, in addition to the already-mentioned jet streak passing from north-west through central parts of Scandinavia towards the Baltic States, there is another jet streak quickly making its way from east of Greenland towards the Norwegian Sea. This jet streak is associated with the upper level trough over northern parts of Scandinavia and it moves - as can be seen - quite fast during these 12 hours towards south Scandinavia.
The associated PVA field on 29 January at 18.00 UTC (left image) shows a complex situation with an unclassical pattern of PVA and jet streaks. The inspection of shear and curvature vorticity patterns (not shown) indicates that the reason for this untypical PVA field is the intensive curvature of the upper level trough.
On 30 January at 06.00 UTC (right image) the original jet streak, which had existed from the very beginning and which was not well located and structured in the ECMWF analysis is now decaying; the remnants of it can be noticed over the Baltic Sea and the Baltic States. The jet streak rushing from the Norwegian Sea towards south Scandinavia has strengthened, and an associated PVA maximum can be found in the classical position - on the left exit area of the jet streak.
Rapid Development - Cross sections
|
30 January 1998/06.00 UTC - Meteosat IR image; position of vertical cross section indicated
|
30 January 1998/06.00 UTC - Vertical cross section; black: isentropes (ThetaE), red thin: temperature advection - CA, red thick:
temperature advection - WA, orange thin: IR pixel values, orange thick: WV pixel values
|
|
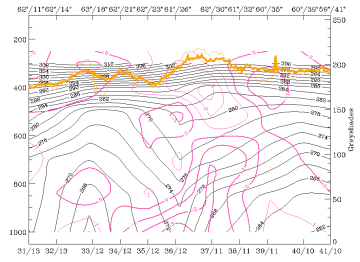
30 January 1998/06.00 UTC - Vertical cross section; black: isentropes (ThetaE), magenta thin: divergence, magenta thick: convergence,
orange thin: IR pixel values, orange thick: WV pixel values
|
30 January 1998/06.00 UTC - Vertical cross section; black: isentropes (ThetaE), green thick: vorticity advection - PVA, green thin:
vorticity advection - NVA, orange thin: IR pixel values, orange thick: WV pixel values
|
The vertical structure of the occluded front is seen best in the cross section at 06.00 UTC on 30 January (left image top). The cross section is taken perpendicular to the occluded front over Finland. Two peaks in IR can be discerned; around 63N/15E corresponding to the EC (Comma cloud) and between 62N/27E and 61N/31E corresponding to the Occlusion spiral over Finland. The huge pair of warm advection - cold advection (right image top) is a striking feature. The configuration of isentropes shows the typical trough pattern for the Occlusion between 800 and 500 hPa accompanied by intensive warm advection; some signs of a weak Warm Front zone to the east with upward inclined isolines can be noticed. They represent the classical configuration of upper-level Warm Front associated with occlusion.
A frontal zone of convergence (left image bottom) accompanies the lower part of the Occlusion and the Warm Front part. An increase of PVA (right image bottom) with height takes place within the Occlusion part; no PVA maximum is associated with the EC area. Intensive upward motion as a consequence of warm advection, convergence and PVA is concentrated around the Occlusion. There also seems to be sinking motion (left image below) in the area of cold advection to the west as well as to the east. In reality the sinking motion in the west is not exactly true: there was clearly convective precipitation connected to the EC cloudiness, as verified by radar (compare Diagnosis of precipitation patterns with help of relative streams and NORDRAD radar composites).
|
30 January 1998/06.00 UTC - Vertical cross section; black: isentropes (ThetaE), cyan thick: vertical motion (omega) - upward motion,
cyan thin: vertical motion (omega) - downward motion, orange thin: IR pixel values, orange thick: WV pixel values
|
30 January 1998/06.00 UTC - Vertical cross section; black: isentropes (ThetaE), lilac: Q-Vector (normal component), orange thin: IR
pixel values, orange thick: WV pixel values
|
As usual the frontogenesis (right image top) can be found in the frontal part at the boundary of the Occlusion; in this case it is bound to the Warm Front part. There is also clearly low-level frontogenesis taking place in the westernmost part of the cross section. Its location is apparently separate from the Cold Front located farther south.
Diagnosis of precipitation patterns with help of relative streams and NORDRAD radar
|
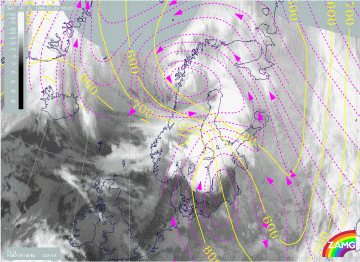
29 January 1998/18.00 UTC - Meteosat IR image; magenta: relative streams 282K - system velocity 332° 15 m/s, yellow: isobars
|
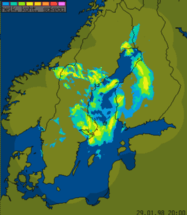
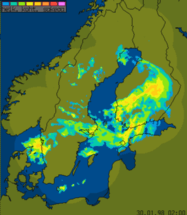
29 January 1998/18.00 UTC - Nordic radar network (NORDRAD) image; blue to magenta: light and heavy precipitation
|
Relative streams do not show very classical frontal situations for 18.00 UTC on 29 January (left image). The apparent warm conveyor belt over the Baltic Sea, south Sweden and south Finland contains a very intensive rising branch witin the cloud shield and Lee Cloudiness. The resulting precipitation can be noticed over east Sweden. The relative stream from behind the front shows sinking motion over cold air cloudiness (this area is not fully covered by the radar network), but rising motion over the Cold Front up to the higher cloudiness over central and northern parts of Finland. The precipitating areas in central parts of Sweden are connected to this rising relative air stream; note also the presence of intensive convective cells there associated with previously introduced PVA maxima at 500 and 300 hPa (compare PVA and Jet streak diagnosis). The precipitation over central parts of Finland also fits nicely with the maximum of warm advection and PVA maxima at 500 hPa.
|
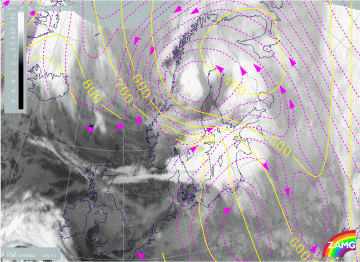
30 January 1998/00.00 UTC - Meteosat IR image; magenta: relative streams 284K - system velocity 325° 13 m/s, yellow: isobars
|
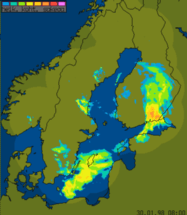
30 January 1998/00.00 UTC - Nordic radar network (NORDRAD) image; blue to magenta: light and heavy precipitation
|
The 00.00 UTC image for 30 January (right image) shows the intesification of snowfall over Finland. Moderate to heavy precipitation associated with the Occlusion is quite extensive in southern and central parts of Finland. Images with better resolution (not shown here) show clearly some precipitation bands oriented along the Occlusion front (south-west - north-east) with locally heavy snowfall. A typical form of Occlusion spiral is beginning to be visible also on radar images over the Bay of Bothnia.
Relative streamlines (left image) also show clearly the rising motion over south and central Finland fitting well with the radar image. Sinking motion takes place over Norway, which explains the gradual dissolution of the EC (Comma) cloudiness over north Sweden.
|
30 January 1998/06.00 UTC - Nordic radar network (NORDRAD) image; blue to magenta: light and heavy precipitation
|
|
The 06.00 UTC image for 30 January shows the intensive area of precipitation over south-east Finland, whereas in west Finland there is almost no snowfall for the time being. The snowfall in east Finland is associated with a rising branch of the relative stream at lower levels (below, left image bottom) representing the cold conveyor belt. The relative stream suggests that intensive rising motion would be present over west Finland (around 63N/24E). This vertical motion cannot be verified with radar.
|
30 January 1998/06.00 UTC - Meteosat IR image; position of vertical cross section indicated
|
30 January 1998/06.00 UTC - Vertical cross section; black: isentropes (ThetaE), orange thin: IR pixel values, orange thick: WV pixel
values
|
|
30 January 1998/06.00 UTC - Meteosat IR image; magenta: relative streams 274K - system velocity 318° 14 m/s, yellow: isobars
|
30 January 1998/06.00 UTC - Meteosat IR image; magenta: relative streams 288K - system velocity 318° 14 m/s, yellow: isobars
|
On higher isentropic surfaces (right image bottom) the classical frontal situation can be noticed: a Warm Conveyor Belt is over Poland, the Baltic States and White Russia. It is strongly rising there and connected with the high cloud shield. The relative stream connected with the dry intrusion from the north-west is also clearly seen. Since this relative stream transports very dry air from the north-west (compare image below), the slight rising of the air is not capable of causing any precipitation at the rear of the front over south and west Finland.
|
30 January 1998/06.00 UTC - Meteosat WV image
|
|
The EC/Comma cloudiness is located over east Sweden and there are still some snow showers associated with it. On Quark between Sweden and Finland the first sign of new convective development is seen as a narrow and south-west - north-east oriented line of precipitation.
Further development of the Occlusion
|
30 January 1998/11.25 UTC - NOAA CH4 image
|
30 January 1998/15.54 UTC - NOAA CH4 image
|
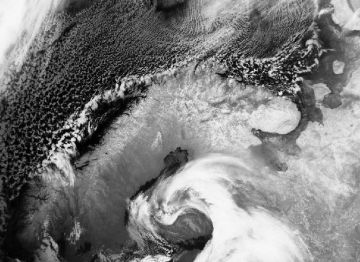
The typical appearance of a mature occluded low can be seen in these polar orbit satellite images. The rotation of the cloud spiral around the Upper Level Low continued throughout the day. The EC/Comma cloud seen at 06.00 UTC over east Sweden quickly propagated towards the south and was located around Stockholm at noon and over the Baltic Sea in the afternoon, being still identifiable in the 15.54 UTC NOAA image (left image) west of Estonia. Intensive lines of bright cloud bands were formed over the Bothnian Sea. The bands grew during the day; extremely heavy snow showers were associated with these cloud bands.
|
30 January 1998/06.00 UTC - Meteosat IR image; yellow: height contours 500 hPa 06.00 UTC, green: height contours 500 hPa 12.00 UTC,
blue: height contours 500 hPa 18.00 UTC
|
30 January 1998/06.00 UTC - Meteosat IR image; yellow: height contours 1000 hPa 06.00 UTC, green: height contours 1000 hPa 12.00 UTC,
blue: height contours 1000 hPa 18.00 UTC
|
The low pressure centre moved slowly towards Estonia and did not deepen any more, as the Upper Level Low (left image) caught the surface low centre (right image) leading to vertical tilt of the surface low - upper level low axis. Associated with a quick rise of pressure on the rear side of the low the pressure gradient became very tight between Sweden and Finland. Winds over this area increased a lot during the day with maximum values exceeding 30 m/s on the Sea of Åland in the afternoon of 30 January. The combined effect of extreme winds and snowfall resulted in exceptionally hazardous weather in areas of Finland and Sweden.
|
30 January 1998/06.00 UTC - Meteosat IR image; yellow: positive vorticity advection (PVA) 500 hPa 06.00 UTC, green: positive vorticity
advection (PVA) 500 hPa 12.00 UTC, blue: positive vorticity advection (PVA) 500 hPa 18.00 UTC
|
30 January 1998/06.00 UTC - Meteosat IR image; yellow: thermal front parameter (TFP) 500/850 hPa 06.00 UTC, green: thermal front
parameter (TFP) 500/850 hPa 12.00 UTC, blue: thermal front parameter (TFP) 500/850 hPa 18.00 UTC
|
The PVA maximum (left image) connected with the cold front band over the Baltic Sea can be followed across the Baltic States to White Russia, intensifying there. The secondary maximum over south Sweden is shifted southwards, intensifying as well.
The TFP (right image) moves southward till 18 UTC with the Cold Front part entering Poland and the air mass boundary extending from the North Sea to south Denmark. The Occlusion part propagates to the south-east as well.
Additional invesstigation: Comparison of HIRLAM fields vs. ECMWF fields of isotachs and PVA at 300 hPa
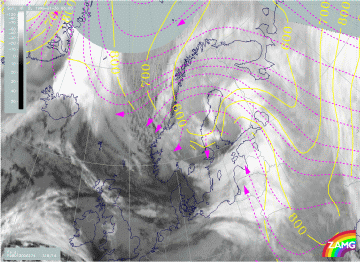
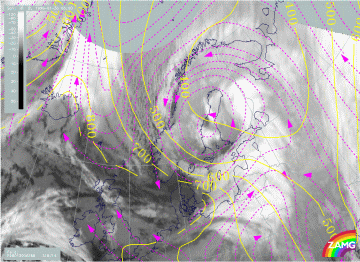
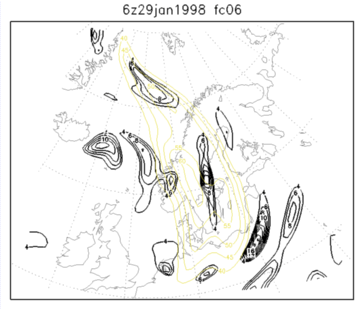
The analysis of 300 hPa parameters and especially the comparison of features in the WV channel with the ECMWF model showed, as previously mentioned, that the ECMWF model was not capable of separating the two jets in the early Wave stage (compare06.00 UTC - Frontal, Wave and Jet Streak diagnosis). An interesting question arises, whether the HIRLAM model would give a better result.
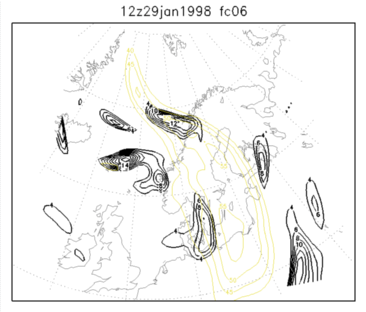
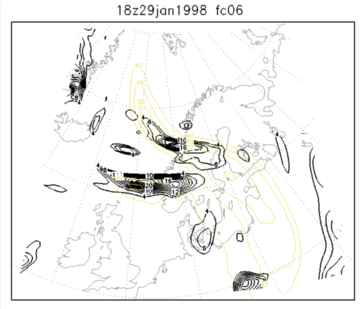
Fields of 300 hPa isotachs and PVA were used for the comparison. Six hour forecasts for five consecutive HIRLAM runs were selected, the first time step being for 29 January 06.00 UTC and the last for 30 January 06 UTC. The analysis fields apparently contained more details and substructures, which were not so strikingly present in six hour forecast fields.
|
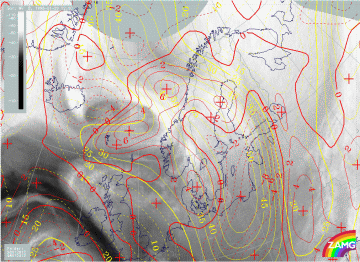
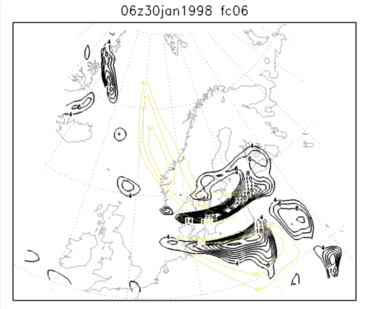
29 January 1998/06.00 UTC - Six-hourly HIRLAM forecast; yellow: isotachs 300 hPa, black: positive vorticity advection (PVA) 300 hPa
|
29 January 1998/06.00 UTC - Meteosat WV image; yellow: isotachs 300 hPa, red: vorticity advection 300 hPa
|
|
29 January 1998/12.00 UTC - Six-hourly HIRLAM forecast; yellow: isotachs 300 hPa, black: positive vorticity advection (PVA) 300 hPa
|
29 January 1998/12.00 UTC - Meteosat WV image; yellow: isotachs 300 hPa, red: vorticity advection 300 hPa
|
|
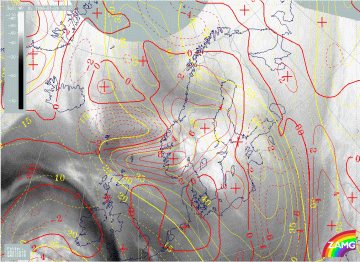
29 January 1998/18.00 UTC - Six-hourly HIRLAM forecast; yellow: isotachs 300 hPa, black: positive vorticity advection (PVA) 300 hPa
|
29 January 1998/18.00 UTC - Meteosat WV image; yellow: isotachs 300 hPa, red: vorticity advection 300 hPa
|
|
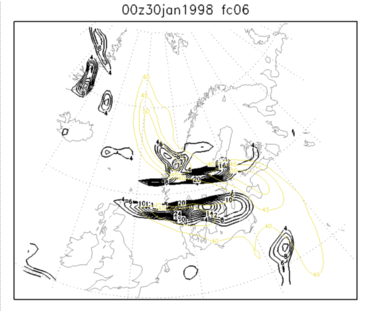
30 January 1998/06.00 UTC - Six-hourly HIRLAM forecast; yellow: isotachs 300 hPa, black: positive vorticity advection (PVA) 300 hPa
|
30 January 1998/06.00 UTC - Meteosat WV image; yellow: isotachs 300 hPa, red: vorticity advection 300 hPa
|
As the PVA fields in the HIRLAM model certainly show much more detailed structure, which can partly be numerical noise, care must be taken when drawing any conclusions. Some interesting features seen in the images can, however, be listed:
- The HIRLAM model shows much more clearly the initial double structure of the jet streak. This can be seen, for example, in the images for 29 January at 12.00 UTC, where the HIRLAM model is in very good accordance with the observations as well as WV images.
- The PVA maxima are generally about twice as intensive in HIRLAM as in ECMWF. This applies to the maxima associated with the upper level trough coming from the north as well as to the initial Icelandic Upper level Low. The gradient in PVA is also generally much more pronounced in HIRLAM, which - at least in this case - makes the separate maxima quite prominent.
- The development of PVA for the respective systems is roughly the same in both models, but at certain periods notable differences can be seen. For example, the location of the PVA maximum associated with the upper level trough on 29 January at 06.00 UTC is in HIRLAM more to the north than in ECMWF.
- Apparently there are some PVA maxima which are not really relevant for the analysis. On the other hand, at least in this case, the HIRLAM model does not seem to miss any meteorologically important PVA maxima.
- The intensification of the upper level trough is nicely seen as rapidly increasing values in the HIRLAM model on 30 January 1998 at 06.00 UTC, when the closed Upper Level Low has formed south of Finland.
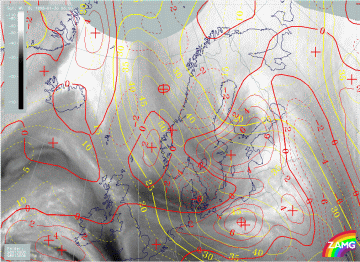
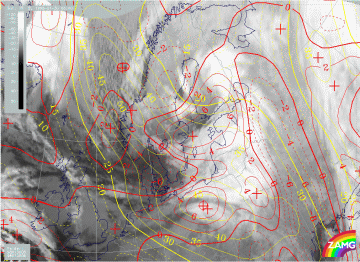
- The HIRLAM PVA fields fit nicely to the observed cloud systems. This can be seen most clearly by comparing PVA on 30 January 1998 at 06.00 UTC to IR images for the same time.
|
30 January 1998/06.00 UTC - Meteosat IR image; yellow: isotachs 300 hPa, red: vorticity advection 300 hPa
|
|
Drawing any further conclusions based on only this one short comparison is not relevant. It is clear, though, that the more detailed HIRLAM fields are a valuable help in synoptic analysis.
