Chapter VI: Deformation zones in WV imagery
Table of Contents
- Chapter VI: Deformation zones in WV imagery
- Deformation zones
- Example: 29 December 2012, 06:00 UTC
Deformation zones
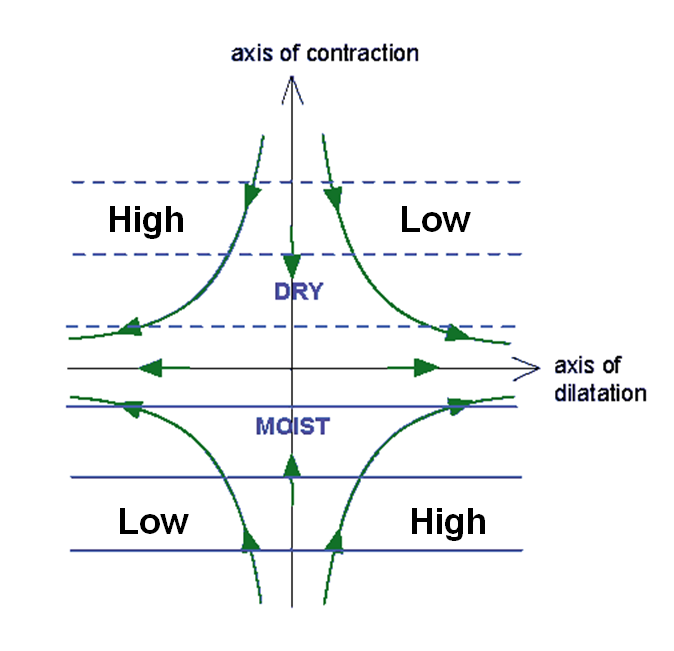
Deformation zones are regions where the atmospheric flow is undergoing contraction in one direction and elongation (or stretching) in the perpendicular direction. A circulation pattern opposing cyclonic and anticyclonic circulation is necessary for deformation zones to form.
Figure 1: Schematic showing a deformation zone. The green arrows indicate the direction of the air stream around high and low pressure zones.
Since WV acts as a tracer in the atmosphere, deformation zones are easy to detect in WV image loops, particularly in cases when IR and VIS images are cloud free. Deformation zones are revealed by sharply defined moisture contrasts, as there is no mixing across the flows. Because anti-cyclonic circulations tend to be rather dry, black stripes are usually associated to deformation zones. These black stripes are usually located in the vicinity of jet streaks on the cold side of warm fronts and occlusions, or on the cold side of inactive air mass boundaries.
Notice:
| The intensity of the deformation zone is proportional to the strength of the moisture gradient across the zone. Clear air turbulence (CAT) is frequently encountered in deformation zones. |
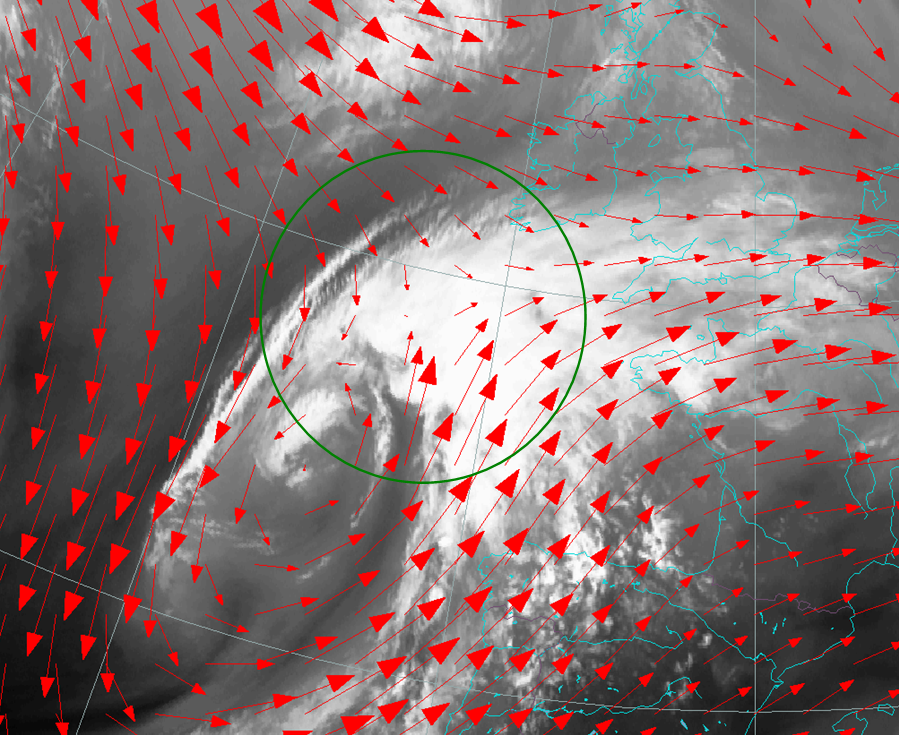
Figure 2: WV 6.2 µm satellite image from 12 September 2012 at 18:00 UTC. The red arrows indicate wind direction at 500 hPa, and the green circle shows the deformation zone at the occlusion point of the frontal system.
Figure 2 shows a typical location of a deformation zone: near the poleward edges of cloud bands in warm fronts and occlusions. The WV image also shows cloud fibers and transverse cloud bands over the Atlantic southwest of Ireland which are indications of strong winds and wind shear in the upper parts of the troposphere (northwestern part of the green circle).
In this transition zone we also find the splitting of the warm conveyor belt (WCB) into two branches as indicated in figure 3. In mature low pressure systems, the WCB carries moist air from the warm sector ahead of the cold front line towards the occlusion point of the system. At the occlusion point, one branch of the warm conveyor belt turns left along the occluded front, while the other branch is directed along the warm front. As the WCB is continuously rising along its path, the splitting occurs in upper levels of the troposphere, in the vicinity of the jet streak. The sudden change in the direction of the WCB, together with strong wind shear in the vicinity of the jet are factors that favor the occurrence of turbulence.
Figure 3: Schematic of a warm conveyor belt (red) in a mature frontal system.
Notice:
| Deformation zones are not always visible in IR images like in the example above. In fact, air mass boundaries and almost dissolved or inactive cold fronts can have strong deformation without being visible in IR or VIS images. |
This will be shown in the next example.
Example: 29 December 2012, 06:00 UTC
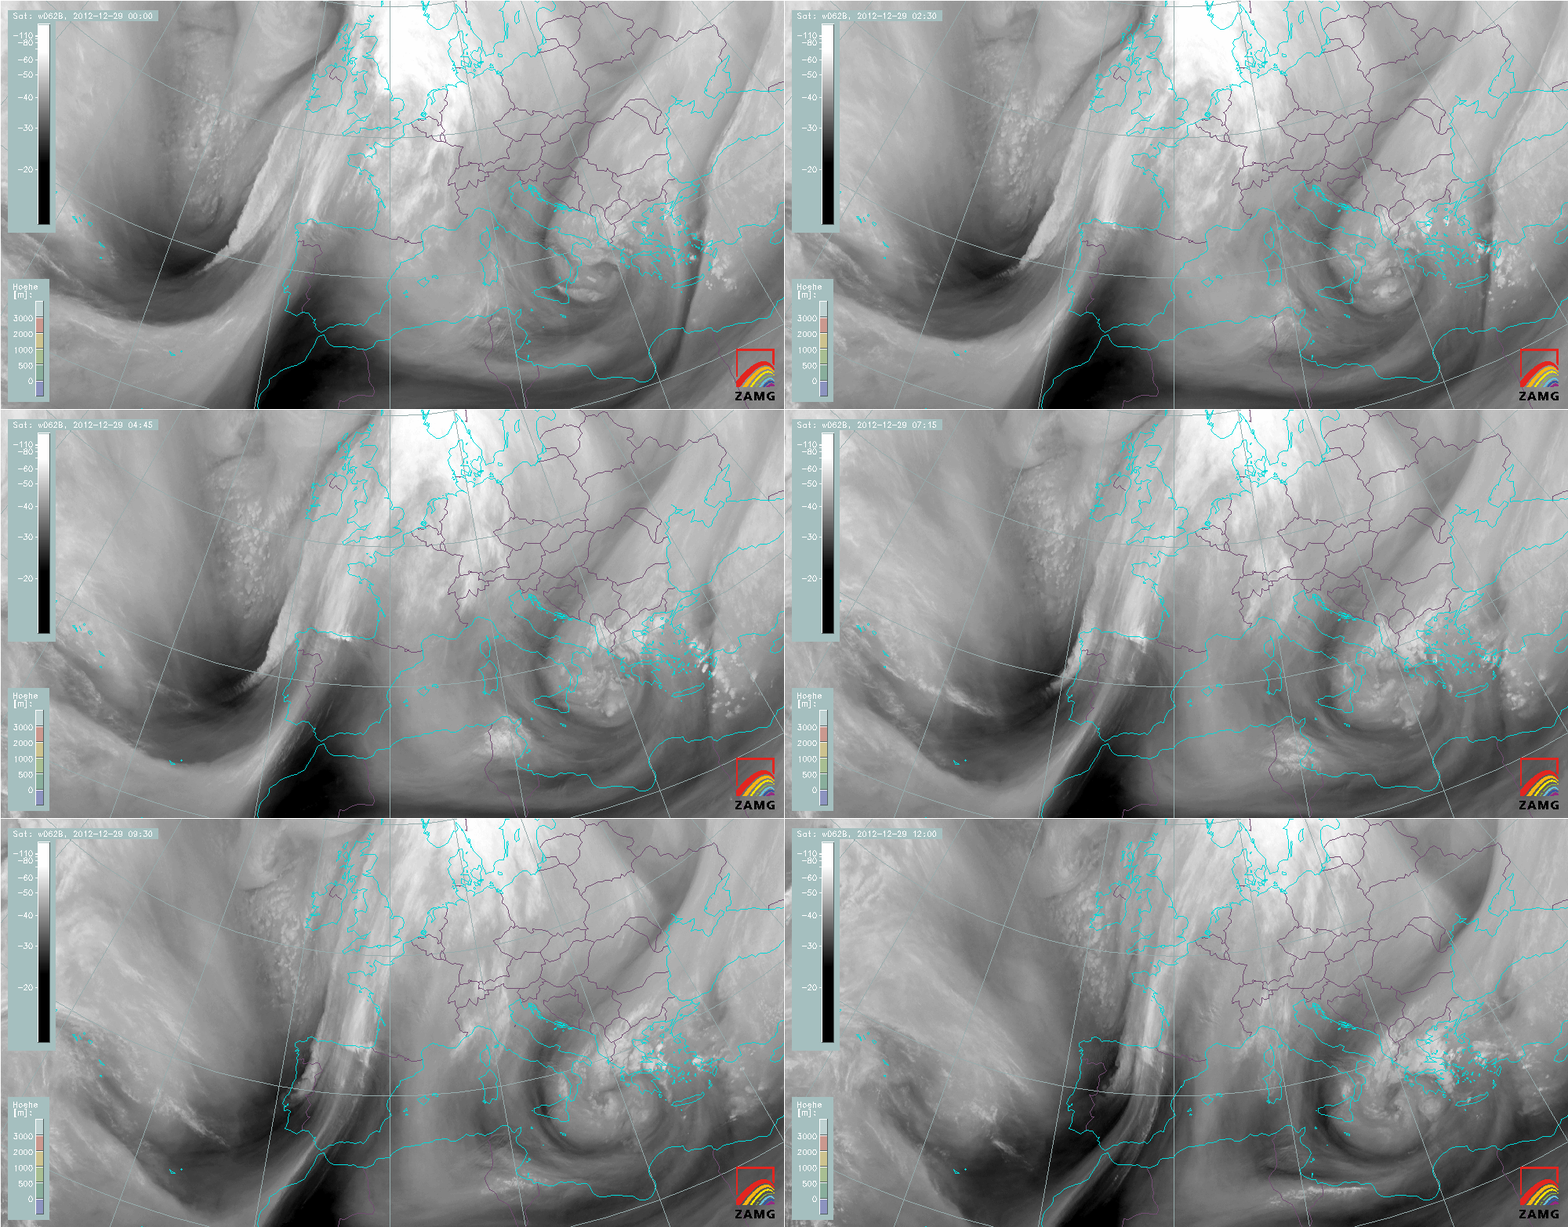
On December 29 2012, two deformation zones can be observed in WV images over Europe. These deformation zones are not visible in IR imagery, but can be clearly seen in the WV loop.
Question
Find the two deformation zones in the WV6.2 satellite image by clicking in the selected region. Have a look at the WV-loop
(figure 5).
- Solution: Click here to see these zones.
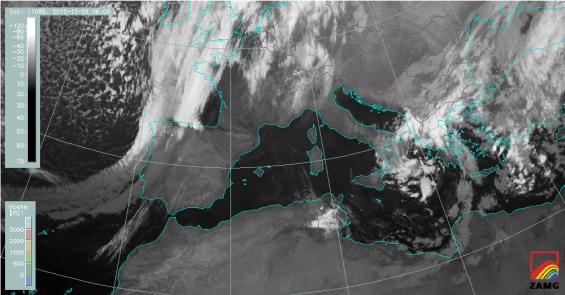
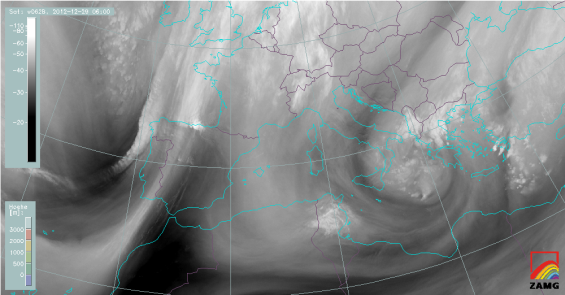
Figure 4: The frontal cloud band extending from Portugal/Spain towards the coast of Morocco is hardly visible in the IR 10.8 µm image. WV 6.2 µm shows a humid zone delimiting an air mass boundary.
Figure 5: This 12-hour loop of the WV 6.2 µm channel gives a clear indication of the location of the deformation zones.
To better understand the underlying physical processes, we will discuss vertical cross sections (VCS) of the frontal cloud band west of the Moroccan coast. While the deformation zone over southeast Europe is a transition zone between a warm front and an occlusion, as shown in the first example (figure 2), the deformation zone next to Gibraltar has a different origin.
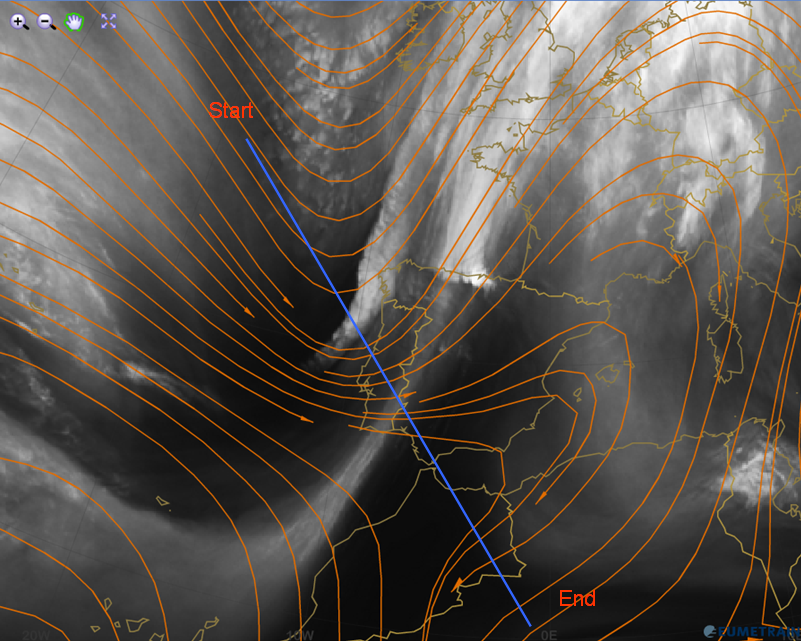
Figure 6: WV 6.2 µm image from 29 December 2012, 06:00 UTC. The blue line marks the location of the selected VCS (Atlantic – Algeria).
a) 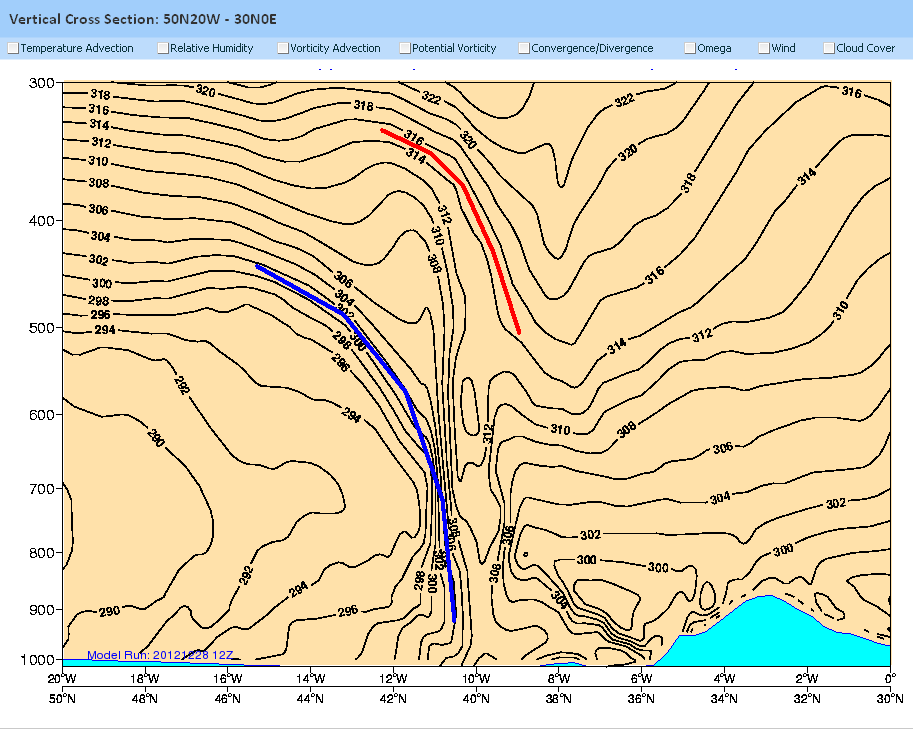 |
b) 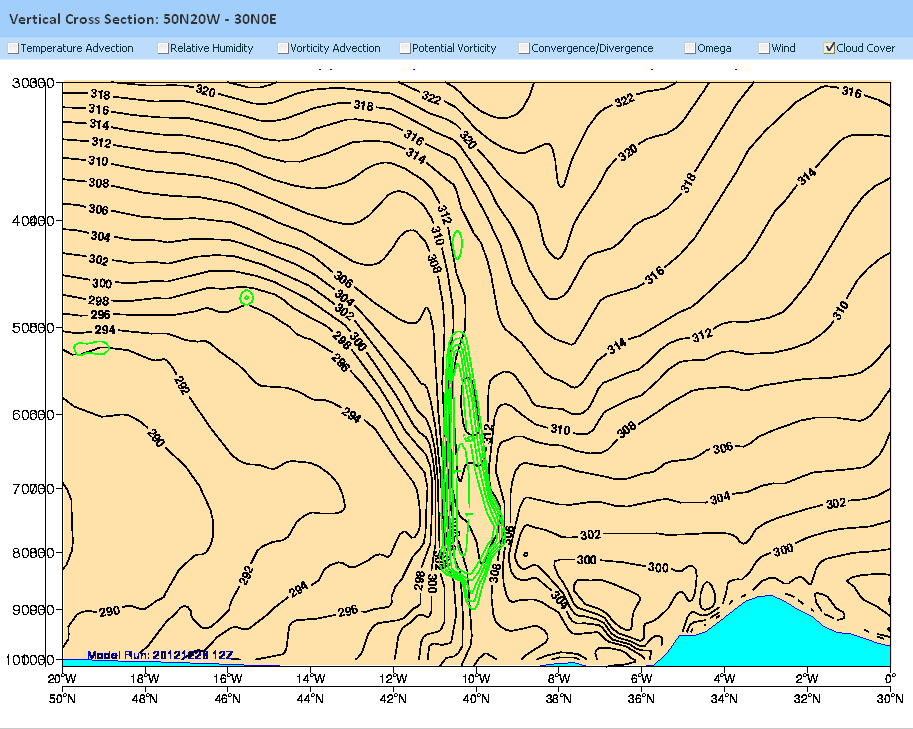 |
c) 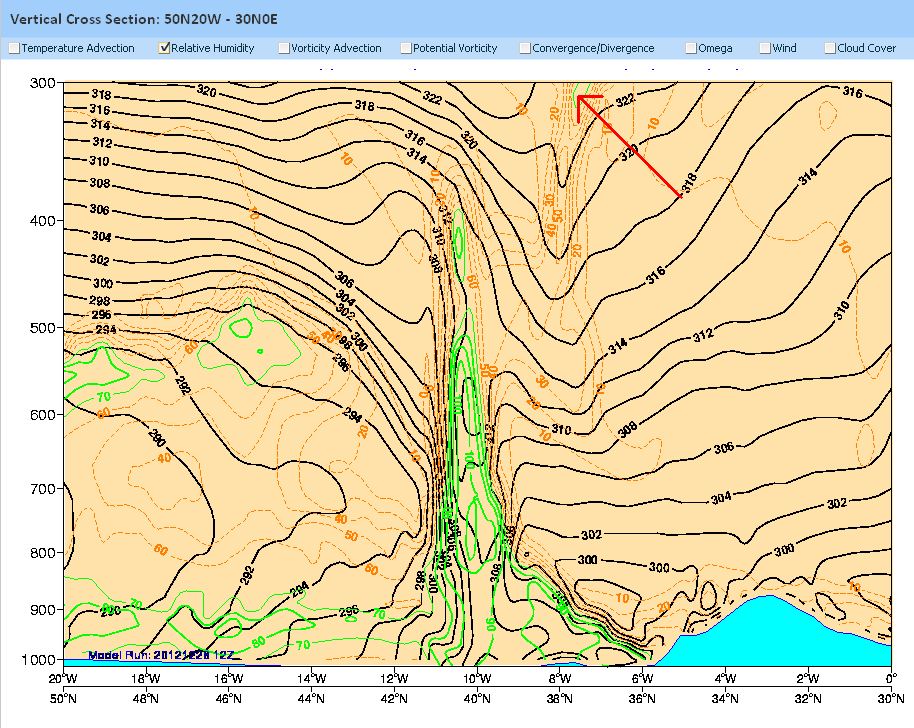 |
d) 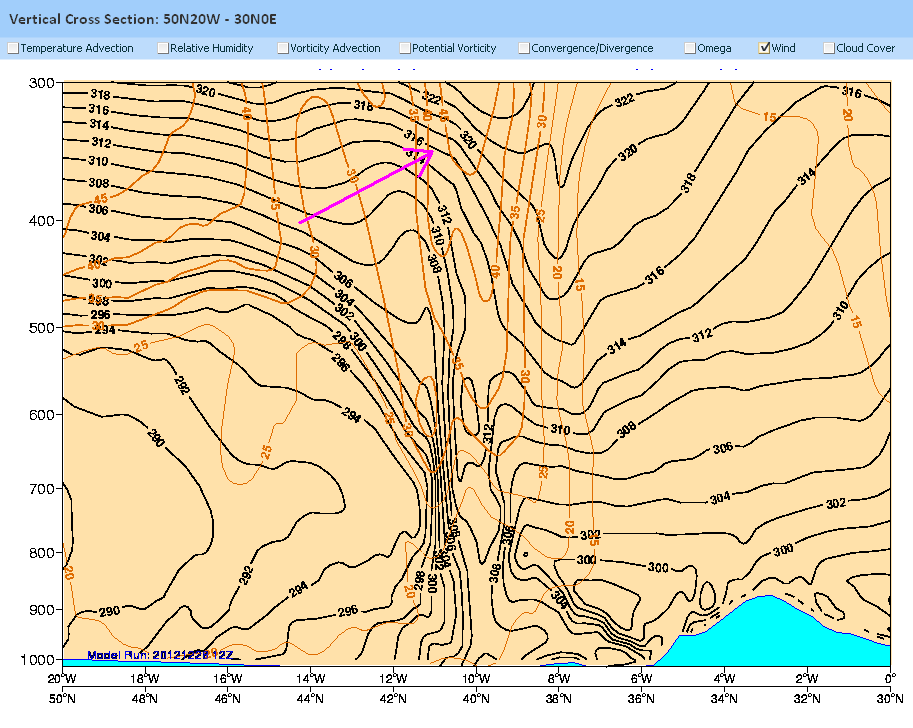 |
Figure 7a-7d: Vertical cross section of the deformation zone. Description of the parameters is given below.
Figure a) shows the isolines of the equivalent potential temperature. A steep cold front reaches from 400 hPa down to the surface (41N and 11W). The cold front (blue line) is moving in an easterly direction. An upper level cold front (red line) can be seen ahead of the cold front and above 500 hPa.
Figure b) shows the cloud cover (green lines) as additional NWP field. Cloud cover extends from 900 to 500 hPa and is clearly part of the cold front. These clouds are visible in the IR image (figure 4), while the upper level cold front is cloud-free.
Figure c) shows the field of relative humidity. Here, we can see a secondary maximum of the relative humidity field associated to the upper level cold front (red arrow). This maximum of the upper tropospheric humidity can be seen as a narrow grey band in the WV imagery (figure 6).
Figure d) shows the isotachs. The wind speed maximum (jet streak) is around 300 hPa (40N and 10W). Strong wind shear (green arrow) can be seen in the area of the upper level cold front, east of the jet streak.
The example above demonstrates that dynamic processes in the upper troposphere might be seen clearly in WV imagery, while they are invisible for IR and VIS channels.
