Chapter IV: Black stripes: Jets and Tropopause folding
Table of Contents
- Chapter IV: Black stripes: Jets and Tropopause folding
- Black stripes
- Black stripes and tropopause folding
Black stripes
Water vapor images depict atmospheric flows much better than visible or infra-red images. The distribution of humid and dry regions depends not only on vertical motion in the troposphere but also on the horizontal movement of air (figure 1). Humidity acts as a tracer, reflecting upper air streams above 600 hPa.

Figure 1: WV 6.2 µm image from 18 December 2012 at 12:00 UTC and wind vectors at 400 hPa.
Black stripes in WV images result from the subsidence of dry stratospheric air and are often associated with jet streaks. The jet stream axes are oriented along the moisture gradients in WV images. The orientation of the dark stripe on the cold side of the jet corresponds to the orientation of the jet axis.
Jet streams are located along the thermal gradient of the polar front. Jet streaks (maxima of wind speed within the jet stream) can be observed at the rear side of cold fronts, ahead of warm fronts and along the rear sides of upper level troughs.
As can be seen in figure 2, not all moisture gradients and black stripes in WV images coincide with jet streams. Additionally, there has to be a strong gradient in the geopotential of the 1.5 PVU surface.
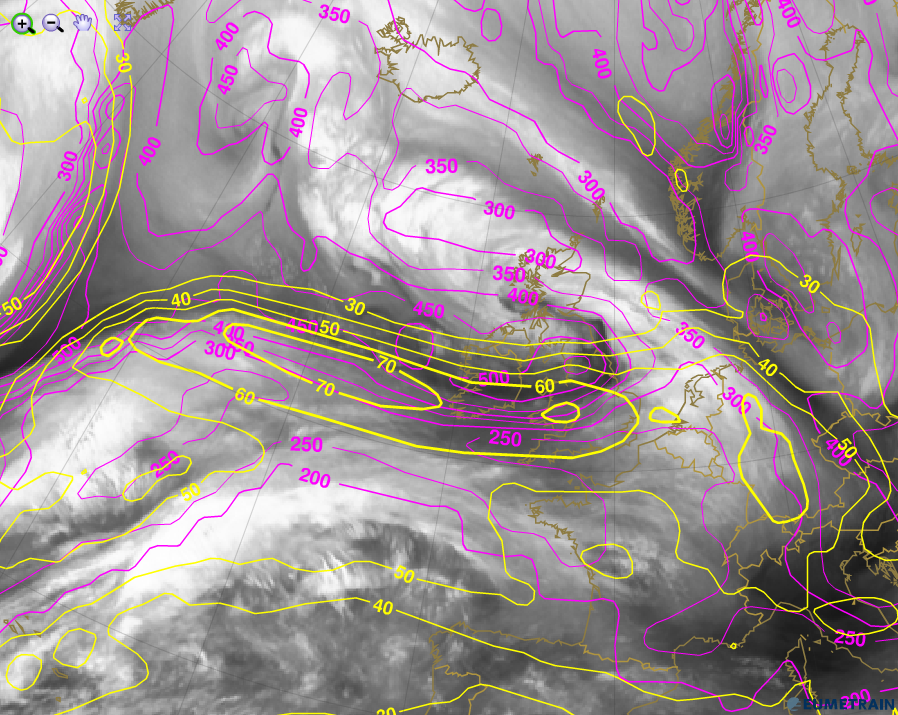
Figure 2: WV 6.2 µm image from 31 January 2013 at 06:00 UTC. Magenta isolines depict the height of the PV=1.5 PVU surface, yellow isolines depict the isotachs of the polar jet at 300 hPa.
In WV imagery, the dark, dry zones located near jet streaks usually correspond to the cold side of the jet axis. In the case of a classic cold front, the jet axis is oriented along the back of the frontal zone, showing as a moisture boundary within the cold, sinking air mass. The highest wind speeds in the upper troposphere are located at these moisture boundaries.
These boundaries not only contrast sharply in WV imagery near polar frontal zones (see figure 3), but they are also visible at the back of upper level troughs and near baroclinic boundaries or upper level fronts.
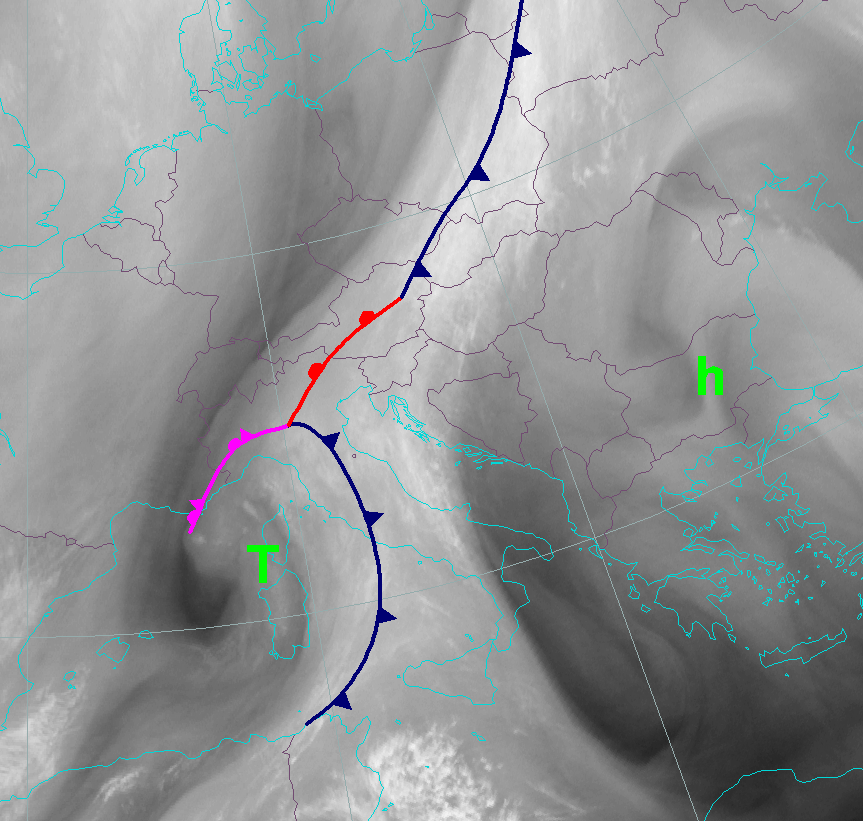
Figure 3: Surface analysis of a frontal system over central Europe superimposed over the WV 6.2 µm image from 2 January 2013 at 12:00 UTC.
In Polar Regions, the black stripes are less distinct in images taken by geostationary satellites. For the most part, the following three reasons are responsible for this effect:
- The tropopause is lower than in mid-latitudes; hence moisture gradients may be below the main contribution levels of the WV spectral channels
- The geostationary MSG satellite sees polar regions from a strongly inclined angle, resulting in a blurred image without sharp moisture contrasts.
- Due to the cold temperatures, the moisture content of the troposphere is much lower than in mid-latitudes.
In mid-latitudes, the position of the jet axis is well reflected by sharp boundaries in the WV image. While IR images also give information on the presence of strong upper level winds (e.g. cirrus fibers), WV images indicate the position of the jet axes. This information can be used when comparing the NWP output of the jet axis with the actual position of the WV boundary. Deviations between the position or the structure of the WV boundary and the model-derived jet axis can be an indication of the model being inaccurate. This is the most important way of using WV imagery in weather forecasting (see also chapter 9 on real and simulated WV imagery).
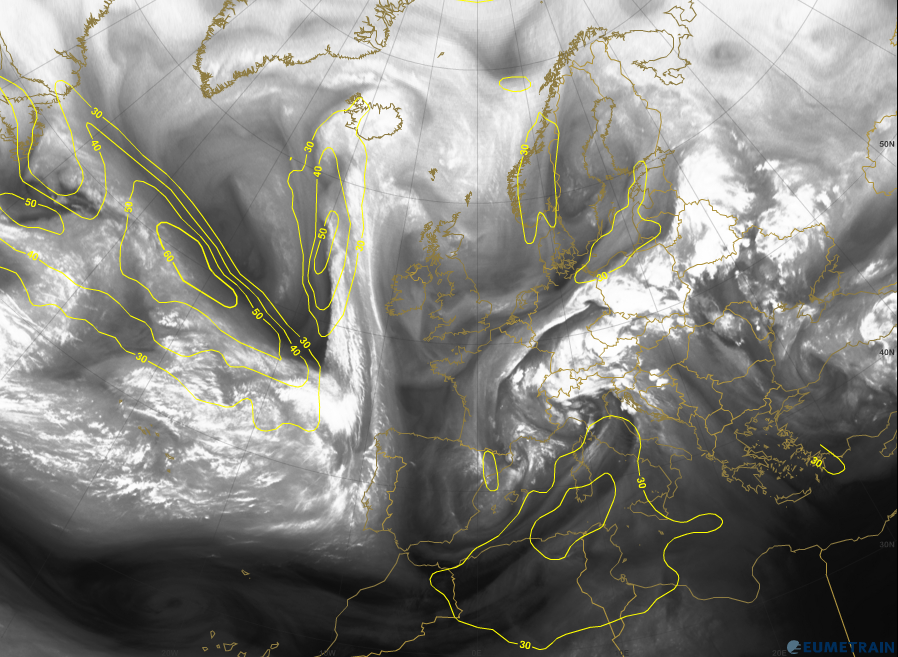
a)  |
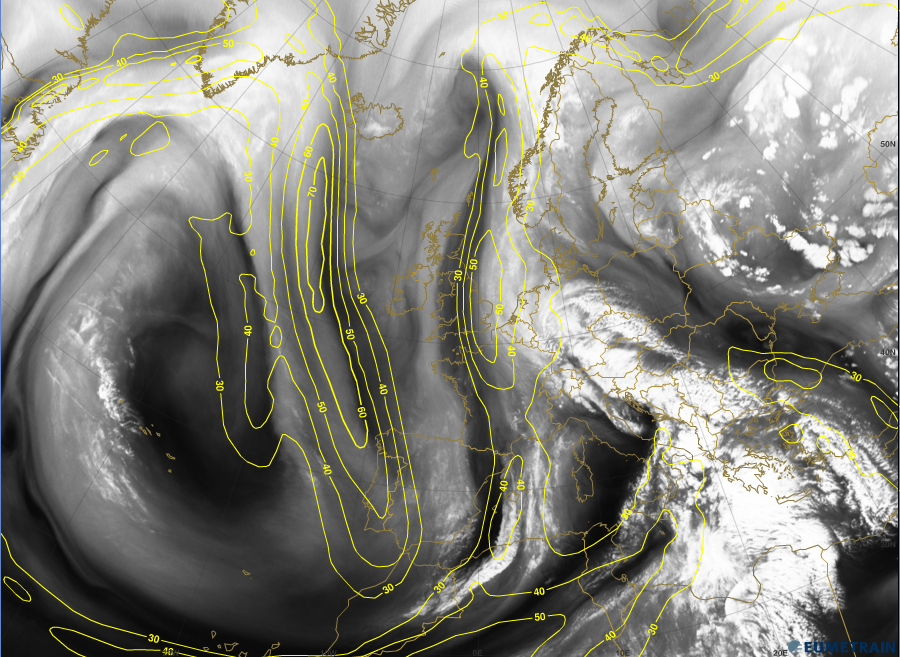
b)  |
Figures 4a and 4b show a real WV 6.2 µm (left) and a simulated WV 6.2 µm (right) satellite image. The yellow isolines depict the isotachs at 300 hPa.
Question
In the next three images (WV 6.2 µm) click on where you think the jet streak is.
- Solution: Click here for the WV image with isotachs at 300 hPa.
- Solution: Click here for the WV image with isotachs at 300 hPa.
- Solution: Click here for the WV image with isotachs at 300 hPa.
Black stripes and tropopause folding
Dark stripes in WV imagery are a sign of ongoing dynamical processes in the troposphere. These processes can be the formation of new cyclones (e.g. rapid cyclogenesis, an upper level low or frontal waves) or the propagation of frontal zones.
Frontal zones mark the transition from warmer (moist, high tropopause) to colder (dry, low tropopause) air masses or vice versa. Sharp boundaries in WV images indicate a transition from dry to moist air masses, and they are areas with strong gradients in the height of the PV=1.5 PVU surface. These strong gradients of height changes are called tropopause folds (see figure 5).
Notice:
| Tropopause folds can be best observed in WV images, since the lower dynamic tropopause goes hand in hand with sinking dry stratospheric air, which is easily detected in WV channels. |
a) 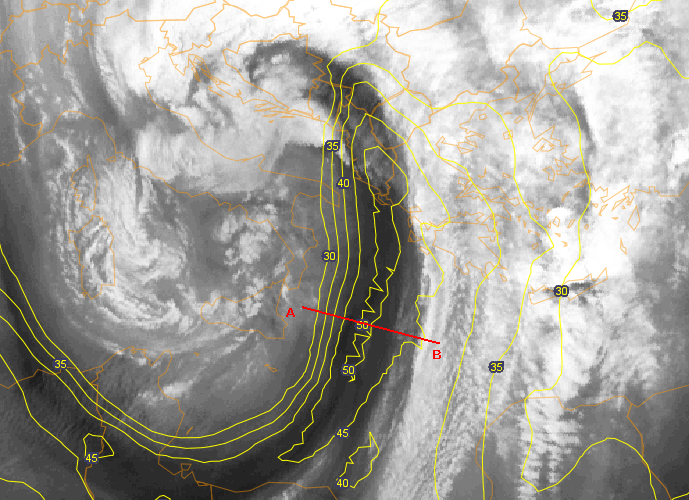 |
b) 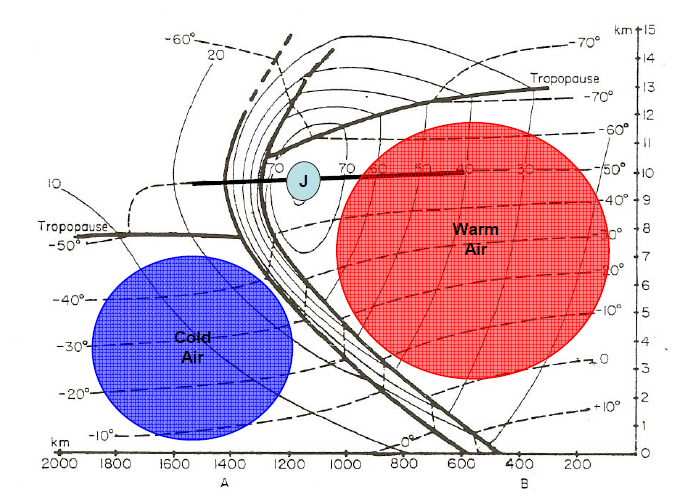 |
Figure 5a and 5b: The left image shows the approximate position of the vertical cross section and the isolines of the jet on the WV 6.2 µm image. The right image shows a vertical cross section (from Christopher T. Kuhl, 2006) with the lower tropopause on the cold side of the front, the higher tropopause on the warm side and the tropopause fold in between.
Tropopause folds connected to air mass boundaries are prone to dynamical turbulence. Turbulence is caused by the change from laminar to disturbed flow. Eddies are generated in the flow which receive the energy from the background current. The energy cascades from the macro scale current to smaller and smaller eddies or physical scales.
The reasons behind an atmospheric stream becoming turbulent are manifold, reaching from thermal instability and orography to strong wind shear.
A closer look at areas with tropopause folds reveals two factors facilitating the generation of turbulent flows: strong vertical wind shear caused by the jet streak and unstable stratified air masses due to the propagating air mass boundary.
Figure 6: Schematic of a tropopause fold with warm air on the left side and cold air on the right side. Potential temperature depicted in black lines, isotachs in dashed lines. (Shapiro, 1980)
When tropopause folding occurs, a tongue of dry stratospheric air propagates into the air mass boundary underneath the core of the jet stream by ageostrophic forcing (figure 6). This tongue of stratospheric air is delineated by a clear gradient in potential vorticity at its boundaries.
While the wind shear remains strong in the vicinity of the jet streak, the intruding stratospheric air is thermally stable. This is not the case at the upper and lower limit of the dry intrusion. There, thermal instability and strong vertical wind shear favour the occurrence of turbulence (figure 7).
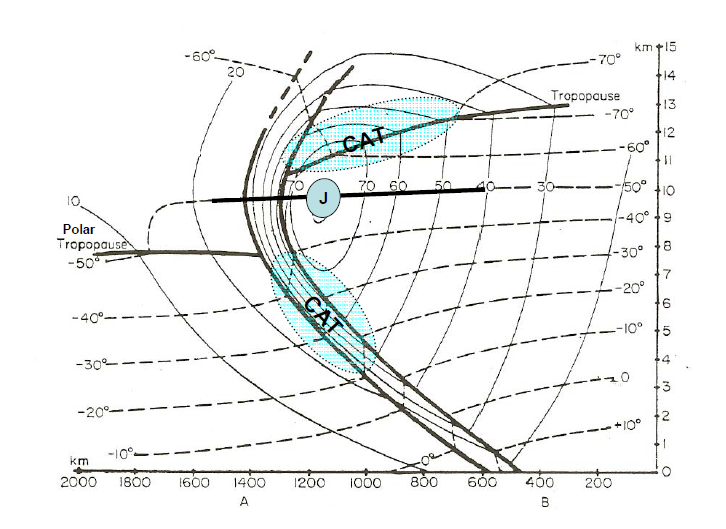
Figure 7: Vertical cross section through a cold front showing the areas prone to turbulence in the vicinity of the jet axis (from Chr. T. Kuhl, 2006).
Hence, the presence of a jet streak (a black stripe in WV imagery) indicates a dry stratospheric intrusion located along an air mass boundary, and they are good indicators of areas prone to turbulence. The exact vertical positions of turbulent areas near tropopause foldings become visible in cross sections depicting the location of the entire tongue of stratospheric air (figure 8).

Figure 8: Frequency of light or greater turbulence from eddy dissipation reports near tropopause folds (Dec. 2004 to Feb. 2005) from Wimmers and Feltz, 2010.(1 gcd ~ 111 km). The tongue of stratospheric air is depicted by the white line.