Intro
Simulated satellite images are produced by ECMWF on a regular basis out to five days. These images are generated from the model forecast data using the same radiative transfer algorithm (RTTOV) as in the operational data assimilation.
Simulated satellite images have the same units, format and resolution as the MSG satellite data that forecasters are familiar with. They show WV brightness temperatures as if they were observed from MSG satellites, including the same viewing angle and projection. These images can be easily compared with real IR and WV images for that time.
Despite having the same resolution, real and simulated WV images can be distinguished quite easily. As seen in figure 1, a side-by-side comparison of real and simulated WV 6.2 µm channels shows that the simulated WV image is much smoother and reveals fewer details. This comparison also demonstrates the richness of atmospheric processes depicted in real WV imagery, which model analysis cannot simulate.
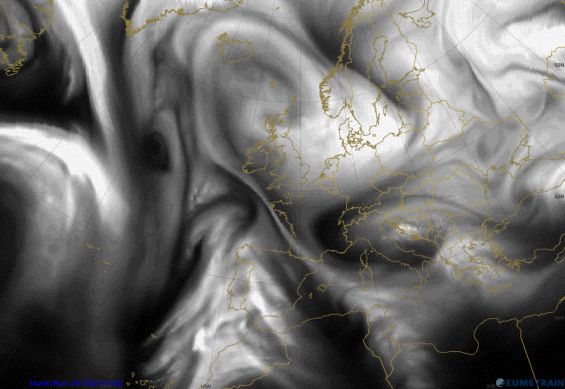
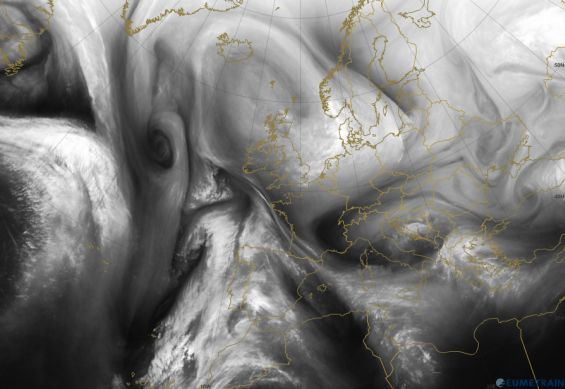
Figure 1a and 1b: Simulated (background) and real (overlay) WV 6.2 µm satellite image from 18 February 2013 at 12:00 UTC.
This chapter will focus on three ways in which simulated WV images can deviate from real ones:
- Displacements
- Patterns and sub-structures
- Greyscales
Real and simulated WV images are hardly ever similar. Nevertheless, it is important to identify synoptically relevant differences; small deviations do not need to be taken into consideration.
When differences between observation and model output are noticed by comparing WV imagery, it is important to know that the implications are valid only for the area in question, and most probably only for the upper troposphere. In no way they can be generalized for the whole model domain.
When comparing real and simulated WV images, one should always use the latest model run.