Vertical Cross Sections
In the previous chapters the process with its underlying physical background was analysed by help of the satellite images and numerical parameter fields on certain pressure levels. In this chapter Vertical Cross Sections are used to further investigate the following features of the development:- Analysis of the cold front and the second wave
- The downward protrusion of stratospheric air
Vertical Cross Sections (VCS)
|
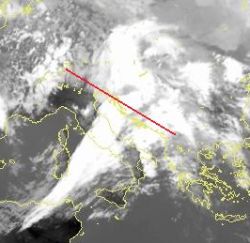
10 March 2006, 12 UTC |
|
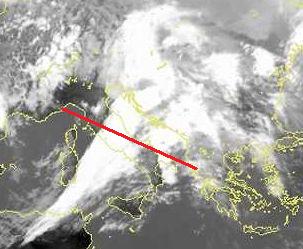
10 March 2006, 12 UTC |
|
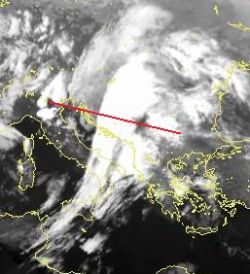
10 March 2006, 18 UTC |
Summary
The vertical cross sections (VCS) are mostly located in the region where the second wave appears. The reason for that is the strenght and explicitness of the whole process. All three VCSs show unstable frontal surfaces with steeply downward inclined isentropes. From the distribution of the temperature advection field it can be clearly seen that the cold front is under the cold advection. There is upward motion within and above the crowding zone of the isentropes which matches with high values of relative humidity in that region of the vertical cross sections. The cross sections of potential vorticity, especially the one at 18 UTC, show dry intrusion from lower stratosphere as it can be nicely seen on WV images. Dry intrusion is also visible in the values of relative humidity in the VCS at 18 UTC, where it has a form of a tongue. The air protruded from the stratosphere, as well as positive vorticity advection, most noticable in 12 UTC cross section, are responsible for further ehancemend of the cyclogenetic processes.