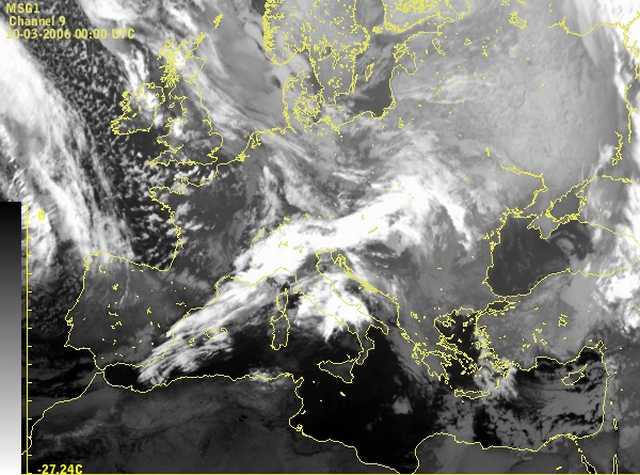
10 March 2006, 00 UTC
The cloud band of the cold front whose development we are following in this case
study is located over the central Europe and the western Mediterranean.
Eastern and northeastern parts of Europe are under the influence of a high
pressure system. In the Atlantic, near Iceland, a deep low and a wide cloud band
associated with the occlusion can be seen.
10 March 2006, 02 UTC
The situation is similar to the one two hours earlier, but now the begining of
a wave development over the northern Italy can be seen. The cloud band in the image
is characterized by the brighter grey shades in the central and rear part. This indicates
the presence of multi-layered cloudiness with more higher cloud tops to the
rear edge of the front.
10 March 2006, 04 UTC
The form of the wave is now better seen and it looks like a white cloud bulge at the rear side of
the cold front. The area of the cloud bulge is white, indicating cloudiness
with cold cloud tops.
In this image the jet fibre can be clearly seen over northern Africa and the Balearic
Islands.
10 March 2006, 06 UTC
Cold advection can be observed behind the frontal cloud band. There is a warm
advection in front of the cloud band and in the wave region.
10 March 2006, 08 UTC
At this stage of development a cloud spiral develops from the cloud bulge.
Simultaneously a new wave is developing over the central Italy.
10 March 2006, 10 UTC
In the past two hours the development was quite rapid. The cloudiness of the wave is much more prounounced and
the S shape is clearly seen over
the central Italy and the Tirenian sea.
10 March 2006, 12 UTC
At this moment the wave is not prominent any more because it is developing into a new system with occlusion,
warm and cold front. An interesting appearence that can
be seen at this moment is the lee cloudiness over the southern Italy caused by
the strong southwesterly stream ahead of the cold front.
10 March 2006, 14 UTC
The system is now fully developed. The occlusion cloud band, associated with the
surface low (see 1000 hPa geopotential height), as well as the warm front and
the cold front with the second wave are clearly seen.
10 March 2006, 16 UTC
Convective cells caused by development in the cold air can be seen over the central Europe and north Italy
after the passage of the cold front due to the strong cold advection. The front is
continuing to move
further to the east.
10 March 2006, 18 UTC
At this moment the occlusion cloud band dissolves and the S shape
indicating the wave at the cold front is getting more pronounced. Convection
over the Po valley and Italian Alps is enhanced.
10 March 2006, 20 UTC
Cold front has passed across the northern Italy and western Croatia. In those regions
it caused heavy rainfall and formation of a snow cover in the mountains.
10 March 2006, 22 UTC
At this moment the cloudiness is more prounounced then two hours earlier. The
S shape is now revealing a cyclonic type of circulation.
10 March 2006, 23 UTC
As seen in the synoptic chart, the system is now located over
the southeastern Europe. It consists of the cold front streched in north-south direction and
a warm front
with high cloudiness over the Black Sea.
Analysis from 11 March 2006, 00 UTC