Chapter I: Introduction and damage report
Table of Contents
- Chapter I: Introduction and damage report
- Introduction and damage report
Introduction and damage report
This case study will present the circumstances and explain the processes that led to severe flooding in both Slovenia and Croatia in September 2010. The study is motivated by the fact that the floodings were initiated by precipitation amounts exceeding many recorded rainfall amounts causing immense property damages and even human casualties.
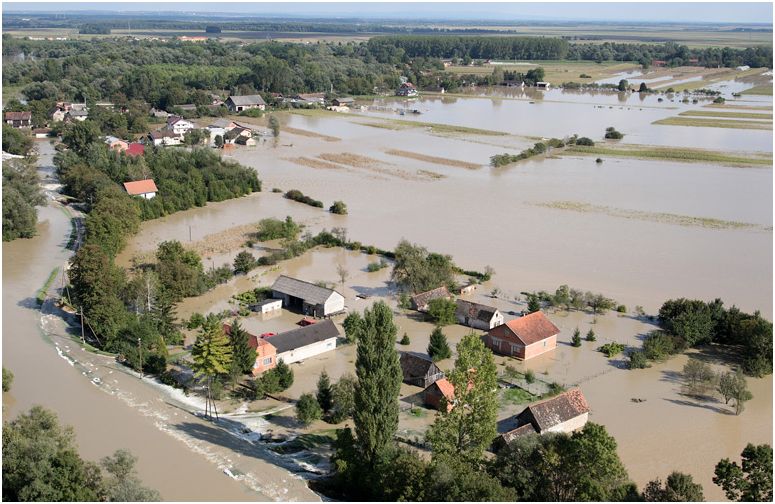
Figure 1.1: Floods in the vicinity of Zagreb, region Posavina
The last days of summer 2010 were marked by heavy rainfall, floods and flash floods in Slovenia and Croatia. Even though the prognostic material was giving clear signs of a likelihood of heavy rain and the warnings were issued several days in advance, the amount of rain was so great that avoiding all damage was not possible.
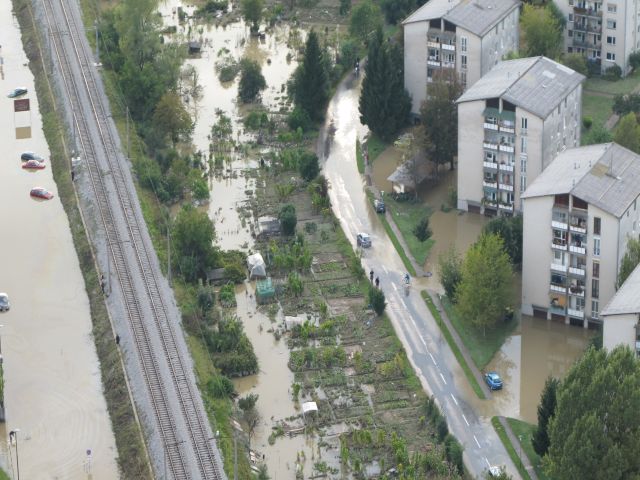
Figure 1.2: Floods in Slovenia in the south part of Ljubljana. Source ARSO.
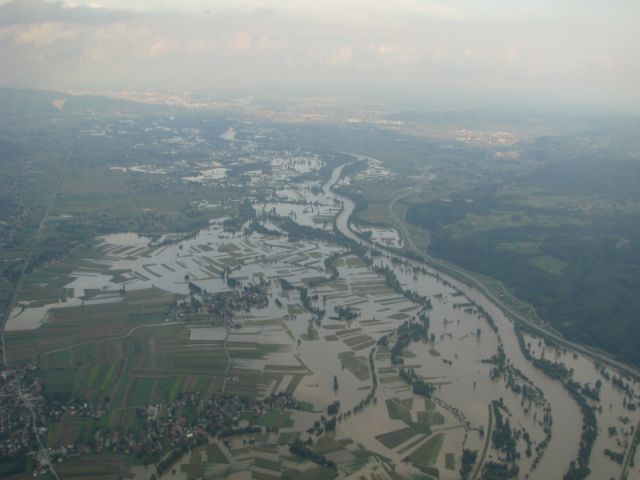
Figure 1.3: Floods in Slovenia in the vicinty of the Croatian border. Source ARSO.
From a climatological point of view, rains this heavy had not been recorded in the last 100 years, and in Croatia, the rainfall in the Sava Valley was even greater than in the 1964 flood, after which a new system of flood control was built. Unfortunately, even some human casualties were reported, as well as agricultural damage and damage to roads, houses and other property. During the weekend from the 17th to the 19th of September all border crossings from Croatia to Slovenia were closed in Istria due to slides and floods. Because of the hydrological conditions we are analyzing this event together with our Slovenian colleagues. Within three days, more than 500 mm of rain was recorded locally in the region spreading from the Alps to western Croatia. The maximum of more than 500 mm was in western Slovenia.
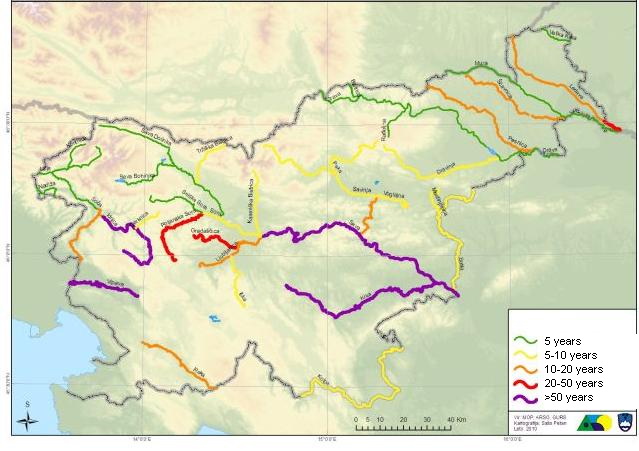
Figure 1.4: Return periods for strenght of floods for some rivers in Slovenia. Source ARSO.
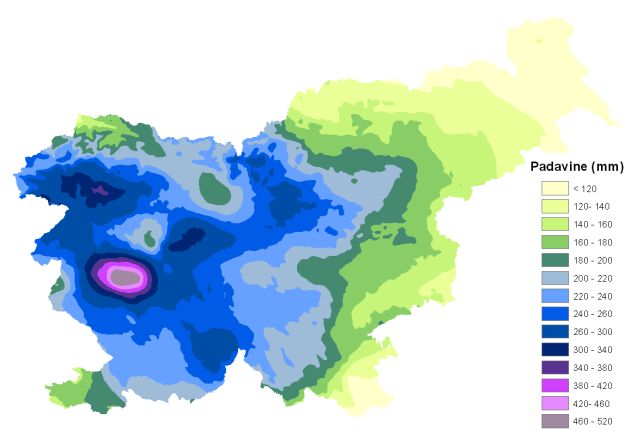
Figure 1.5: Precipitation accumulation from 16 Sept at 6 UTC to 20 Sept. 2010 at 18 UTC in Slovenia. Source ARSO.
The highest amount of rain was registered in western Slovenia at the Otlica station (Fig 1.5) and was around 500 mm in 24 hours. At the Crni Lug-Risnjak weather station in the mountainous region in western Croatia, for example, 324 mm of rain was recorded between the 17th and 19th of September. The average amount of precipitation in the North Adriatic and Gorski kotar was between 100 and 200 mm, which is two times as much as the monthly mean value for this time of year. In the northwestern parts of Croatia the amount of rain was in the range of 100 and 150 mm, but the main problem was the water that came down the Sava River from the Alpine region.
| Location | Rain / mm (17, 18, 19 Sep.) |
|---|---|
| Risnjak | 324 |
| Parg | 224 |
| Kukuljanovo | 211 |
| Delnice | 208 |
| Rijeka | 193 |
| Sljeme | 141 |
| Porec | 124 |
| Krapina | 122 |
| Zagreb Gric | 89 |
| Zagreb Maksimir | 87 |
| Sisak | 80 |
| Karlovac | 69 |
Table 1.1: Accumulated rainfall at some weather stations in Croatia for 17th, 18th and 19th September 2010.
The majority of the rainfall occurred between the night of the 17th and the morning of the 18th, with a second peak in the night between the 18th and 19th. Extreme rainfall caused flash floods and rising of the river level, resulting in flooding in the river valleys.
The accumulation of precipitation over Slovenia (using ground measurements) from 16 to 20 September 2010 is shown in Fig. 1.5. The greatest precipitation was recorded in the area near Ajdovscina and Idrija, and there were also local measurements of more than 500 mm in 48 h. See Table 1.2 for more details on specific locations in Slovenia.
| Location | 17 Sep. | 18 Sep. | 19 Sep. | 20 Sep. | 17 - 20 Sep. |
|---|---|---|---|---|---|
| Otlica (nad Ajdovscino) | 41 | 326 | 172 | 1 | 539 |
| Topol pri Medvodah | 60 | 158 | 101 | 0 | 320 |
| Mrzla Rupa (nad Idrijo) | 49 | 130 | 131 | 1 | 311 |
| Hotedrsica | 28 | 143 | 136 | 0 | 307 |
| Ajdovscina | 23 | 163 | 108 | 0 | 294 |
| Ljubljana Bezigrad | 44 | 140 | 87 | 1 | 271 |
| Postojna | 6 | 95 | 132 | 1 | 235 |
| Bovec | 6 | 95 | 132 | 1 | 235 |
| Dobrnic | 16 | 102 | 99 | 16 | 233 |
| Nova Gorica | 72 | 61 | 93 | 0 | 225 |
| Celje | 36 | 118 | 65 | 1 | 220 |
| Kredarica | 51 | 125 | 41 | 1 | 218 |
| Kocevje | 16 | 110 | 82 | 1 | 209 |
| Letalisce Portoroz | 3 | 23 | 129 | 1 | 155 |
| Novo mesto | 5 | 66 | 82 | 2 | 155 |
| Letalisce Cerklje ob Krki | 5 | 59 | 73 | 3 | 139 |
| Letalisce ER Maribor | 30 | 65 | 38 | 1 | 134 |
| Murska Sobota | 19 | 41 | 31 | 1 | 91 |
Table 1.2: Daily (24h) precipitation accumulation (mm) recorded at 6 UTC from 17 to 20 September 2010 and total accumulation in these 4 days (last column). Source ARSO.
In many places in central and western Slovenia the precipitation exceeded 200 mm in 24 h. In the Primorska region there was also very strong local precipitation, up to 33 mm in 30 minutes. Many local stations reached or exceeded the 100 year return period for 48 h precipitation accumulation, especially in central and southern Slovenia; see Table 1.3.
| Location | 48h Precip. acc. (mm) | Return period (years) | Previous record precip. am. | Previous record date |
|---|---|---|---|---|
| Otlica | 498 | >100 | 265 | 13.06.1982. |
| Hotedrsica | 279 | >100 | 229 | 12.12.2008. |
| Ajdovscina | 271 | >100 | 265 | 28.09.1926. |
| Ljubljana Bezigrad | 227 | >100 | 200 | 28.09.1926. |
| Dobrnic | 201 | >100 | 116 | 27.11.2005. |
| Celje | 183 | >100 | 162 | 22.09.1933. |
| Zgornje Loke pri Blagovici | 220 | >100 | 186 | 28.09.1926. |
| Lasko | 186 | >100 | 160 | 23.09.1933. |
| Topol pri Medvodah | 259 | 100 | 326 | 28.09.1926. |
| Postojna | 228 | 100 | 253 | 28.09.1926. |
| Kocevje | 191 | 100 | 182 | 01.08.1941. |
| Novo mesto | 148 | 100 | 125 | 29.09.1989. |
| Skofja loka | 213 | 100 | 231 | 28.09.1926. |
| Godnje | 252 | 100 | 384 | 28.09.1926. |
| Logatec | 267 | 100 | 243 | 16.08.1963. |
| Zalosce | 246 | 100 | 191 | 19.10.1961. |
| Letalisce Portoroz | 152 | 25 | 147 | 23.09.1996. |
| Letalisce ER Maribor | 103 | 10 | 141 | 05.08.2009. |
| Mrzla Rupa | 261 | 5 | 357 | 07.02.1951. |
| Nova Gorica | 153 | 5 | 319 | 07.10.1987. |
| Kredarica | 166 | 55 | 240 | 14.11.1969. |
| Murska Sobota | 72 | 5 | 138 | 15.07.1972. |
| Ziri | 132 | 5 | 338 | 28.09.1926. |
| Bovec | 157 | 1 | 584 | 14.11.1969. |
Table 1.3: Precipitation accumulation in 48 hours, return periods, past precip. records and past date. New precip. records are indicated in red. Source ARSO.
In the animation of radar maximal reflectivity (in dBz) it can be seen that practically the whole day of 18 September and also in the night to the 19 September the precipitation was more or less present over Slovenia with two precipitation maximums, both during the nights.
Figure 1.6: Radar Maximal echoes from 18 Sep (00:00UTC) to 19 Sep 2010 (11:00UTC), time step 10 minutes