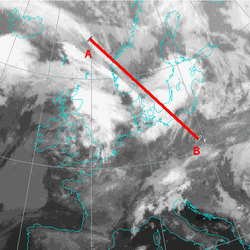


The backward inclined isolines of the equivalent potential temperature (black solid lines) show a position of the frontal zone. High pixel values (orange solid lines) in the satellite image in front of the frontal zone are connected with frontal cloudiness.
Isotachs (wind speed)
Above the crowding zone of the equivalent potential temperature the isotach maximum (yellow solid lines) is situated with a maximum at 450 hPa level.